
Dividend Snapshot
Fabtech Technologies Limited (NSE: FABTECH, BSE: 544558, ISIN: INE0HF201011) has declared a final dividend of ₹0.60 per equity share for the financial year ended 31 March 2026. On a face value of ₹10, that headline works out to a 6% dividend — but on the traded share price the real cash yield is only about 0.41%. This is the company’s first dividend since its October 2025 IPO.
Dividend At A Glance
- Dividend Type: Final Dividend
- Dividend Per Share: ₹0.60
- Dividend on Face Value: 6% (Face Value ₹10)
- Real Yield at Market Price: ~0.41%
- Financial Year: FY 2025–26
- Total Cash Outflow: ₹266.70 lakh (₹2.67 crore)
The One-Line Takeaway
The payout is tiny relative to both earnings (covered 16.7 times) and the post-IPO cash pile (covered roughly 82 times), so affordability is never in doubt. The genuine talking point is that the company converted only ₹0.48 crore of its ₹38.36 crore consolidated profit into operating cash during FY26 — so this maiden dividend is effectively funded from the balance sheet, not from the year’s operations.
Dividend Announcement Summary
At its board meeting held on Monday, 27 April 2026, the Board of Directors of Fabtech Technologies recommended a final dividend of ₹0.60 per equity share of face value ₹10 for FY 2025–26, subject to shareholder approval at the Annual General Meeting. The meeting (which ran from 1:30 p.m. to 8:45 p.m.) also approved the audited standalone and consolidated results for the year and authorised opening a step-down subsidiary in the Sultanate of Oman.
What The Company Disclosed
- A final dividend requires AGM approval before payment.
- The company stated total cash outflow on dividend would be ₹266.70 lakh (Note 10 of results).
- At announcement, the record date was “to be intimated in due course”.
- The dividend was subsequently approved by shareholders at the 8th AGM on 24 August 2026.
Integrity Check
We independently recomputed the outflow: 4.445 crore shares × ₹0.60 = ₹266.70 lakh, which matches the company’s disclosed figure to the paisa. That confirms the share count (paid-up capital ₹4,445.08 lakh ÷ ₹10 face value) is consistent with the announced payout.
Key Dates Timeline
| Event | Date | Status |
|---|---|---|
| Board Meeting / Announcement | 27 April 2026 | Confirmed (company filing) |
| AGM Approval | 24 August 2026 | Confirmed (AGM outcome) |
| Record Date | 17 August 2026 | Confirmed (company filing) |
| Ex-Dividend Date | ~17 August 2026 | Inferred (aligns with record date under T+1; verify against NSE/BSE circular) |
| Payment Date | By ~23 September 2026 | Statutory inference (within 30 days of AGM); not separately disclosed |
The record date of 17 August 2026 has already passed. Only shareholders whose names appeared in the register on that date were eligible for this dividend. Because a final dividend must be paid within 30 days of AGM declaration under the Companies Act, 2013, payment fell due by roughly 23 September 2026. Investors should confirm the exact ex-date and credit date from the official NSE/BSE corporate-action notices.
Dividend Yield Analysis
The Face-Value Illusion
A “6% dividend” sounds generous, but that 6% is calculated on the ₹10 face value, not on what you actually pay for the share. The number that matters to an investor is the yield on the market price:
- At the announcement-day close (~₹154.80, BSE, 27 Apr 2026): yield = ₹0.60 ÷ ₹154.80 = 0.39%
- At the recent market price (~₹147, 11 Sep 2026): yield = ₹0.60 ÷ ₹147 = 0.41%
- Yield on face value (the headline): ₹0.60 ÷ ₹10 = 6.00%
Yield Reality Check
The real yield here is not high because the price collapsed or because of a one-off special payout. It is low simply because the company chose a token distribution — a 7% payout ratio — while reinvesting the rest, including a large pool of unspent IPO money. This is a deliberate, low-yield, growth-oriented dividend, not a value trap.
Context
A 0.41% yield is well below a typical bank fixed deposit or a high-dividend PSU. For most holders, this dividend is symbolic — a signal that the newly-listed company intends to return some cash — rather than a meaningful income stream. The stock has traded between a 52-week low of about ₹126 and a high of about ₹263.
Dividend History Analysis
Fabtech Technologies listed on the NSE and BSE only on 7 October 2025. As a listed company, this ₹0.60 final dividend for FY 2025–26 is its maiden (first) dividend. Publicly available records show a 0% dividend payout ratio for FY2020 through FY2025, with the first payout ratio (7%) appearing only in FY2026.
| Financial Year | Dividend / Share | Payout Ratio |
|---|---|---|
| FY2021 | Nil | 0% |
| FY2022 | Nil | 0% |
| FY2023 | Nil | 0% |
| FY2024 | Nil | 0% |
| FY2025 | Nil (as listed entity) | 0% |
| FY2026 | ₹0.60 (Final) | ~7% |
Classification
With only a single data point, Fabtech cannot yet be classified as a Consistent, Cyclical or Irregular payer. It is best described as a maiden payer with an unproven track record. Whether this becomes a recurring policy or a one-off gesture is the single most important thing income-focused investors should watch over the next two or three years.
Financial Performance Analysis
Consolidated FY2026 (year ended 31 Mar 2026)
| Metric | FY2026 | FY2025 | Change |
|---|---|---|---|
| Revenue from Operations | ₹410.77 Cr | ₹326.67 Cr | +25.7% |
| Total Income | ₹431.33 Cr | ₹335.94 Cr | +28.4% |
| Net Profit (PAT) | ₹38.36 Cr | ₹46.45 Cr | −17.4% |
| PBT before exceptional items | ₹46.50 Cr | ₹42.59 Cr | +9.2% |
| Basic EPS (reported) | ₹10.00 | ₹14.34 | — |
The Operating-Leverage Story: Revenue Up, Profit Down — Why?
The headline looks jarring: revenue jumped 25.7% yet reported net profit fell 17.4%. The explanation is not operational deterioration — it is a base effect. FY2025 profit was inflated by a large one-time exceptional gain of ₹17.85 crore (profit on sale of a stake in an associate). FY2026 had only a small ₹1.77 crore exceptional gain. Strip out these one-offs and profit before exceptional items and tax actually grew about 9.2%. The reported profit fall is an accounting artifact of last year’s one-time windfall, not a collapse in the underlying business.
Margin Pressure Is Real, Though
Operating margin did compress: operating profit margin fell to roughly 9% in FY2026 from about 12% in FY2025. For a turnkey pharma-engineering firm, margins swing quarter to quarter with project mix and execution timing — the December 2025 quarter, for instance, was loss-making at the operating level, while the March 2026 quarter rebounded strongly. This lumpiness is structural to project businesses and is worth remembering when reading any single quarter.
Cash Flow Analysis
The Standout Finding: Profit Did Not Become Cash
Reported profit is an opinion; cash is a fact. And here the gap is stark. Consolidated operating cash flow (OCF) for FY2026 was just ₹0.48 crore — only 1.2% of the ₹38.36 crore net profit. On a standalone basis, operating cash flow was actually negative ₹1.36 crore. This is the most important number in the whole disclosure and one that wire-service coverage skips entirely.
Why Cash Leaked Out
Operating profit before working-capital changes was a healthy ₹42.91 crore. But money got trapped in working capital. Trade receivables ballooned by about ₹49 crore to ₹204 crore — equal to roughly 182 days of sales. Money the company has “earned” is sitting in customer invoices, not in the bank. A partial release from inventory (down ~₹38 crore) softened the blow, but not enough.
How The Dividend Is Actually Funded
After capital expenditure of about ₹4.71 crore, free cash flow was marginally negative (roughly −₹4.2 crore on an OCF-minus-capex basis). Put plainly: FY2026 operations did not generate the cash for this dividend. The ₹2.67 crore is being paid out of the company’s large accumulated cash and IPO proceeds — a balance-sheet-funded distribution, not an operations-funded one.
Balance Sheet Strength
If the cash flow is the worry, the balance sheet is the reassurance. Following its October 2025 IPO (which raised about ₹207 crore in fresh equity), Fabtech sits on a large cash cushion.
Liquidity (Consolidated, 31 Mar 2026)
- Cash & cash equivalents: ₹86.88 Cr
- Other bank balances: ₹121.69 Cr
- Current investments: ₹9.76 Cr
- Core liquid pool: ₹218.33 Cr
Debt & Net Position
- Total borrowings (ex-lease): ₹42.73 Cr
- Net cash (ex-lease): ~₹175.6 Cr
- Total equity: ₹419.77 Cr
- Book value: ~₹94 per share
The company is net-cash by roughly ₹175 crore. The entire ₹2.67 crore dividend equals a little over 1% of the liquid pool. Debt is modest and mostly short-term working-capital borrowing. There is no solvency question attached to this payout — the issue, as the cash-flow section shows, is purely about whether profits are converting into cash quickly enough.
Dividend Sustainability Analysis
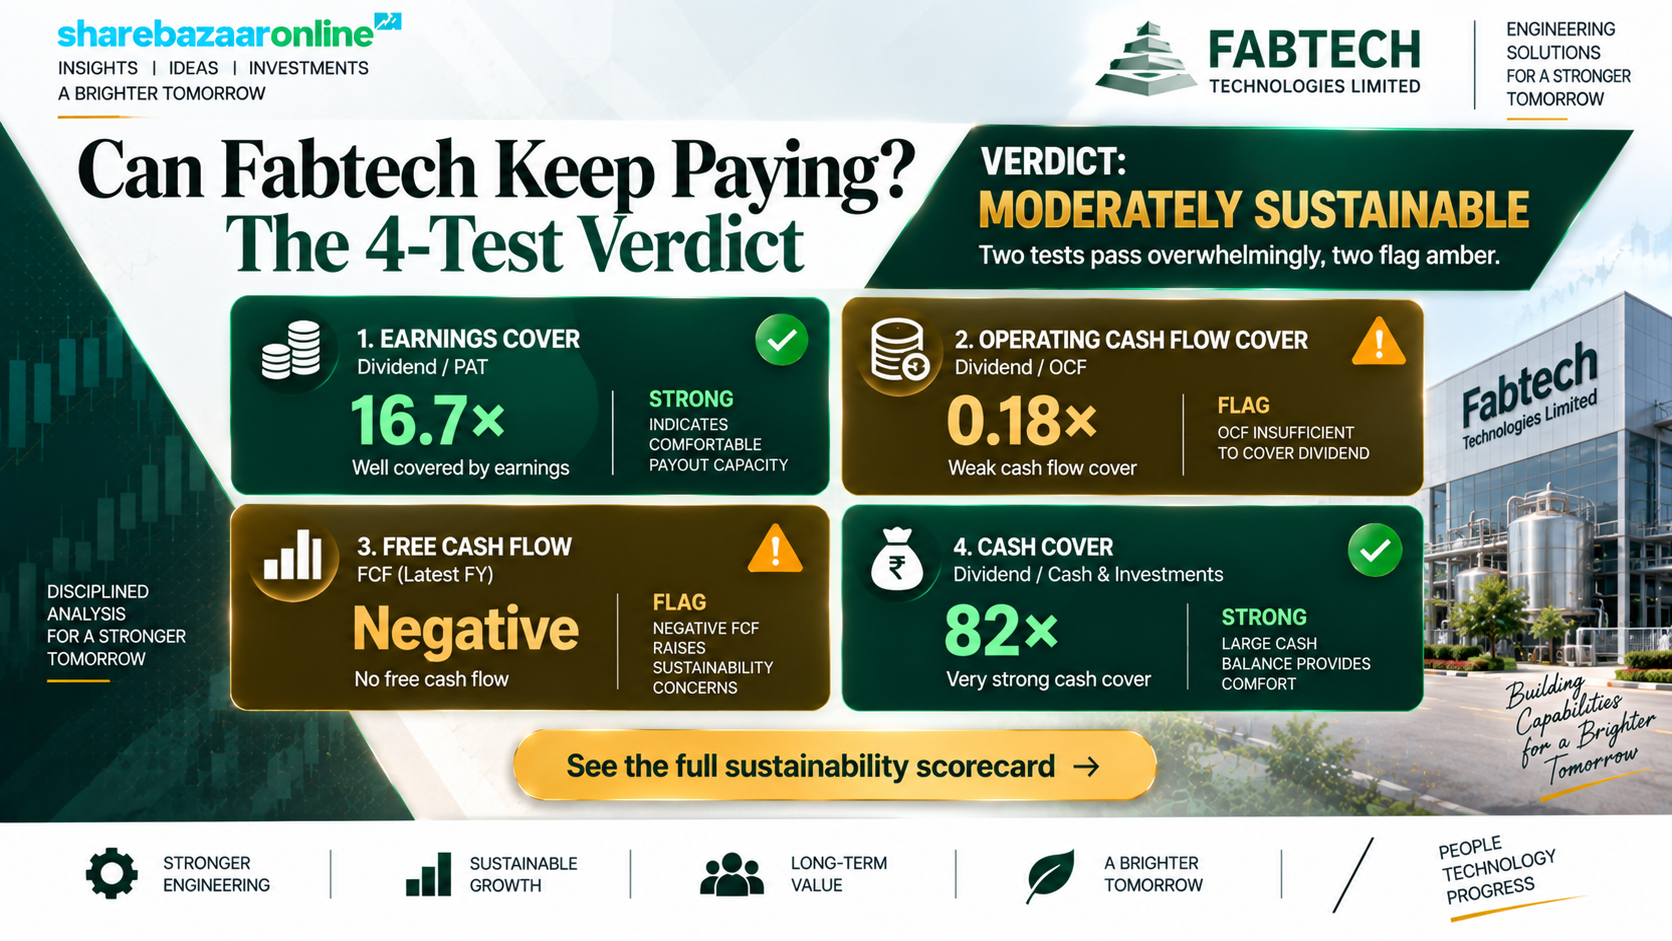
Four-Test Sustainability Scorecard
| Test | Coverage | Verdict |
|---|---|---|
| Earnings cover (EPS ₹10 ÷ DPS ₹0.60) | 16.7× | Very strong |
| Operating cash flow cover (OCF ÷ dividend) | 0.18× | Weak (FY26) |
| Free cash flow cover | Negative | Weak (FY26) |
| Liquidity / cash cover (cash pool ÷ dividend) | ~82× | Overwhelming |
Verdict: Moderately Sustainable
Two tests pass overwhelmingly (earnings and liquidity), two fail (current-year OCF and FCF). Because the payout is a token 7% of profit and the cash cushion covers it more than 80 times over, affordability is not in question — the company can comfortably keep paying at this level for years. The single caveat is that the payout is currently funded from the balance sheet rather than from operating cash. For the dividend to become organically funded and grow, Fabtech must convert its swelling receivables back into cash. We classify this as Moderately Sustainable: safe on affordability, unproven on cash conversion.
Peer Comparison
Fabtech occupies a narrow niche — turnkey engineering for pharmaceutical and biopharma plants (design, procurement, cleanrooms, HVAC, installation and validation) — so there is no clean set of listed pure-play peers. The closest listed process-engineering / EPC reference points are larger, more diversified names such as Praj Industries and Thermax. Both are established dividend payers with higher payout ratios, yet they too trade at modest market dividend yields, typical of growth-oriented engineering companies.
Fabtech’s Own Return Metrics
| Metric | Fabtech (FY2026) |
|---|---|
| Dividend Yield (market) | ~0.41% |
| Dividend Payout Ratio | ~7% |
| Return on Equity (ROE) | ~12.5% |
| Return on Capital Employed (ROCE) | ~13.6% |
| Stock P/E | ~13–14× |
Peer-specific yield, payout and return figures should be re-verified against current data before publication; direct comparability is limited by Fabtech’s niche and short listing history.
Promoter Impact Analysis
Shareholding Pattern (Mar 2026)
- Promoters: 68.94%
- Public / Retail: 28.83%
- Domestic Institutions (DII): 2.15%
- Foreign Institutions (FII): 0.08%
Where The ₹2.67 Crore Goes
- To promoters (68.94%): ~₹1.84 crore
- To public + institutions (31.06%): ~₹0.83 crore
Because promoters own more than two-thirds of the company, the majority of the dividend flows back to them — roughly ₹1.84 crore of the ₹2.67 crore. For minority and retail shareholders, the benefit is proportionally small in absolute terms. That said, the payout ratio is low and equal per share, so this is a symmetric distribution rather than one skewed by structure. The more meaningful promoter signal is that management felt confident enough about the balance sheet to begin returning cash at all, so soon after listing.
Taxation Analysis
How Dividends Are Taxed In India
Since April 2020, dividends are taxed in the hands of the investor at their applicable income-tax slab rate (added to “Income from Other Sources”). There is no separate Dividend Distribution Tax. The company must deduct TDS at 10% under Section 194 only if the total dividend paid to a resident shareholder exceeds ₹5,000 in a financial year (a Form 15G/15H can be filed to avoid TDS where eligible).
Worked Example (Generic ₹10/Share, 30% Slab)
Using the standard illustration — an investor holding 1,000 shares receiving ₹10 per share, in the 30% slab:
- Gross dividend: 1,000 × ₹10 = ₹10,000
- TDS at 10% (as it exceeds ₹5,000): ₹1,000 (adjustable against final tax)
- Tax at 30% slab: ₹3,000
- Net in hand after tax: ₹7,000
- Effective post-tax yield on that dividend: 70% of gross
Fabtech-Specific Reality
At Fabtech’s ₹0.60 per share, a holder of 1,000 shares receives just ₹600 gross. Because that is well below the ₹5,000 threshold, no TDS is deducted. In the 30% slab, tax would be about ₹180, leaving roughly ₹420 net. A shareholder would need to hold more than about 8,300 shares before this single dividend crosses the ₹5,000 TDS trigger. For most retail holders, the tax paperwork here is negligible.
Key Risks
- 1. Weak cash conversion. FY2026 operating cash flow was only 1.2% of profit, and standalone OCF was negative. If receivables (already 182 days) keep rising, the company will keep “earning” profits that don’t turn into spendable cash.
- 2. Lumpy, project-driven earnings. As a turnkey EPC business, revenue and margins swing sharply quarter to quarter (the Dec-2025 quarter was operating-loss-making). A single delayed or low-margin project can distort any period.
- 3. High customer / geographic concentration. A large share of revenue comes from overseas markets (Saudi Arabia, UAE, Kenya, Rest of the World), exposing the company to foreign-exchange swings, collection risk and cross-border execution delays.
- 4. IPO-money deployment risk. A very large pool of unutilized IPO proceeds (reported at roughly ₹159 crore as of mid-2026) still needs to be deployed productively; poor deployment would drag down return ratios that have already softened (ROCE fell from ~22% to ~14%).
- 5. Unproven dividend track record. This is a maiden payout with no history. Investors buying for income have no evidence yet that the dividend will recur, let alone grow.
What To Monitor
- 1. Receivable days and operating cash flow. Watch whether debtor days fall back from 182 and whether OCF starts tracking closer to reported profit. This is the single most important signal for dividend durability.
- 2. Order book and new order inflows. Fresh turnkey orders (especially from the Middle East and Africa) drive future revenue; monitor management’s disclosed order-book and conversion rates each quarter.
- 3. Deployment of unutilized IPO proceeds. Track how the ~₹159 crore of unspent IPO money is put to work and whether it lifts revenue and return ratios.
- 4. Progress of overseas subsidiaries. The planned Oman step-down subsidiary and the new Saudi Arabia entity are growth bets; watch incorporation, funding and first revenues.
- 5. Second dividend and payout policy. The FY2027 dividend decision will tell you whether ₹0.60 was a one-off gesture or the start of a stated, repeatable policy.
Conclusion
Fabtech Technologies’ maiden final dividend of ₹0.60 per share is best understood as a symbolic first return of cash from a recently-listed growth company, not as an income opportunity. The “6%” headline is a face-value figure; the real market yield is about 0.41%.
Positives
- Revenue up 25.7%; underlying (pre-exceptional) profit up ~9%.
- Net-cash balance sheet (~₹175 crore); dividend covered ~82× by cash.
- Earnings cover the payout 16.7×; payout ratio a conservative ~7%.
- First shareholder return initiated soon after listing.
Negatives / Watch-Outs
- Operating cash flow just 1.2% of profit; standalone OCF negative.
- Free cash flow marginally negative; dividend funded from cash pile.
- Receivables at 182 days; margins and ROCE have softened.
- Real yield is negligible; no dividend track record yet.
In short: the dividend is affordable and safe, but its real significance is what it reveals — a fast-growing project business whose biggest challenge is turning reported profits into hard cash. The positives and negatives are laid out above; the investment decision is yours to make.
Frequently Asked Questions
What dividend has Fabtech Technologies announced for FY2026?
What is the real dividend yield on Fabtech Technologies?
What is the record date for the Fabtech Technologies dividend?
What is the ex-dividend date?
When will the Fabtech Technologies dividend be paid?
Who was eligible for the dividend?
How is this dividend taxed?
Is the Fabtech Technologies dividend sustainable?
What is Fabtech Technologies’ dividend history?
Why did profit fall when revenue rose?
How much of the dividend goes to promoters?
What should investors monitor going forward?
Where does the cash for this dividend come from?
Disclaimer
This article is for informational and educational purposes only and does not constitute investment advice, a recommendation, or an offer to buy or sell any security. ShareBazaar Online is not a SEBI-registered investment adviser. Figures are drawn from Fabtech Technologies’ audited FY2026 results and publicly available market data; market prices, yields and dates may change and should be independently verified against official NSE/BSE and company filings before any decision. Dividend eligibility, record dates and payment timelines are subject to corporate-action confirmation. Investing in equities involves risk, including possible loss of principal. Please consult a qualified financial adviser and conduct your own due diligence before investing.