
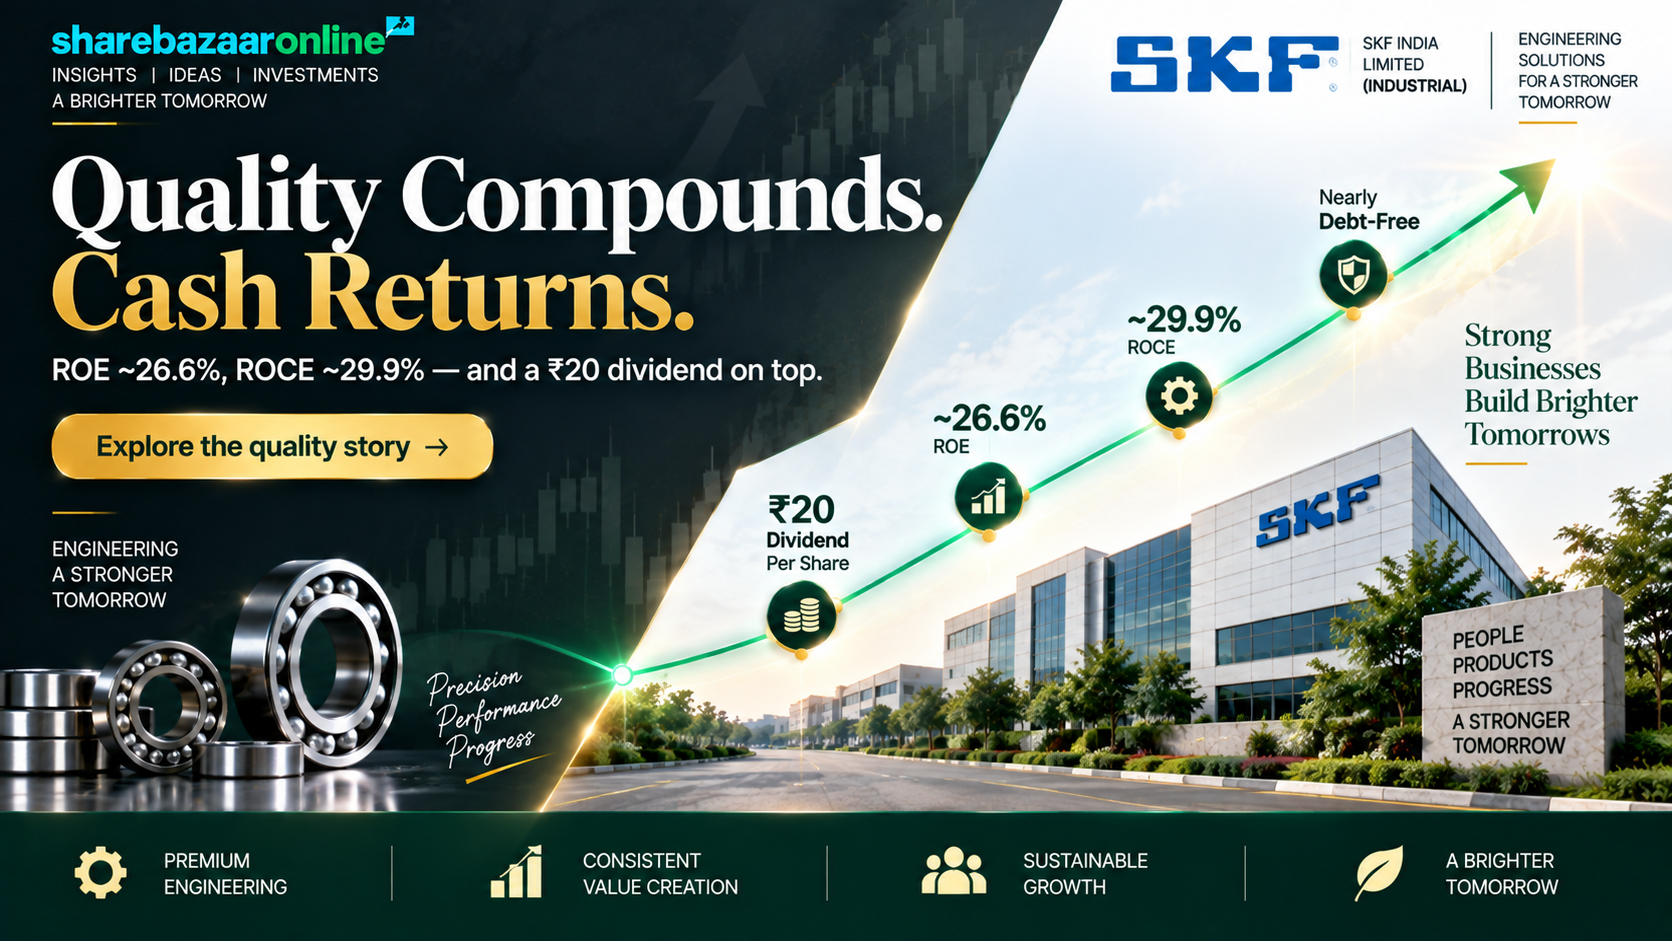
Dividend Snapshot
Company
SKF India (Industrial) Limited
NSE: SKFINDUS | BSE: 544572 | ISIN: INE2J8701016
Dividend Declared
₹20 per share Interim Dividend (200% of ₹10 face value)
Financial Year 2026-27
Key Numbers
- Dividend per share: ₹20
- Total cash outflow: ≈ ₹98.9 crore (company-disclosed ≈ ₹989 million)
- Dividend yield on this payout: 0.69% at CMP ₹2,888*
- Record Date: 17 August 2026
The ShareBazaar Angle
The company doubled its cash dividend from ₹10 (FY26) to ₹20 (FY27) — even though Q1 FY27 net profit fell about 14% while revenue rose 18%. A generous reward funded by a strong cash pile, not by rising quarterly earnings.
*CMP ₹2,888 = NSE/BSE close on 11 September 2026 (Source: Screener/exchange data). Figures analysed on a consolidated / restated basis as reported by the company.
Dividend Announcement Summary
At its Board Meeting on 11 August 2026 (which ran from 4:00 PM to 6:40 PM IST), the Board of Directors of SKF India (Industrial) Limited declared an interim dividend of ₹20 per equity share of face value ₹10 each for the financial year 2026-27. That is a payout equal to 200% of the face value.
What the company disclosed
- Interim dividend of ₹20/share for FY2026-27.
- Record Date fixed at 17 August 2026 under Regulation 42 of SEBI LODR.
- Estimated cash outflow of ≈ ₹989 million (≈ ₹98.9 crore).
- Q1 FY27 (quarter ended 30 June 2026) results reviewed by Deloitte Haskins & Sells LLP with an unmodified conclusion.
Same-day governance changes (context)
The same board meeting noted the resignation of Mr. Mukund Vasudevan as Managing Director (effective close of business 31 August 2026, due to a role change within SKF Group) and the elevation of Mr. Sujeeth Pai from Whole-Time Director to Managing Director from 1 September 2026. This is a leadership transition, not a dividend matter, but investors track management continuity.
Key Dates Timeline
Announcement Date
11 August 2026
Board meeting where the interim dividend was declared
Record Date
17 August 2026
Date used to identify shareholders eligible for the dividend
Ex-Dividend Date
17 August 2026
Company disclosed only the record date; under India's T+1 settlement the ex-date normally coincides with the record date
Payment Date
Not Disclosed by Company
Under the Companies Act, 2013, an interim dividend must be paid within 30 days of declaration (i.e., on or before ≈ 10 September 2026)
Dividend Yield Analysis
Yield on this ₹20 interim dividend
- At price near announcement (₹2,684.5, 14 Aug 2026*): 0.75%
- At latest CMP (₹2,888, 11 Sep 2026*): 0.69%
Trailing 12-month yield
Adding the ₹10 FY26 final dividend (paid May 2026) to this ₹20 interim gives ₹30 of cash dividend over the last year — a trailing yield of about 1.04% at CMP ₹2,888.
Yield reality check
This is a low-yield, growth-style stock, not a high-yield income play. The 0.69% yield is modest and is slightly below the machinery/industrial sector average of roughly 0.9%*. The yield is low because the share price is high relative to the dividend (the stock trades at about 37x earnings and 9.7x book value*), not because the dividend is weak. Investors are paying up for growth and quality, so the cash return is thin.
*Prices, sector averages and valuation multiples sourced from Screener / exchange data and industry aggregators. The 14 Aug 2026 price is the nearest available print to the 11 Aug 2026 board meeting, which concluded after market hours.
Dividend History Analysis
SKF India (Industrial) Limited is a newly demerged, newly listed entity. It was incorporated on 17 December 2024, received the industrial business of SKF India Limited under a scheme of arrangement (effective 1 October 2025), and its shares listed on the NSE and BSE only on 5 December 2025. As a result, there is no 10-year standalone dividend track record for this specific company.
| Financial Year | Dividend Type | Dividend / Share | Approx. Payout |
|---|---|---|---|
| FY2025-26 | Final | ₹10 | ≈ 23% |
| FY2026-27 | Interim (this announcement) | ₹20 | ≈ 45% of FY26 EPS** |
What this tells us
In its very first year of independent dividends, the company has doubled the cash payout (₹10 → ₹20). That is an aggressive early signal of intent to return cash. Because history is so short, it is too early to label the company a "consistent payer." On current evidence we classify it as an early-stage, growth-oriented payer — the pattern needs at least two to three more years to prove consistency.
**Measured against FY26 EPS of ₹44.03, since the full FY27 earnings base is not yet known. Historical figures sourced from company filings and exchange data. Note: the parent, SKF India Limited (NSE: SKFINDIA), is a separate listed company with its own dividend history and is not the same entity as SKFINDUS.
Financial Performance Analysis
The core tension: revenue up, profit down
In Q1 FY27 (quarter ended 30 June 2026), the company grew the top line strongly but the bottom line shrank. This is negative operating leverage — sales rose faster than profit fell, meaning each extra rupee of revenue came with a thinner margin.
| Metric (Q1) | Q1 FY27 | Q1 FY26 | Change |
|---|---|---|---|
| Revenue from Operations | ₹970.8 Cr | ₹820.6 Cr | +18.3% |
| Operating Profit | ₹88 Cr | ₹94 Cr | -6.4% |
| Operating Margin (OPM) | 9.1% | 11.5% | -240 bps |
| Profit Before Tax | ₹86.9 Cr | ₹97.1 Cr | -10.5% |
| Net Profit (PAT) | ₹61.9 Cr | ₹71.9 Cr | -13.8% |
| Basic EPS | ₹12.5 | ₹14.5 | -13.7% |
Why profit fell — the exact reasons
- Purchases of stock-in-trade jumped +40.5% vs revenue +18.3% — a mix shift toward lower-margin traded goods.
- Cost of materials consumed rose +32.2%, faster than sales.
- Other expenses surged +59.0%, a major drag on margins.
- Total expenses rose +21.7% against revenue growth of just +18.3%.
Full-year FY26 context
- FY26 Revenue: ≈ ₹3,440 Cr
- FY26 Net Profit: ≈ ₹218 Cr (EPS ₹44.03)
- FY26 also carried one-time demerger & labour-code costs (exceptional items ≈ ₹196 Cr), which depressed reported profit.
- Return on Equity: 26.6%* Return on Capital Employed: 29.9%*
Quarterly figures from the company's unaudited Q1 FY27 results (INR million, converted to ₹ crore). ROE/ROCE and full-year aggregates sourced from Screener/exchange data (*external).
Cash Flow Analysis
Reported profit is an opinion; cash is a fact. Here is how the cash actually behaved in FY26 (the latest full year with a cash-flow statement).
FY26 cash flow (external data)
- Cash from Operations (CFO): ≈ ₹164 Cr
- Free Cash Flow (FCF): ≈ ₹70 Cr
- CFO / Operating Profit conversion: ≈ 69%
- Net cash generated: ≈ ₹116 Cr
The key flag
This single ₹20 interim dividend costs ≈ ₹98.9 crore — which is more than the whole of FY26 free cash flow (₹70 Cr). So this payout is not being funded purely by last year's free cash generation. It is being supported by the company's large accumulated reserves and its strong cash conversion, with the expectation that FY27 cash generation will be higher.
Working-capital improvement (a genuine positive)
Cash quality is improving fast. Debtor days fell from 178 to 88 and working-capital days dropped from 142 to about 34*. Tighter working capital means more of the reported profit is turning into real cash, which supports the ability to pay dividends over time.
*Cash-flow and working-capital metrics sourced from Screener/exchange data. Funding source is inferred from the disclosed outflow versus reported cash generation, not stated by the company.
Balance Sheet Strength
Reserves & debt (FY26)
- Reserves & surplus: ≈ ₹1,427 Cr
- Equity capital: ₹49.4 Cr (49.44 crore shares of ₹10)
- Total borrowings: ≈ ₹5 Cr — effectively debt-free
- Book value per share: ≈ ₹299*
Can the balance sheet fund this dividend?
Comfortably. Reserves of ₹1,427 Cr cover this ₹98.9 Cr payout roughly 14 times over, and the company carries almost no debt. There is no sign of debt being raised to pay the dividend — the ₹5 Cr of borrowings is negligible against reserves.
*Balance-sheet aggregates and book value sourced from Screener/exchange data; equity capital and reserves per the company's disclosures.
Dividend Sustainability Analysis
Coverage scorecard
| Test | Reading | Verdict |
|---|---|---|
| Earnings cover (FY26 EPS ₹44.03 ÷ ₹20) | 2.2x | Comfortable |
| Reserves cover (₹1,427 Cr ÷ ₹98.9 Cr) | 14.4x | Very strong |
| FY26 CFO cover (₹164 Cr ÷ ₹98.9 Cr) | 1.66x | Adequate |
| FY26 FCF cover (₹70 Cr ÷ ₹98.9 Cr) | 0.71x | Below 1x — flag |
| Payout vs Q1 FY27 PAT (₹98.9 Cr ÷ ₹61.9 Cr) | 160% | Interim exceeds quarterly profit |
Our classification: Moderately Sustainable
The dividend is clearly affordable today — the balance sheet is cash-rich and debt-free, and reserves cover it many times over. But it is not yet fully covered by free cash flow, and it was declared in a quarter of falling profit and margin compression. If earnings keep sliding while the payout keeps rising, future dividends would increasingly draw on the reserve buffer rather than fresh cash. Affordability is high; the durability of a rising payout depends on a margin recovery.
Peer Comparison
| Company (Bearings) | Dividend Yield | ROE | P/E |
|---|---|---|---|
| SKF India (Industrial) — SKFINDUS | ≈ 0.69% | ≈ 26.6% | ≈ 37x |
| SKF India Ltd (parent) — SKFINDIA | ≈ 0.9-1.0% | ≈ 22% | ≈ 26-41x |
| Schaeffler India | Low | Healthy | ≈ 69x |
| Timken India | Low | Healthy | ≈ 55x |
All peer figures are approximate and sourced from Screener/exchange data and market aggregators; they move daily. Exact ROE/yield values for some peers are not restated here where a reliable current figure was unavailable.
Read-through
Indian listed bearings makers are, as a group, low-yield, high-multiple stocks — investors buy them for growth and quality, not income. SKFINDUS fits that pattern: its yield (≈0.69%) is among the lower in the pack, but its ROE (≈26.6%) and ROCE (≈29.9%) are best-in-class. The dividend is a small bonus on top of a high-return, cash-generative franchise.
Promoter Impact Analysis
Who gets the cash
- Promoter holding: 52.58%* (the SKF Group / AB SKF, Sweden)
- Promoter dividend income: ≈ ₹52.0 Cr
- Public & institutional shareholders (≈47.4%): ≈ ₹46.9 Cr
Distribution impact
Just over half of the ₹98.9 Cr payout flows to the multinational parent. This is normal for an MNC subsidiary and is not, by itself, a red flag — the pledge on promoter shares is nil, and minority shareholders receive the same ₹20 per share. Investors should simply be aware that dividend policy at MNC arms often reflects the parent's cash-repatriation preferences as much as the local company's reinvestment needs.
*Shareholding as of June 2026 quarter (Promoters 52.58%, DIIs 29.18%, FIIs 5.08%, Public 13.15%). Source: exchange shareholding pattern.
Taxation Analysis
How dividends are taxed in India (post-2020 rules)
- Dividends are taxable in the hands of the investor at their applicable income-tax slab rate. There is no separate Dividend Distribution Tax anymore.
- The company deducts TDS at 10% if the total dividend paid to a resident shareholder in a financial year exceeds ₹5,000 (20% if PAN is not provided).
- The dividend is added to "Income from Other Sources" and taxed with the rest of your income; TDS already deducted can be adjusted against your final tax.
Worked example — investor holding 1,000 shares
| Shares held | 1,000 |
| Dividend per share | ₹20 |
| Gross dividend | ₹20,000 |
| TDS @ 10% (as total > ₹5,000) | ₹2,000 |
| Amount credited to bank | ₹18,000 |
| Final tax @ 30% slab (on ₹20,000) | ₹6,000 |
| Net dividend after full tax | ₹14,000 |
| Effective post-tax yield (@ CMP ₹2,888) | ≈ 0.48% |
For a 30%-slab investor, the ₹2,000 TDS is a prepayment adjusted at filing; the total tax on this dividend is ₹6,000, leaving ₹14,000 in hand. Investors in lower slabs keep more. This is a simplified illustration and excludes surcharge and cess.
Key Risks
- Margin compression: Operating margin fell from 11.5% to 9.1% in Q1 FY27, driven by a jump in traded-goods purchases and other expenses. If margins do not recover, profit and future dividend growth are at risk.
- Falling profit despite rising sales: Negative operating leverage (revenue +18%, PAT -14%) is an early warning that growth is currently unprofitable at the margin.
- Dividend outpacing free cash flow: The ₹98.9 Cr payout exceeded FY26 free cash flow (₹70 Cr). A rising payout on a soft earnings base would steadily lean on reserves.
- Leadership transition: A new Managing Director (Sujeeth Pai) takes over from 1 September 2026; the previous MD stepped down within roughly a year of listing. Strategy continuity is unproven.
- Cyclical, capex-linked demand: Bearings demand tracks industrial capex, railways, wind and metals — all cyclical end-markets that can slow with the economy.
- High valuation: At ≈37x earnings and ≈9.7x book, the stock prices in strong growth; any earnings disappointment can hit the share price and depress the already-thin yield.
- Very short listed history: As a December-2025 listing, there is limited public track record on dividend consistency and capital allocation.
What To Monitor
- Operating margin trajectory: Watch whether OPM recovers back toward the 11-12% range in the coming quarters, or keeps sliding.
- Revenue mix: Track the share of manufactured products versus lower-margin traded goods, since the mix shift is squeezing margins.
- Full-year FY27 payout ratio: This ₹20 interim is ≈45% of last year's EPS. If a final dividend follows, the total payout ratio could rise sharply — monitor for a jump above the FY26 level of ≈23%.
- Free cash flow conversion: See whether FY27 FCF fully covers the year's total dividend, closing the gap seen in FY26.
- Order book in key verticals: Railways, wind, aerospace/defence and metals demand — the growth engines management has flagged.
- New management's capital-allocation stance: Whether the incoming MD favours reinvestment/capex or continued cash return.
Conclusion
SKF India (Industrial) Limited has made a bold early statement by doubling its cash dividend to ₹20 per share in only its first full year as an independent listed company. The payout is easily affordable — the balance sheet is cash-rich, effectively debt-free, with reserves covering the ₹98.9 crore outflow about 14 times over, and the underlying franchise earns a superb ROE of ≈26.6% and ROCE of ≈29.9%.
The caution is that this generosity came in a quarter of falling profit and margin compression: revenue rose 18% but net profit fell about 14%, and the dividend exceeded last year's free cash flow. Today's payout leans partly on the reserve cushion rather than fresh cash generation.
Net-net, this is a low-yield, high-quality growth stock whose dividend is a modest bonus rather than the main attraction. The dividend is sustainable in the near term; its growth beyond this level depends squarely on a margin recovery in FY27.
Frequently Asked Questions
What dividend has SKF India (Industrial) announced?
What is the SKF India (Industrial) dividend yield?
What is the record date for the SKF India (Industrial) dividend?
What is the ex-dividend date?
When will the dividend be paid?
Who was eligible for the dividend?
How is this dividend taxed?
Is the SKF India (Industrial) dividend sustainable?
What is SKF India (Industrial)'s dividend history?
What should investors monitor going forward?
How much of the dividend goes to the promoter?
Is SKF India (Industrial) the same as SKF India Limited?
Why did profit fall even though revenue rose?
Disclaimer
This article is for informational and educational purposes only and does not constitute investment advice, a recommendation, or an offer to buy or sell any security. ShareBazaar Online does not provide buy, sell or hold recommendations. Figures sourced from the company's stock-exchange filings are stated as disclosed; market prices, ratios, shareholding and peer data are sourced from third-party providers (including Screener and the stock exchanges) as of the dates noted and are subject to change. Ratios and coverage figures are our own calculations and may differ from other sources depending on methodology. Investors should verify all figures independently and consult a SEBI-registered financial advisor before making any investment decision. Investments in securities are subject to market risks; past performance is not indicative of future results.