
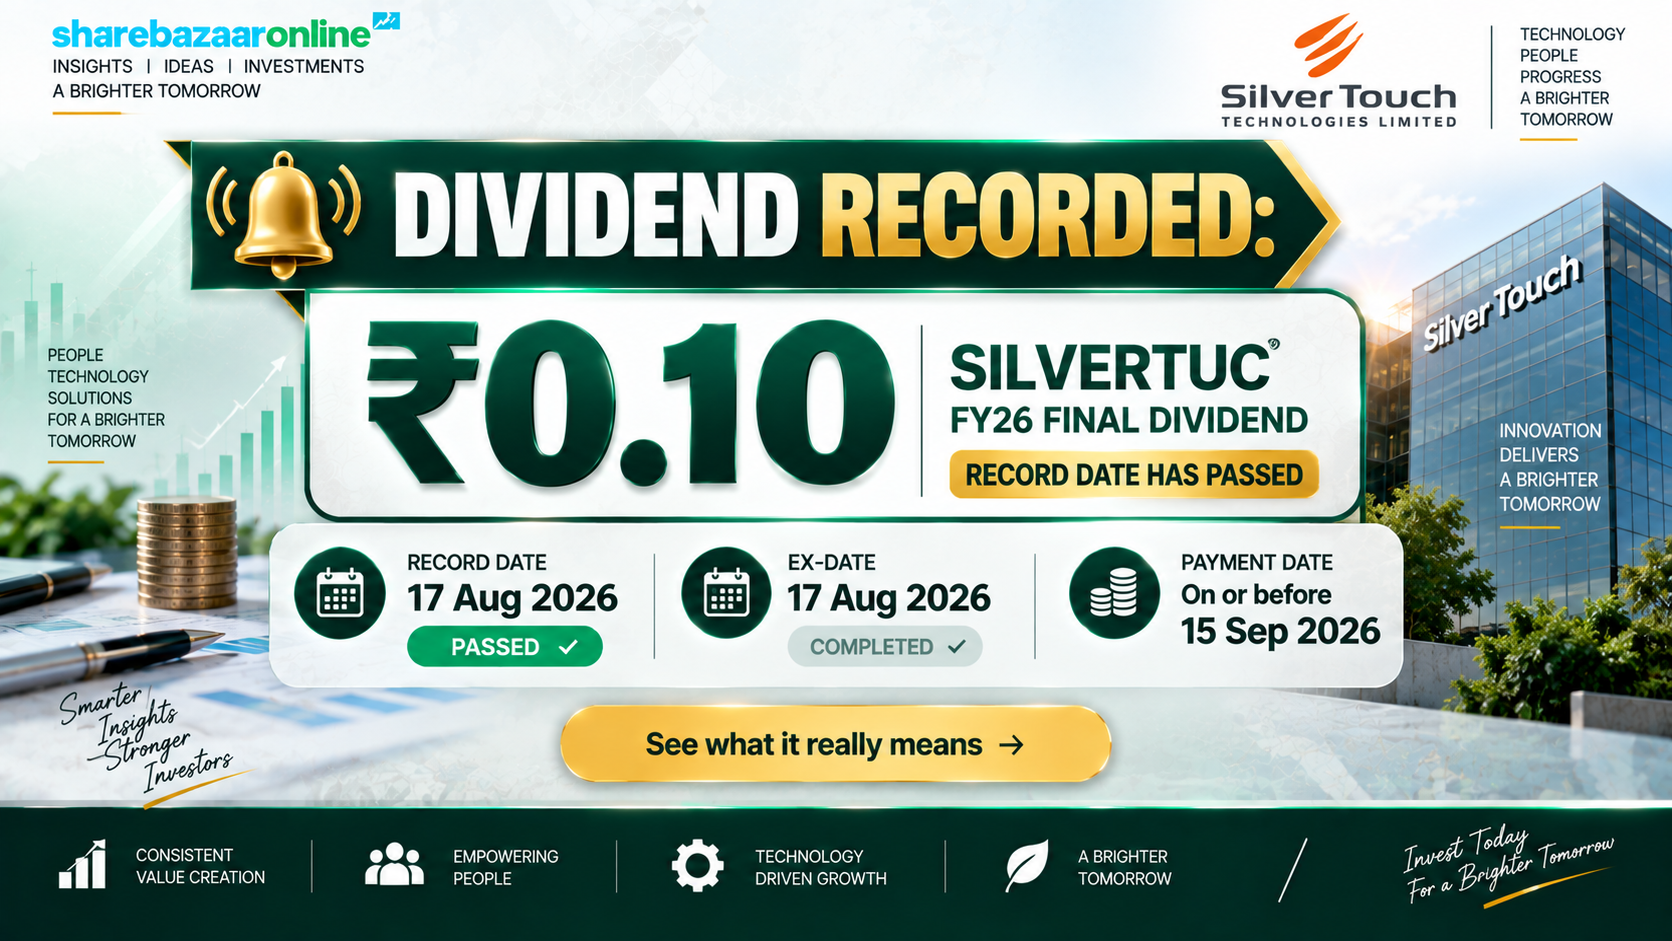
Dividend Snapshot
Silver Touch Technologies Limited (NSE: SILVERTUC, BSE: 543525) has recommended a Final Dividend of ₹0.10 per equity share for the financial year ended 31 March 2026. On a face value of ₹2, that works out to 5% — a number that looks larger than the cash it actually delivers. Against the traded price, the real dividend yield is roughly 0.07%, among the lowest in the listed IT-services universe.
Dividend Per Share
₹0.10
5% on face value of ₹2
Dividend Yield (approx.)
~0.07%
On CMP of ~₹144 (10 Sep 2026)
Estimated Total Outflow
~₹1.27 Cr
₹0.10 × 12.68 crore shares
Record Date
17 Aug 2026
Now passed — eligibility already fixed
The one line that matters: this ₹0.10 payout is not a cut from last year’s ₹0.50. After the 1:5 stock split and 1:1 bonus (record date 6 March 2026), the two figures are simply on different share bases. Restated to a common footing, the payout has actually doubled the cash a pre-bonus shareholder receives — while the yield stays negligible. We unpack this below.
Dividend Announcement Summary
At its board meeting on Thursday, 30 July 2026, the Board of Directors of Silver Touch Technologies recommended a final dividend of ₹0.10 per equity share (5%) for FY2025-26, subject to the approval of members at the ensuing 32nd Annual General Meeting. The same meeting approved the un-audited standalone and consolidated results for Q1 FY2026-27 (quarter ended 30 June 2026).
Dividend type: Final Dividend
Financial year: FY2025-26 (year ended 31 Mar 2026)
Per share: ₹0.10 (5% of ₹2 face value)
Approval status: Subject to AGM approval
CIN: L72200GJ1995PLC024465
ISIN: INE625X01026
Sector: IT Services & Consulting
Registered office: Ahmedabad, Gujarat
Silver Touch is a 30-year-old IT solutions and digital-transformation provider serving enterprise and government clients across India, the UK, US, Canada and France. It runs a consolidated group of six subsidiaries, and dividends remain a token part of its capital return — the company has consistently prioritised reinvestment over payout.
Key Dates Timeline
Because the record date of 17 August 2026 has already passed, the eligible shareholder list was fixed on that day. The company did not disclose a specific payment date; under the Companies Act, 2013, a final dividend must be paid within 30 days of its declaration at the AGM (24 August 2026), which points to a statutory outer limit around late September 2026. Investors should confirm the exact credit date against the company’s official intimation.
Dividend Yield Analysis
The headline “5% dividend” is calculated on the face value of ₹2, not on the market price. That is the single biggest source of confusion for retail investors. What actually lands in your bank account is ₹0.10 per share — and measured against the price you pay in the market, the yield is a rounding error.
Face-Value Yield (headline)
5.00%
₹0.10 ÷ ₹2 face value
Real Market Yield
~0.07%
₹0.10 ÷ ~₹144 (CMP, 10 Sep 2026)
On the announcement date (30 July 2026), the stock traded in the region of ₹185–195 (Not Independently Verified — approximate), implying an announcement-date yield of roughly 0.05%. In plain terms: a ₹1,00,000 holding earns about ₹69 a year in dividends at the current price. This is a growth-oriented technology stock, not an income instrument — the return case, if any, rests entirely on capital appreciation, not on the payout.
Dividend History Analysis
Silver Touch has been a consistent payer of a nominal dividend for many years. Before FY2025-26 it paid ₹0.50 per share on a face value of ₹10 — exactly 5% — year after year. The table below shows the raw historical figures. Crucially, these amounts are on the old ₹10 face value; they must be restated before any per-share comparison with the current ₹0.10.
| Financial Year | DPS (as paid) | Face Value | % of Face Value |
|---|---|---|---|
| FY2017-18 | ₹0.50 | ₹10 | 5% |
| FY2018-19 | ₹0.50 | ₹10 | 5% |
| FY2019-20 to FY2021-22 | ₹0.50 (multiple/yr) | ₹10 | 5%+ |
| FY2023-24 | ₹0.50 | ₹10 | 5% |
| FY2024-25 | ₹0.50 | ₹10 | 5% |
| FY2025-26 | ₹0.10 | ₹2 | 5% |
Historical dividend dates sourced from public corporate-action records (TipRanks). Figures shown as originally paid.
The corporate-action restatement (Ind AS 33 logic): in FY2025-26 the company executed a 1:5 stock split (₹10 to ₹2) and a 1:1 bonus, both with record date 6 March 2026 — a combined 10× increase in share count. Restated to today’s ₹2 base, the old ₹0.50 becomes ₹0.05 per current share. This year’s ₹0.10 is therefore double the restated figure. Put concretely: a holder of 1 pre-action share (who earned ₹0.50 last year) now holds 10 shares and collects ₹1.00 — the cash received per original holding has doubled, driven entirely by the bonus. Aggregator feeds that simply show “₹0.50 → ₹0.10” give a misleading impression of an 80% cut. There was no cut.
Classification: Consistent Payer (token dividend). The 5%-of-face-value policy has held for eight years, but it has never been a meaningful income stream — the yield has stayed in the 0.05%–0.07% band throughout.
Financial Performance Analysis
On the business itself, FY2025-26 was a strong year. On a consolidated basis, revenue from operations rose to ₹342 crore (up ~18.8% from ₹288 crore), operating profit jumped to ₹62 crore (up ~63%), and net profit reached ₹35.7 crore (up ~62%), with EPS of ₹2.82. Operating margin expanded from about 13% to 18% — textbook positive operating leverage, where profit grows much faster than revenue.
Consolidated FY26 vs FY25
Revenue: ₹342 Cr (+18.8%)
Operating Profit: ₹62 Cr (+63.2%)
Net Profit: ₹35.7 Cr (+62.4%)
EPS: ₹2.82 | OPM: 18%
Q1 FY27 (Jun 2026, consol.)
Revenue: ₹76.7 Cr (+22.3% YoY)
Net Profit: ₹9.99 Cr (+147% YoY)
EPS: ₹0.79
QoQ vs Q4 FY26: −24.4%
Two earnings-quality caveats worth flagging. First, the eye-catching “+147% Q1 profit” is amplified by a weak year-ago base — June 2025 was the softest quarter (₹4.04 crore). Sequentially, Q1 FY27 profit of ₹9.99 crore is actually down about 24% from Q4 FY26’s ₹13.2 crore, so momentum moderated quarter-on-quarter. Second, there is a standalone-vs-consolidated divergence: standalone FY26 net profit (₹37.8 crore) is higher than consolidated (₹35.7 crore), implying the overseas and newer subsidiaries were a net drag of roughly ₹2 crore. Both are normal for a company investing in new verticals (including AI4Pharma), but they temper the headline growth story.
Data discrepancy flagged: the consolidated FY26 filing shows “profit attributable to shareholders” of ₹22.2 crore against a period net profit of ₹35.7 crore with nil non-controlling interest — a line that does not reconcile with the reported EPS of ₹2.82. The internally consistent figure (used throughout this analysis) is ₹35.7 crore, which matches the stated EPS. This anomaly should be verified against the audited annual report.
Cash Flow Analysis
Reported profit is an opinion; cash is a fact. Here the news is genuinely good and marks a clear improvement over the prior year. In FY2025-26 the company generated ₹17 crore of operating cash flow and, after capex, roughly ₹13 crore of free cash flow — both positive.
FY2025-26 (consolidated)
Operating Cash Flow: +₹17 Cr
Free Cash Flow: +₹13 Cr
FY2024-25 (consolidated)
Operating Cash Flow: −₹3 Cr
Free Cash Flow: −₹22 Cr
The FY25 cash picture was poor: negative operating cash flow and a large negative FCF, largely due to elevated capex and working-capital absorption (debtor days have hovered around 110–122). The FY26 swing to positive cash generation is the more important signal. Against a dividend outflow of just ₹1.27 crore, FY26 free cash flow covers the payout about 10 times over and operating cash flow more than 13 times over. The dividend is being funded comfortably out of current cash generation — not from reserves, asset sales or borrowings. One watch-item: cash conversion has been lumpy year to year, so investors should confirm the trend holds rather than treating a single strong year as the new normal.
Balance Sheet Strength
Net worth: ~₹169 Cr
Reserves: ~₹144 Cr
Borrowings: ~₹33 Cr (down from ~₹43 Cr)
Book value: ~₹13.4/share
ROE: 24.4%
ROCE: 29.8%
Dividend outflow vs reserves: ~0.88%
Total assets: ~₹296 Cr
The balance sheet is healthy and improving. The company reduced debt over the year, and returns on capital are strong for the sector — ROCE of ~30% and ROE of ~24%. The dividend outflow of ₹1.27 crore is under 1% of reserves, so there is no question of affordability. The 1:1 bonus was funded from free reserves (which stood at ~₹118 crore as of March 2025), consuming about ₹12.7 crore of reserves — a capitalisation of profits, not a cash event.
Dividend Sustainability Analysis
On every affordability test, this dividend is trivially safe — precisely because it is so small. The question is not whether the company can pay it, but whether it will ever grow into something an income investor would notice. On current policy, it will not.
Verdict: Sustainable. The payout ratio is only about 3.5% of profit, so the dividend is fully covered by earnings, cash flow and reserves several times over. The trade-off is the flip side of the same coin: a company retaining ~96% of profit is signalling that it sees better uses for the cash inside the business than returning it to shareholders. For a stock trading at a high multiple, that is a reasonable choice — but it means the dividend should be treated as a formality, not a reason to own the stock.
Peer Comparison
Dividend yield in IT is a story of two camps. Large-cap IT majors are cash machines that return most of their profit and yield 1.5%–3%. Small-cap, high-growth IT firms like Silver Touch typically pay a token dividend and reinvest — their appeal is growth and return on capital, not income.
| Cohort | Typical Dividend Yield | Typical Payout |
|---|---|---|
| Silver Touch (SILVERTUC) | ~0.07% | ~3.5% |
| Large-cap IT majors | ~1.5%–3.0% | ~40%–90% |
| Technology sector average | ~0.5% | Varies widely |
Cohort ranges are indicative industry benchmarks, not exact matched-peer figures. Sector-average yield reference: TipRanks (Technology). Confirm live figures before relying on them.
Where Silver Touch stands out is capital efficiency, not income: its ROCE (~30%) and ROE (~24%) sit at the higher end of the small-cap IT pack, and its 5-year profit growth has been exceptional (though flattered by a depressed FY21 base). An investor choosing this stock is choosing that growth-and-returns profile; the dividend adds effectively nothing to the total-return calculation.
Promoter Impact Analysis
Promoter Holding (Jun 2026)
74.66%
FII 0.48% | DII 0.00% | Public 24.85%
Estimated Promoter Dividend Income
~₹0.95 Cr
Public shareholders share ~₹0.32 Cr
With promoters holding ~74.7%, roughly three-quarters of the ₹1.27 crore payout — about ₹0.95 crore — flows to the promoter group, while public shareholders collectively receive around ₹0.32 crore. Given the tiny absolute amounts, the dividend is not a meaningful promoter cash-extraction lever. More telling is the direction of promoter behaviour: the promoter group has been buying shares from the open market in recent weeks (raising one promoter’s stake past 20%), which is generally read as a confidence signal rather than a cash-out.
Taxation Analysis
Since April 2020, dividends are taxed in the hands of the investor at their applicable income-tax slab rate — there is no separate dividend distribution tax and no exemption. The company deducts TDS under Section 194 at 10% only if total dividend paid to a resident shareholder exceeds ₹10,000 in a financial year (threshold raised from ₹5,000, effective FY2025-26). For a dividend this small, most retail holders will fall below the TDS threshold.
Worked example — 1,000 shares
A 30%-slab investor keeps about ₹70 of every ₹100 in dividends. Even before tax, the payout is immaterial; after tax it is smaller still. Investors in lower slabs keep proportionally more, but the absolute numbers remain negligible. This is general information, not tax advice — consult a qualified professional for your own situation.
Key Risks
- Rich valuation: the stock trades at a P/E of roughly 44 and around 11 times book value. At that multiple, the dividend is irrelevant to returns and any earnings disappointment can hurt the price sharply — the ~10% single-day fall on 10 Sep 2026 is a reminder of the volatility.
- Sequential moderation: Q1 FY27 profit fell ~24% versus the prior quarter. If the June-quarter softness extends, the “high-growth” narrative supporting the multiple weakens.
- Subsidiary drag: consolidated profit trails standalone, and newer subsidiaries (including AI4Pharma and overseas arms) can absorb cash before they contribute.
- Working-capital intensity: debtor days of ~110–122 and lumpy operating cash flow (negative as recently as FY25) mean cash generation is not yet steady.
- Client / order concentration and execution: a mid-sized IT firm with significant government and enterprise exposure is sensitive to project timing, budget cycles and a few large accounts.
- Negligible income cushion: a ~0.07% yield offers no downside protection, unlike higher-yielding value stocks.
What To Monitor
- Operating margin trajectory: can the company hold the expanded ~18–22% margins, or was FY26 a peak? Sustained margins justify the multiple; slippage does not.
- Cash conversion: whether operating and free cash flow stay positive after the strong FY26, or revert to the FY25 pattern of absorption.
- Subsidiary profitability: the narrowing (or widening) of the standalone-to-consolidated profit gap as new ventures scale.
- Order book and large deal wins: government and enterprise mandates that underpin the growth story.
- Debtor days and working capital: whether receivables discipline improves alongside revenue growth.
- Capital-allocation signals: any shift toward a higher payout, a buyback, or continued reinvestment — and continued promoter buying/selling activity.
Conclusion
Silver Touch Technologies’ ₹0.10 final dividend is best understood as a symbolic continuation of an eight-year, 5%-of-face-value policy — not as an income event and not, despite appearances, as a cut. After the 1:5 split and 1:1 bonus, the payout is on a new share base; restated, it is actually double the historical figure in cash terms for a pre-bonus holder, yet the yield remains a negligible ~0.07%.
Positives
- Strong FY26 growth: revenue +19%, profit +62%
- Positive FCF (~₹13 Cr) after a weak FY25
- High ROCE (~30%) and ROE (~24%); reduced debt
- Dividend covered ~28x by earnings — fully sustainable
- Promoters buying from the open market
Negatives / Watch-outs
- Negligible ~0.07% yield; ~3.5% payout
- Rich valuation (P/E ~44, ~11x book)
- Q1 FY27 profit down ~24% QoQ
- Subsidiary drag; lumpy historical cash flow
- Filing anomaly on attributable profit to verify
In short: a fundamentally healthy, high-growth small-cap IT company whose dividend is a rounding error. Own it, if you do, for the business and the capital efficiency — never for the payout. The positives, negatives and risks are laid out above so you can weigh them yourself.
Frequently Asked Questions
What dividend has Silver Touch Technologies announced?
What is the Silver Touch dividend yield?
What was the record date?
What was the ex-dividend date?
When will the dividend be paid?
Who was eligible for the dividend?
How is this dividend taxed?
Is the dividend sustainable?
Did Silver Touch cut its dividend from ₹0.50 to ₹0.10?
What is Silver Touch’s dividend history?
Should investors buy Silver Touch for its dividend?
What should investors monitor going forward?
Disclaimer
This article is for informational and educational purposes only and does not constitute investment, financial, legal or tax advice, nor a recommendation to buy, sell or hold any security. ShareBazaar Online is not a SEBI-registered investment adviser. Figures are drawn from the company’s exchange filing dated 30 July 2026 and from public financial sources including Screener.in, exchange records and third-party data providers; some market figures (current price, announcement-date price, peer benchmarks) are time-sensitive and were Not Independently Verified at the moment of reading and should be re-checked against live NSE/BSE data. All dividend figures remain subject to shareholder approval and official company confirmation. Please consult a qualified financial adviser before making any investment decision. Investments in securities are subject to market risks; read all related documents carefully.