
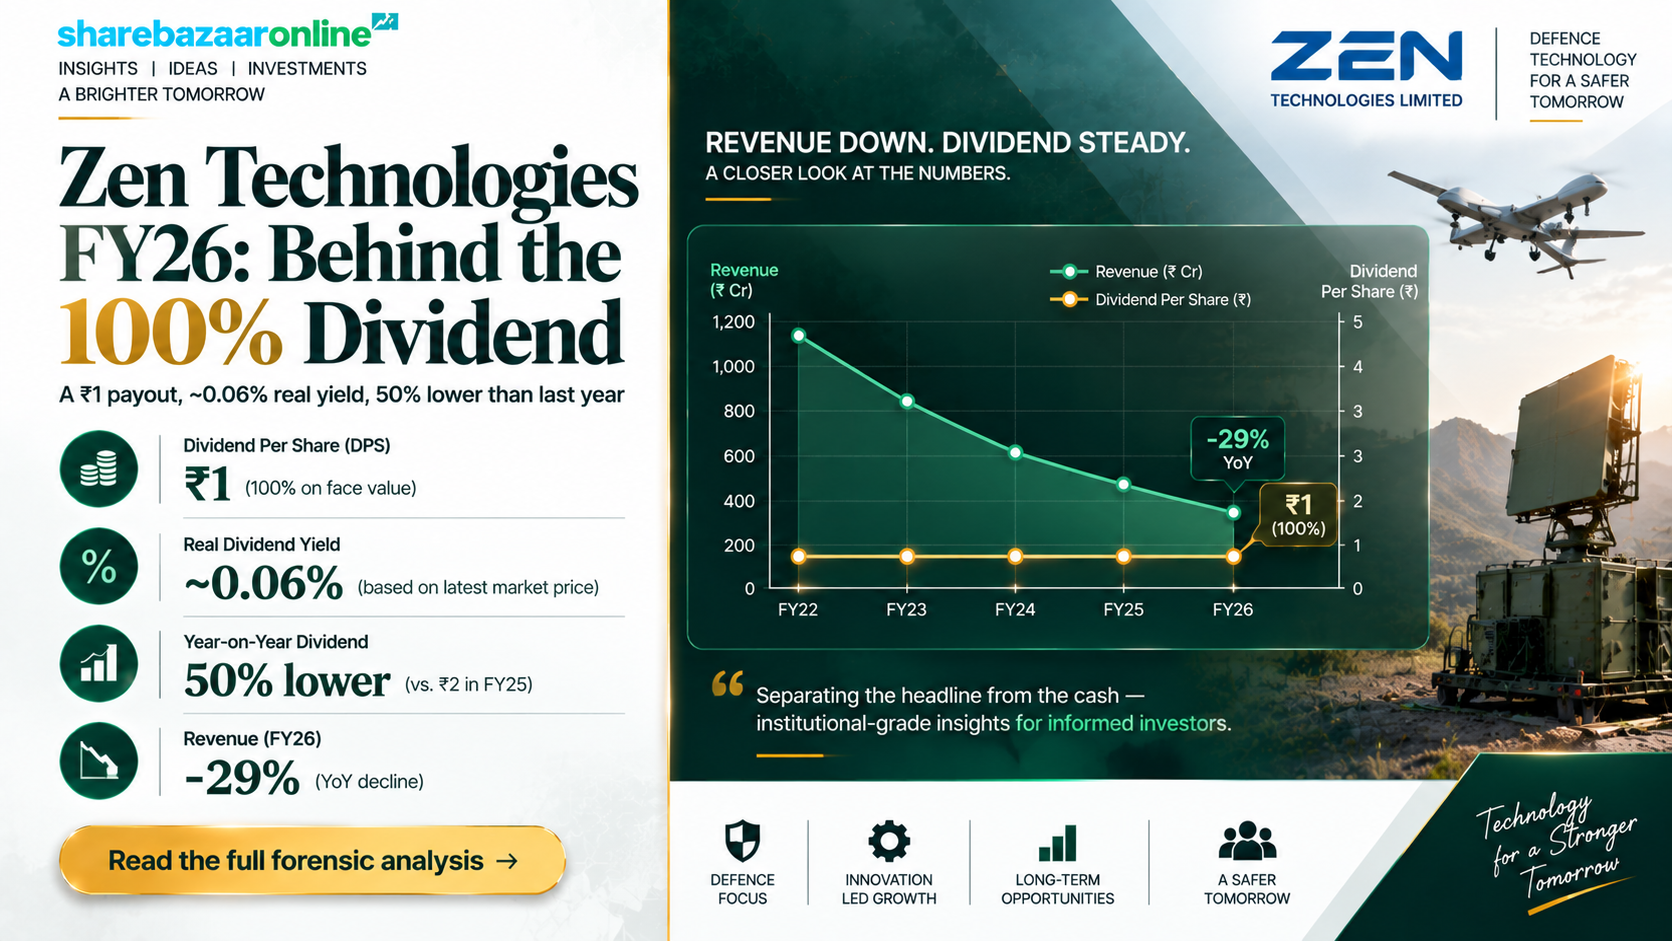
Zen Technologies Dividend 2026: Snapshot
Zen Technologies Limited (NSE: ZENTEC | BSE: 533339 | ISIN: INE251B01027) has declared a final dividend of ₹1 per equity share for FY2025-26, described in the filing as a 100% dividend on the Re. 1 face value. The payout was approved by the Board on 1 May 2026 and ratified by shareholders at the 33rd Annual General Meeting on 29 August 2026. At the current market price of about ₹1,725 (NSE/BSE, 11 September 2026), the real dividend yield works out to roughly 0.06% — a world away from the "100%" headline. This ShareBazaar Online analysis looks past the label to the earnings quality, cash coverage and sustainability behind the Zen Technologies dividend.
Dividend At A Glance
- Dividend type: Final Dividend (FY2025-26)
- Dividend per share: ₹1.00
- Dividend rate: 100% of Re. 1 face value
- Record date: 21 August 2026 (concluded)
- Ex-date: 21 August 2026 (concluded)
- AGM approval: 29 August 2026 — approved
The Numbers That Matter
- Real (price) yield: ~0.06%
- Estimated outflow: ~₹9.0 crore
- Payout ratio: ~4.7% of FY26 profit
- Earnings cover: ~21.5x (EPS ₹21.52)
- Cash + bank cover: ~39x
- YoY change: cut from ₹2 (FY25) to ₹1
Why this matters: The "100%" figure is calculated on face value, not on the market price. On the price investors actually pay, Zen Technologies is one of the lowest-yielding names in the listed defence pack. The dividend is comfortably affordable — but it has been halved in the same year that revenue and profit fell sharply. Both facts deserve context, which the sections below provide.
Dividend Announcement Summary
At its meeting on Friday, 1 May 2026, the Board of Directors of Zen Technologies Limited recommended a final dividend of ₹1 (Rupee One only) per equity share of Re. 1 each for the financial year ended 31 March 2026. Being a final dividend, it was conditional on shareholder approval, which was granted at the 33rd AGM held on 29 August 2026 (e-voting results declared 1 September 2026, per exchange filings).
What The Board Approved
Alongside the dividend, the Board approved the audited standalone and consolidated results for FY26 (unmodified audit opinion), convened the AGM, fixed the book closure from 22–29 August 2026, and appointed Dr. Sreenivas Rao Yellamanchali (former DRDO Director General, Naval Systems & Materials) as Chief Technology Officer with effect from 6 May 2026. The company also appointed new internal and cost auditors for FY27.
Management Context
Management has publicly acknowledged that "FY26 financial performance was muted relative to FY25, a trajectory we have communicated earlier" (management commentary reported in the business press on Q4FY26 results). The company frames FY26 as a year of structural transformation, with a consolidated order backlog of ₹1,336.04 crore as at 31 March 2026 and a Q4 order inflow of about ₹431 crore.
Corporate identity: Zen Technologies is India's largest supplier of combat-training simulators and anti-drone (counter-UAS) systems, headquartered in Hyderabad, operating as a single reportable segment — "Defence and Homeland."
Key Dates Timeline
The Zen Technologies dividend calendar for FY26 is now complete — the record date, ex-date and AGM have all passed. The table restates the official dates from the exchange filing and corporate-action disclosures.
| Event | Date | Status / Note |
|---|---|---|
| Board recommendation | 1 May 2026 | Announced with FY26 results |
| Ex-date | 21 August 2026 | Concluded (exchange data) |
| Record date | 21 August 2026 | Concluded (per filing) |
| Book closure | 22–29 August 2026 | Both days inclusive |
| AGM (approval) | 29 August 2026 | Dividend approved |
| Payment date | Not separately disclosed | Within statutory timeline (~30 days of AGM) |
Under current T+1 settlement, the ex-date and record date coincide. Shareholders whose names appeared in the register of members on 21 August 2026 were eligible for the ₹1 dividend. The company stated the dividend "if declared will be paid… within the timelines prescribed under the law," i.e. within 30 days of AGM approval; an exact payment date was not company-specified in the filing.
Dividend Yield Analysis: The 100% Illusion
This is where retail investors are most often misled. A "100% dividend" sounds enormous. But that 100% is measured against the face value of Re. 1, not against what you pay in the market. Once you divide the ₹1 payout by the actual share price, the yield collapses.
Face Value vs Market Reality
- Headline "yield" (on face value): 100%
- Real yield at CMP ₹1,725: ~0.06%
- Yield at announcement (~₹1,670): ~0.06%
- Yield on post-results price (~₹1,481): ~0.07%
A ₹1 dividend on a ₹1,725 share returns about 6 paise for every ₹100 invested.
Why The Real Yield Is So Low
Zen Technologies trades at a rich valuation — roughly 86x earnings and 8x book value (Screener.in, September 2026). Investors are paying for future defence-order growth, not for income. A high-multiple growth stock that pays a token dividend will always show a near-zero yield, however large the "percentage" looks on face value.
Bottom line: Zen Technologies is not a dividend stock and does not present itself as one. The ₹1 payout is a shareholder gesture on top of a growth story — not a source of income. Any investor buying ZENTEC "for the dividend" is misreading the situation.
Dividend History Analysis
The single most important fact in Zen's recent dividend record: the FY26 payout of ₹1 is a 50% cut from the ₹2 declared for FY25. Amounts below are on the current Re. 1 face value; the company has undertaken corporate actions historically (stock split/bonus), so older per-share figures should be read as restated. Metrics sourced from Screener.in, exchange filings and dividend-history aggregators.
| Financial Year | Dividend / Share | Dividend Payout % |
|---|---|---|
| FY2025-26 | ₹1.00 (final) | ~5% |
| FY2024-25 | ₹2.00 (final) | ~6% |
| FY2023-24 | ₹1.00 | ~7% |
| FY2022-23 | Minimal | ~4% |
| FY2021-22 | Higher payout (restated) | ~40% |
Pattern Read
Zen has paid a dividend in most recent years but with a token, low-payout approach (typically 4–7% of profit) and no fixed per-share commitment. The amount moves up and down with the year's profit — it rose to ₹2 after a strong FY25, then fell back to ₹1 as FY26 profit dropped.
Classification
On this record, Zen Technologies is best described as an irregular / discretionary payer rather than a consistent or progressive dividend payer. The dividend tracks earnings rather than following a policy of steady growth — so a cut in a weak year is normal for this company, not a red flag by itself.
Financial Performance Analysis (Consolidated FY26)
FY26 was a year of decline. Both the top line and the bottom line fell sharply, and margins compressed. Figures from the company's audited consolidated results.
| Metric (Consolidated) | FY2025-26 | FY2024-25 | YoY |
|---|---|---|---|
| Revenue from operations | ₹687.69 Cr | ₹973.64 Cr | −29.4% |
| Operating EBITDA | ~₹247 Cr | ~₹374 Cr | −33.8% |
| EBITDA margin | ~36% | ~38% | −2.4 pp |
| Other income | ₹85.4 Cr | ₹58.4 Cr | +46.3% |
| PAT (owners) | ₹193.45 Cr | ₹280.24 Cr | −31.0% |
| EPS (basic) | ₹21.52 | ₹32.07 | −32.9% |
Operating Leverage Worked In Reverse
Revenue fell 29% but EBITDA fell faster, at 34%. Because a defence-manufacturing business carries fixed costs (people, plant, R&D), a drop in sales bites harder at profit — the margin slipped from ~38% to ~36%. This is negative operating leverage: when volumes shrink, profitability shrinks more.
Earnings Quality Flag
Reported profit was cushioned by other income of ₹85.4 crore, which grew 46% and now equals about 29% of pre-tax profit. This is largely treasury/interest income on a large cash pile — real, but non-operating. Stripping it out, the underlying defence business declined more than the headline PAT suggests. On a standalone basis revenue fell an even steeper ~54%, with subsidiaries carrying more of the FY26 load.
Cash Flow Analysis
Reported profit is an opinion; cash is a fact. Here the news is genuinely good, and it contrasts sharply with the weak P&L. Despite a 31% fall in profit, cash generation improved dramatically in FY26.
Operating Cash Flow
- OCF FY26: ₹244.6 Cr (vs ₹31 Cr in FY25)
- OCF-to-operating-profit: ~136%
- Driver: a large release of working capital — trade receivables fell sharply as prior-year order execution was collected.
FY25's OCF was weak precisely because a fast-growing order book had tied up cash in receivables; FY26 unwound that.
Free Cash Flow
- Capex (PPE + CWIP): ~₹58.8 Cr
- Free cash flow: ~₹185.8 Cr (strongly positive)
- Dividend funded by: current cash generation, not reserves or borrowings
How is the ₹1 dividend funded? The ~₹9 crore payout is a rounding error against ₹185.8 crore of free cash flow — the dividend is funded entirely out of current-year cash generation. No reserve drawdown, no asset sale, no borrowing is required. Watch-point: FY26's exceptional OCF was partly a one-off working-capital release; sustained cash flow depends on the order book converting to sales again.
Balance Sheet Strength
This is Zen's strongest card. The company is effectively net-cash, with almost no borrowings and a large liquidity buffer.
Liquidity & Debt (31 Mar 2026)
- Cash & cash equivalents: ₹78.9 Cr
- Other bank balances: ₹275.8 Cr
- Liquid cash + bank: ~₹354.7 Cr
- Gross borrowings: only ~₹3.4 Cr
- Net cash position: ~₹351 Cr
Returns & Order Book
- ROE (FY26): ~10.7%
- ROCE (FY26): ~16.2%
- Total equity: ~₹1,949 Cr
- Consolidated order book: ₹1,336.04 Cr
ROE/ROCE fell in FY26 as profit dropped while the large FY25 equity base (post capital raise) stayed high.
Caveat on returns: ROE of ~10.7% is modest for a company on 86x earnings. A big equity base and a large idle cash pile drag returns down. Working-capital days also remain elevated (inventory and debtor cycles are long in project-based defence supply), which is worth monitoring even though the balance sheet is unquestionably safe.
Dividend Sustainability Analysis
We run the payout through four independent coverage tests. On every measure, the dividend is trivially affordable.
| Coverage Test | Ratio | Verdict |
|---|---|---|
| Earnings cover (EPS ÷ DPS) | ~21.5x | Very strong |
| Operating cash flow cover | ~27.1x | Very strong |
| Free cash flow cover | ~20.6x | Very strong |
| Cash + bank cover | ~39.3x | Very strong |
Verdict: Sustainable
The ₹1 dividend is fully Sustainable in affordability terms. With a ~5% payout, net-cash balance sheet and 20x+ free-cash-flow cover, Zen could pay this dividend many times over. Affordability is simply not the question here.
The Real Question: Direction
Sustainability of the amount is a different matter. Because Zen sizes the dividend to each year's profit, the per-share figure will move with earnings. If FY27 profit recovers with the order book, the dividend could rise again; if execution stays soft, it could stay at ₹1 or lower. Do not assume a fixed or growing payout.
Peer Comparison
Against listed defence peers, Zen sits at the low end for both dividend yield and return on equity — consistent with its status as a high-growth, high-multiple name. Peer metrics are approximate, from Screener.in and market data (September 2026); treat as indicative, not exact.
| Company | Div. Yield | ROE | Profile |
|---|---|---|---|
| Zen Technologies | ~0.06% | ~10.7% | Simulators, anti-drone |
| Bharat Electronics (BEL) | ~0.8% | ~22% | Defence electronics PSU |
| Hindustan Aeronautics (HAL) | ~1–2% | ~22% | Aircraft PSU |
| Astra Microwave | ~0.15% | ~15% | RF/microwave subsystems |
| Data Patterns | Low / token | High | Defence electronics |
Read-across: PSU names such as BEL and HAL pay meaningfully higher yields (government-owner dividend policy plus lower valuations). Private, high-growth peers like Zen, Astra Microwave and Data Patterns all pay token dividends and reinvest. Within that private cluster, Zen's yield is the lowest and its FY26 ROE is currently at the bottom of the group after the profit decline.
Promoter Impact Analysis
Shareholding (latest)
- Promoters: 48.51%
- FIIs: ~6.47% (Jun 2026)
- DIIs: ~10.42% (Jun 2026)
- Public & others: ~34.6%
Promoter holding has fallen from ~57% (2023) to ~48.5% over three years, while DII holding has risen sharply.
Who Gets The Dividend
- Total outflow: ~₹9.0 Cr
- Promoter share (48.51%): ~₹4.38 Cr
- Public/minority (~34%): ~₹3.1 Cr
- Institutions (FII+DII ~17%): ~₹1.5 Cr
Fairness read: With a flat ₹1 per share, every shareholder is treated identically — there is no special or differential dividend that would favour promoters. Given the tiny absolute sums involved (₹4.4 crore to promoters on a ₹15,700+ crore company), the dividend is symbolic rather than a meaningful cash-extraction channel for insiders.
Taxation Analysis
Since the abolition of the Dividend Distribution Tax (FY21), dividends in India are taxed in the hands of the investor at their applicable income-tax slab rate. The company also deducts TDS at 10% under Section 194 if a resident shareholder's total dividend from that company exceeds ₹10,000 in a financial year (higher/for non-PAN and non-resident cases). TDS is a credit adjustable against final tax.
Worked Example (Illustrative)
An investor holds 1,000 shares of Zen Technologies at a dividend of ₹1 per share, in the 30% tax slab:
- Gross dividend: 1,000 × ₹1 = ₹1,000
- TDS (Sec 194): Nil — below the ₹10,000 threshold, so no TDS is deducted
- Tax at 30% slab (+cess): ~₹312
- Net, after-tax dividend: ~₹688
- Effective post-tax yield at ₹1,725: ~0.04%
Even before tax the income is negligible; after tax at the top slab it is fractional. Cess/surcharge vary by individual; consult a tax adviser.
Key Risks
- Order-inflow lumpiness: FY26 revenue fell ~29% chiefly because order intake slowed. Defence orders are large and irregular; a few quarters of weak inflow can swing revenue and profit dramatically, as FY26 showed.
- Rich valuation vs falling earnings: The stock trades near 86x earnings while EPS fell ~33% in FY26. Any further growth disappointment leaves little valuation cushion.
- Other-income dependence: Nearly 29% of pre-tax profit came from non-operating other income; if interest rates or the cash balance fall, this cushion shrinks.
- Working-capital and execution cycle: Long inventory and receivable cycles tie up cash; the strong FY26 cash flow was partly a one-off working-capital release, not a new run-rate.
- Concentration and policy dependence: Zen operates in a single "Defence and Homeland" segment, heavily reliant on government/defence procurement timelines and budget priorities.
- Subsidiary/integration risk: A larger consolidated structure (including Vector Technics, Unistring) adds execution and integration risk — e.g. the April 2026 fire at Unistring inventory (~₹2.14 Cr, insured, non-adjusting event).
What To Monitor
- Quarterly order inflow & backlog: Track new orders against the ₹1,336 crore backlog — the single best leading indicator of a revenue recovery in FY27.
- Revenue and EBITDA-margin recovery: Watch whether the top line re-accelerates and whether the ~36% EBITDA margin holds or rebuilds toward ~38%.
- Quality of profit: Monitor the share of other income in pre-tax profit; a healthier mix means operating earnings are carrying more of the weight.
- Working-capital days: Inventory/debtor cycles and whether operating cash flow stays strong once the one-off receivable release is behind.
- Next dividend decision (FY27): Whether the Board restores a higher per-share dividend if profit recovers — the payout policy remains earnings-linked and discretionary.
- Promoter holding trend: Continued dilution/decline in promoter stake is worth tracking for governance and signalling.
Conclusion
Zen Technologies' FY26 "100% dividend" is a headline that means far less than it sounds. On the price investors pay, the yield is about 0.06%, and the ₹1 payout is a 50% cut from FY25's ₹2 — declared in a year when consolidated revenue fell ~29% and EPS fell ~33%.
Positives
- Dividend fully covered — 20x+ FCF cover, ~39x cash cover
- Near net-cash balance sheet (~₹351 Cr net cash)
- Operating cash flow jumped to ₹244.6 Cr
- Healthy ₹1,336 Cr order backlog
Negatives / Watch-outs
- Revenue −29%, EPS −33%, margin compression
- Dividend halved; earnings-linked, not progressive
- ~29% of PBT from non-operating other income
- Rich ~86x valuation vs modest ~10.7% ROE
The dividend is safe but symbolic. The real investment debate around Zen Technologies is about order-book execution and valuation, not income. We present the positives, negatives, risks and monitoring factors — the decision is yours.
Frequently Asked Questions
What dividend has Zen Technologies announced for 2026?
What is the Zen Technologies dividend yield?
What was the record date for the Zen Technologies dividend?
What is the ex-date for ZENTEC's dividend?
When will the Zen Technologies dividend be paid?
Who was eligible for the dividend?
How is the Zen Technologies dividend taxed?
Is the Zen Technologies dividend sustainable?
What is Zen Technologies' dividend history?
Why did Zen Technologies cut its dividend to ₹1?
What should investors monitor going forward?
Is Zen Technologies a good dividend stock?
Disclaimer
This article is published by ShareBazaar Online for informational and educational purposes only. It is not investment advice and does not constitute a buy, sell or hold recommendation. ShareBazaar Online is not a SEBI-registered investment adviser. All figures are drawn from Zen Technologies' exchange filings and publicly available sources (including Screener.in, NSE/BSE data and dividend-history aggregators) and may contain errors or become outdated; market prices, yields and dates are price-dependent and change continuously. Dividend approval, record date and payment details should be verified against official NSE/BSE corporate-action circulars. Securities markets carry risk, including loss of capital. Readers should conduct their own due diligence and consult a SEBI-registered financial adviser and a qualified tax professional before making any investment or tax decision. ShareBazaar Online and its authors accept no liability for actions taken based on this content.