
Dividend Snapshot
Dividend Per Share
₹10.00
Final dividend, FY2025–26
Dividend Rate (on Face Value ₹2)
500%
Headline figure calculated on ₹2 face value
Real Dividend Yield (on market price)
~1.78%
₹10 ÷ ~₹562 CMP • live re-verify
Dividend Payout Ratio
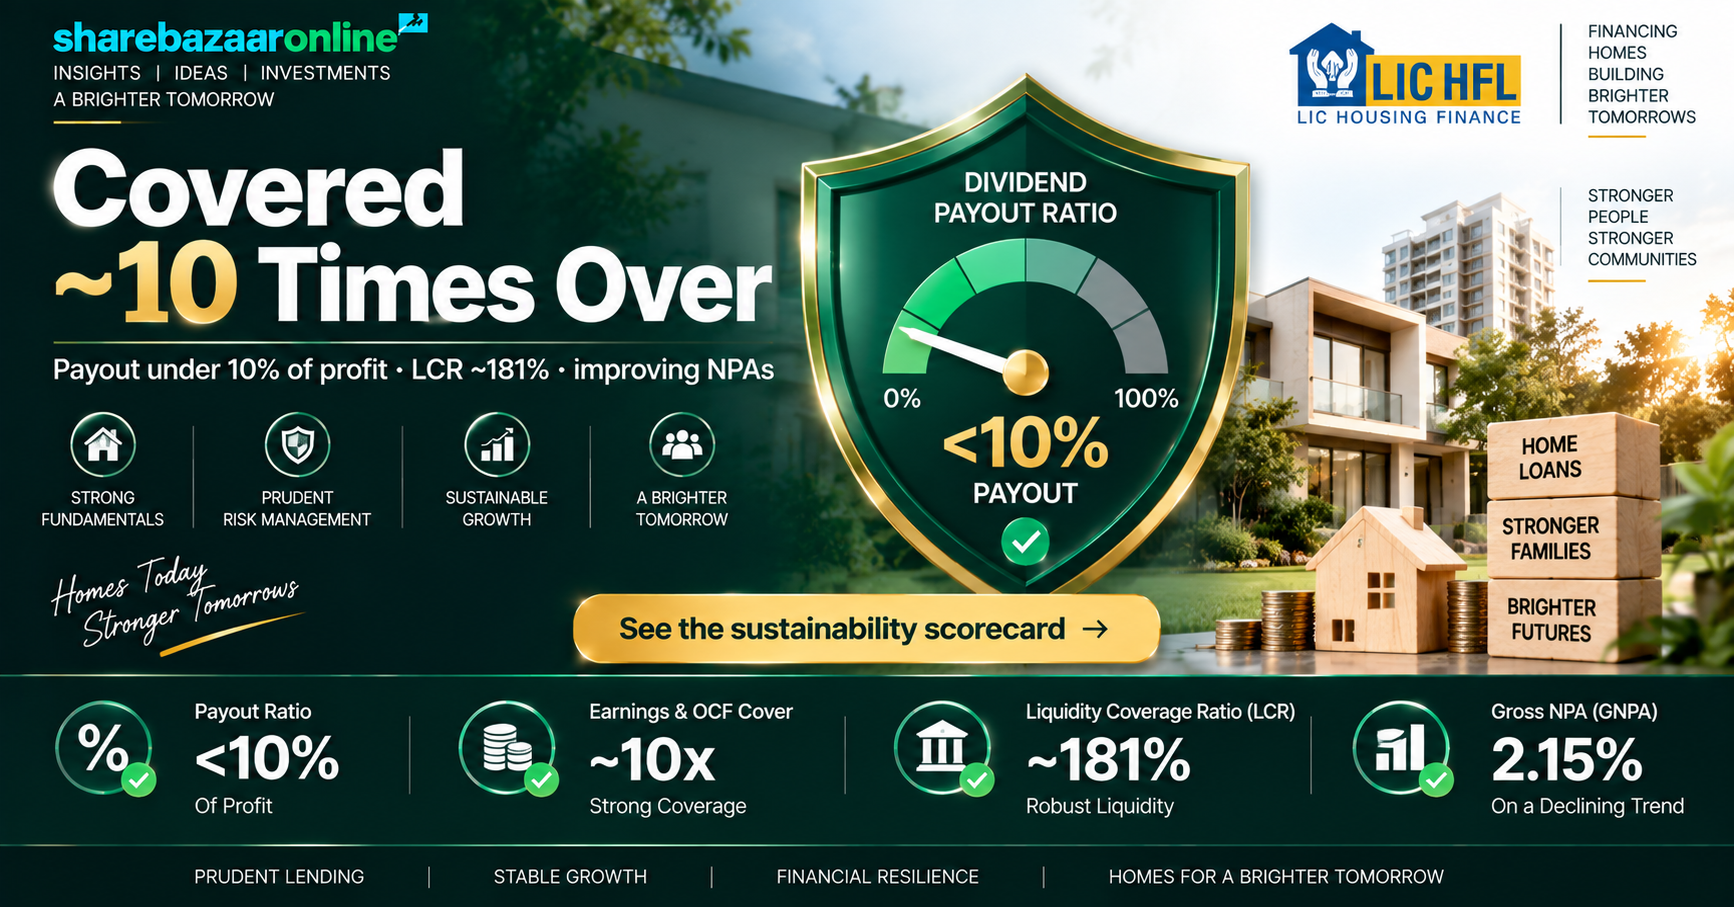
~9.8%
Of consolidated net profit
The one-line takeaway: The “500%” is a face-value artefact. On the market price a shareholder actually earns roughly 1.78% in cash yield. But the flip side matters just as much — the company paid out only about 9.8% of its ₹5,604 crore consolidated profit, so the dividend is comfortably covered ~10 times over by earnings. This is a low-yield, very-well-covered payout, not a high-yield one.
Dividend Announcement Summary
At its board meeting on 13 May 2026 (which ran from 2:30 PM to 7:45 PM), the Board of LIC Housing Finance recommended a final dividend of ₹10 per equity share of face value ₹2 — i.e. 500% of face value — for the financial year 2025–26. This matches the previous year’s dividend, which was also ₹10 per share (500%). The dividend is subject to shareholder approval at the ensuing Annual General Meeting, and the filing states it will be paid within 30 days of that approval.
Company & Instrument
- Company: LIC Housing Finance Limited
- NSE Symbol: LICHSGFIN • BSE Code: 500253
- ISIN: INE115A01026
- Dividend Type: Final Dividend
- Face Value: ₹2 per share
The Payout In Numbers
- Dividend: ₹10.00 / share (500%)
- Shares outstanding: ~55.04 crore (equity capital ₹110.08 cr ÷ ₹2)
- Estimated total outflow: ~₹550 crore
- Consolidated EPS: ₹101.87
- AGM approval: Required (final dividend)
Alongside the results, the Board appointed Shri Sandeep Kumar as Chief Operating Officer. The results were audited with an unmodified opinion by joint statutory auditors Shah Gupta & Co. and Batliboi & Purohit. Share-count is triangulated three ways — equity capital ÷ face value (55.04 cr), PAT ÷ EPS (55.01 cr) and the cash-flow “dividend paid” line of ₹550.06 cr for the prior-year ₹10 payout — all of which agree.
Key Dates Timeline
*Record and ex-dates of 21 August 2026 are drawn from third-party corporate-action trackers (Choice, INDmoney) and were not specified in the board-meeting filing itself. They must be confirmed against the official NSE/BSE corporate-action circular before publication. As a reference point, the FY2024–25 ₹10 dividend had an ex-date of 22 Aug 2025 and was paid on 18 Sep 2025 — so a mid-September 2026 payment is the historical pattern, not a company-disclosed date. Under T+1 settlement, eligibility for a dividend is fixed on the record date.
Dividend Yield Analysis
The face-value yield illusion
Retail investors often read “500% dividend” as a windfall. It is not. That 500% is calculated on the ₹2 face value, giving ₹10 per share. The number that matters to a buyer today is the dividend measured against the market price:
- ₹10 ÷ ~₹562 (recent CMP, early Sep 2026) = ~1.78%
- ₹10 ÷ ~₹521–546 (Aug 2026 band) = ~1.83–1.92%
- ₹10 ÷ ~₹585–588 (around the 13 May announcement, pre-result) = ~1.70%
So the real cash yield sits near 1.8% — roughly 281 times smaller than the “500%” headline. All yield figures move with the share price and must be re-checked against the live CMP at publication.
Why the yield looks modest
The low yield is not a sign of stress. It reflects a deliberately conservative payout policy: LIC Housing Finance retains the overwhelming majority of its profit to fund loan-book growth and strengthen capital, distributing under 10% of earnings. A rich yield here would actually signal a falling share price, which is not the case — the stock trades in a ₹459–598 band over the past year.
Yield reality check
A high dividend yield can come from a strong payout, a one-time special, or a collapsing share price. Here it is none of those extremes: the yield is low precisely because the payout is small relative to profit, not because the price has run up. Investors chasing income should size this correctly — it is a growth-oriented lender that pays a token, steadily rising dividend.
Dividend History Analysis
| Financial Year | Dividend / Share | Rate on FV ₹2 |
|---|---|---|
| FY2015–16 | ₹5.50 | 275% |
| FY2016–17 | ₹6.20 | 310% |
| FY2017–18 | ₹6.80 | 340% |
| FY2018–19 | ₹7.60 | 380% |
| FY2019–20 | ₹8.00 | 400% |
| FY2020–21 | ₹8.50 | 425% |
| FY2021–22 | ₹8.50 | 425% |
| FY2022–23 | ₹8.50 | 425% |
| FY2023–24 | ₹9.00 | 450% |
| FY2024–25 | ₹10.00 | 500% |
| FY2025–26 | ₹10.00 | 500% |
History compiled from third-party dividend trackers (TipRanks, INDmoney, Trendlyne); FY mapping by declaration year. Verify against exchange records.
A consistent, rising payer
LIC Housing Finance is a Consistent Payer. Over ten years the dividend has climbed from ₹5.50 to ₹10.00 — a compound growth of roughly 6.2% a year — with no cuts and no suspensions. There was a three-year plateau at ₹8.50 across FY21–FY23 (a cautious COVID-era stance), after which growth resumed. This is the second straight year at ₹10, so FY26 marks a pause in per-share growth, not a cut.
No specials, no surprises
The company pays a single annual final dividend — no interim dividends, no special dividends and no bonus/split-driven restatements in the recent decade (face value has stayed at ₹2). That regularity is a plus for income modelling, but the flat ₹10 for two years running is worth watching against a profit base that grew only ~3%.
Financial Performance Analysis
| Consolidated (₹ Cr) | FY2025–26 | FY2024–25 | Change |
|---|---|---|---|
| Total Income | 28,843.49 | 28,100.60 | +2.6% |
| Profit Before Tax | 7,103.47 | 6,878.86 | +3.3% |
| Net Profit (PAT) | 5,604.24 | 5,442.70 | +3.0% |
| EPS (₹) | 101.87 | 98.95 | +3.0% |
| Net Profit Margin | 19.45% | 19.36% | +9 bps |
Operating leverage: muted, not broken
Revenue grew 2.6%, profit 3.0% — profit inched ahead of revenue but only just. The loan book expanded a modest ~4.4% to ₹3.16 lakh crore, and net interest margin slipped about 5 bps to ~2.80% in Q4. This is a mature, slow-growth lender where the earnings engine is steady rather than accelerating.
Earnings quality: where the growth came from
Decomposing the modest profit rise: employee costs fell ~5.4% and other expenses fell ~3.9%, which cushioned earnings. Working the other way, full-year impairment provisions more than doubled (₹554 cr vs ₹261 cr) even though Q4 provisions eased. There are no obvious one-time gains, deferred-tax boosters or other-income spikes propping up the number — earnings quality is clean, but the growth is thin and opex-driven.
Cash Flow Analysis
Why the headline operating cash flow is negative — and why that’s normal here
The consolidated cash-flow statement shows net cash used in operating activities of –₹8,504 crore. Read literally, that looks alarming for a company paying a dividend. It is not, and this is the single most misunderstood line for a housing-finance company. For an HFC, fresh loan disbursements are treated as an operating outflow. Net loans disbursed of –₹13,885 crore is what drives the operating line negative — that is the business growing its loan book, funded by borrowings, not cash bleeding away.
The number that actually matters
Strip out net lending and the business generated ~₹5,381 crore of operating cash before loan disbursals. Against a dividend of ~₹550 crore, that is ~9.8x cover from operating cash alone — almost identical to the earnings cover. The dividend is funded out of current profits and operating cash generation, not by selling assets or piling on debt to pay shareholders.
Why standard “free cash flow” doesn’t apply
Conventional free-cash-flow coverage is not meaningful for a lending NBFC/HFC. A housing financier is designed to run negative operating cash while it grows its book, financing that growth with debt and deposits. The right lens is pre-lending operating cash, earnings cover, and balance-sheet liquidity — all of which are healthy here. The receivables-vs-revenue signal used for manufacturers is likewise not applicable to an interest-earning loan book.
Balance Sheet Strength
Leverage is easing
- Debt-equity ratio: 7.16 (from 7.96 a year ago)
- Total debt to total assets: 0.87
- Net worth: ~₹39,366 crore (standalone)
- Consolidated equity: ~₹41,433 crore
A ~7x debt-equity looks high in the abstract but is normal for a housing financier; the direction — de-leveraging — is the encouraging part.
Asset quality improving
- Gross NPA: 2.15% (from 2.47%)
- Net NPA: 1.08% (from 1.22%)
- Provision Coverage Ratio: 50.16%
- Liquidity Coverage Ratio: 180.74% (from 162.96%)
Both gross and net NPAs fell year-on-year, and the LCR at ~181% is well above the 100% regulatory floor — ample near-term liquidity to service borrowings and the dividend.
Capital adequacy (CRAR/Tier-1) is Not Disclosed by Company in this quarterly results filing; HFCs report it in the annual report. It should be sourced from the FY26 annual report before publication rather than estimated.
Dividend Sustainability Analysis
Applying the four-test sustainability scorecard, adapted for a housing-finance company (where standard FCF coverage does not apply):
1. Earnings coverage — Strong
Dividend is ~10x covered by EPS (₹101.87 vs ₹10). Payout ratio ~9.8%.
2. Operating-cash coverage — Strong
Pre-lending operating cash (~₹5,381 cr) covers the dividend ~9.8x.
3. Liquidity / cash coverage — Comfortable
Cash, bank balances and investments (~₹6,481 cr) cover the payout ~11.8x; LCR at ~181%.
4. Earnings trend — Slow but positive
Profit up ~3%, asset quality improving, leverage falling — but loan growth and margins are soft.
Verdict: Sustainable. With a payout under 10% of profit and roughly 10x cover from both earnings and operating cash, this dividend has a very wide safety margin. The constraint on the payout is not affordability — the company can clearly afford far more — but management’s deliberate choice to retain capital for growth. The mild caution is on growth in the dividend, not its safety: two flat years at ₹10 against low single-digit profit growth suggest per-share increases may stay gradual.
Peer Comparison
| Housing Financier | Approx. Dividend Yield | Approx. Payout | ROE (FY26) |
|---|---|---|---|
| LIC Housing Finance | ~1.8% | ~9.8% | ~15% |
| Can Fin Homes | ~1.6% | ~18–19% | ~17–18% |
| PNB Housing Finance | ~0.5% | ~7% | ~12.7% |
Peer figures from public sources (company disclosures, Simply Wall St, INDmoney, earnings calls); indicative and to be re-verified. PNB Housing face value ₹10; yields move with price.
Among listed housing financiers, LIC Housing Finance offers one of the higher cash yields (~1.8%) but on one of the lower payout ratios (~9.8%) — a combination explained by its low valuation (P/E around 5, P/B under 1). Can Fin Homes distributes a larger slice of profit (~18–19%) yet yields slightly less; PNB Housing pays a token dividend on a fast-growing base. LIC Housing’s ROE of ~15% sits mid-pack — healthy, but its slower loan growth is the trade-off.
Promoter Impact Analysis
Where the ₹550 crore goes
- Promoter — LIC of India (~45.24%): ~₹249 crore
- FIIs (~21.5%): ~₹118 crore
- DIIs / MFs (~21%): ~₹116 crore
- Public & retail (~12.3%): ~₹68 crore
Alignment, not extraction
Parent Life Insurance Corporation of India collects the single largest slice — roughly ₹249 crore — but because it holds under half the equity, the majority of the payout (~55%) flows to non-promoter shareholders. With such a low payout ratio, there is no sign of the dividend being used to funnel cash disproportionately to the promoter; every shareholder receives the same ₹10 per share.
Shareholding is as at June 2026 from public trackers (promoter 45.24%, FII ~21.5%, DII ~21%, public ~12.3%) and should be refreshed against the latest exchange filing before publication.
Taxation Analysis
How the dividend is taxed in India
Since April 2020, dividends are taxed in the hands of the shareholder at their applicable income-tax slab rate, added to “Income from Other Sources.” The company deducts TDS at 10% before payout where a shareholder’s total dividend from the company exceeds ₹10,000 in a financial year (the threshold was raised from ₹5,000 with effect from FY2025–26). For shareholders without a valid PAN, TDS applies at 20%. The TDS is not an extra cost — it is adjustable against your final tax liability.
Worked example — investor holding 1,000 shares
At exactly ₹10,000 no TDS is triggered (the amount must exceed the threshold); a holder of, say, 1,100 shares (₹11,000) would see ₹1,100 TDS deducted upfront. A shareholder in the 30% bracket keeps roughly ₹7 of every ₹10, cutting the effective yield to about 1.25%. Investors in lower slabs keep more; those in the 5% slab lose only ₹0.50 per share.
Key Risks
- Margin compression: Net interest margin slipped to ~2.80% and yields are moderating as older high-rate loans reprice and balance-transfer competition bites. Thinner spreads directly cap profit growth and future dividend headroom.
- Sluggish loan growth: The loan book grew only ~4.4%. If disbursement momentum stays weak, the earnings base that funds the dividend grows slowly — the flat ₹10 for two years is a symptom.
- Rising full-year credit costs: Impairment provisions more than doubled year-on-year (₹554 cr vs ₹261 cr). Any deterioration in the project-finance or non-housing book would pressure profit.
- High structural leverage: Debt-equity of ~7x means the model is sensitive to funding-cost spikes and liquidity conditions; a sharp rise in borrowing costs squeezes the spread.
- Legacy corporate exposures: The company remains entangled in large recovery cases (e.g. the widely reported Essel/Subhash Chandra guarantee litigation), a reminder that lumpy corporate/project loans carry tail risk.
- Dividend is policy-capped, not profit-capped: Because the payout is a deliberate ~10% of profit, dividend growth depends on management’s capital-allocation stance, which can stay conservative.
What To Monitor
- Net interest margin trajectory: Watch whether NIM stabilises above ~2.8% or keeps sliding — the clearest early signal for future profit and dividend growth.
- Loan-book & disbursement growth: A pick-up toward double-digit growth would be needed to lift the per-share dividend beyond ₹10.
- Asset quality & provisioning: Track GNPA/NNPA (currently 2.15%/1.08%) and the direction of impairment charges, especially in project and non-housing loans.
- Payout-ratio policy: Any move by the Board to raise the payout above ~10% would re-rate the income case; a third flat year at ₹10 would confirm a conservative stance.
- Cost of funds & leverage: Monitor incremental borrowing costs and whether debt-equity continues to ease from ~7.16.
- Capital adequacy (CRAR): Confirm the FY26 annual-report figure to gauge how much dividend headroom regulatory capital allows.
Conclusion
LIC Housing Finance’s FY26 dividend is best understood by separating two very different numbers. The “500%” headline is a face-value quirk; the real cash yield is about 1.8%. On the other side of the ledger, the payout is exceptionally safe — under 10% of profit, covered roughly 10 times by both earnings and pre-lending operating cash, backed by improving asset quality (GNPA down to 2.15%), easing leverage (D/E 7.16 from 7.96) and ample liquidity (LCR ~181%).
The genuine story is not the size of the dividend but its character: a consistent, conservatively-set, well-covered payout from a mature, slow-growth housing financier that chooses to retain most of its earnings. The positives are safety and consistency; the negatives are a low yield, a second flat year at ₹10 and soft loan growth and margins. Income-focused readers should weigh the modest yield against that safety, and growth-focused readers should watch NIM and loan growth rather than the dividend itself.
Positives: ~10x cover, sub-10% payout, improving NPAs, de-leveraging, strong liquidity, 10-year track record with no cuts. Negatives / watch-items: ~1.8% yield, flat ₹10 for two years, ~4% loan growth, NIM compression, doubled full-year credit costs, high structural leverage.
Frequently Asked Questions
What dividend has LIC Housing Finance announced for FY2025–26?
What is the actual dividend yield on LIC Housing Finance shares?
What is the record date for the LIC Housing Finance dividend?
What is the ex-dividend date?
When will the LIC Housing Finance dividend be paid?
Who is eligible to receive this dividend?
How is the dividend taxed?
Is the LIC Housing Finance dividend sustainable?
What is LIC Housing Finance’s dividend history?
Why does the operating cash flow look negative if the company is profitable?
How much of the dividend goes to promoter LIC of India?
What should investors monitor going forward?
Disclaimer
This article is for informational and educational purposes only and does not constitute investment advice or any buy, sell or hold recommendation. ShareBazaar Online is not a SEBI-registered investment adviser. Dividend figures, dates, financial ratios and market prices are compiled from the company’s board-meeting filing and audited FY2025–26 results dated 13 May 2026, supplemented by publicly available third-party data; several items (live CMP, record/ex-date, payment date, shareholding, peer figures and SEO metrics) require independent verification against official NSE/BSE and company disclosures before any decision. All yield figures are price-dependent and change with the market. Investing in equities carries risk; please consult a SEBI-registered financial adviser and read all official documents before investing. Data as understood on the analysis date; figures subject to revision.