
Dividend Snapshot
The one-line takeaway: The “450%” label is calculated on the ₹10 face value, not on what you pay for the share. At a market price of about ₹5,426 (NSE close, 10 Sep 2026), the ₹45 final dividend is worth roughly 0.83%. Even the entire FY26 payout of ₹205 — which includes a one-time special dividend — yields about 3.78%. CMP is live and must be re-verified before publication; all yields move with price.
Dividend Announcement Summary
At its board meeting on 26 May 2026, the Board of Directors of Procter & Gamble Health Limited approved the audited financial results for FY26 and recommended a final dividend of ₹45 per equity share (nominal value ₹10 each). The company disclosed the final dividend as a total payout of ₹7,470 lakhs (₹74.70 crore), payable on or before 25 September 2026, subject to shareholder approval at the 59th Annual General Meeting.
The full FY26 dividend picture
The ₹45 final is only the last leg. Earlier in the year, on 6 February 2026, the Board declared an interim dividend of ₹160 per share — which itself included a one-time special dividend of ₹50 per share (record date 12 Feb 2026, paid 27 Feb 2026). Adding it all up, the total dividend for FY26 is ₹205 per share: ₹155 of ordinary dividend (₹110 interim + ₹45 final) plus a ₹50 one-time special.
Why this matters
A ₹50 slice of the FY26 distribution is explicitly labelled “one-time” by the company. That means a shareholder budgeting future income off the ₹205 figure would be over-counting. The recurring, repeatable component is closer to ₹155 per share, and the ordinary final leg alone is ₹45. Distinguishing repeatable dividend from one-off is central to reading PGHL correctly.
Key Dates Timeline
Because the final dividend needed AGM approval, eligibility was fixed by the record date of 27 August 2026. Under India’s T+1 settlement cycle, the ex-date and record date effectively coincide; investors who held the shares by the record date were the ones on the register for this payout. The AGM on 3 September 2026 provided the shareholder approval the interim payout did not require. Ex-date should be confirmed against the official NSE/BSE corporate-action circular before publication.
Dividend Yield Analysis
The face-value illusion
Indian companies quote dividends as a percentage of face value, not market price. PGHL’s ₹45 final dividend on a ₹10 face value is reported as 450%; the full ₹205 works out to a headline-grabbing 2,050%. Neither number is the return you actually earn. What matters is dividend divided by the price you pay.
Real yield on latest price (≈₹5,426)
Yield near announcement (≈₹6,341)
Reading it straight: the recurring cash yield from PGHL sits in the ~2.8–3% band on the ordinary dividend. The eye-catching ~3.8% full-year figure is flattered by the one-time ₹50 special that will not repeat. So the “450%” headline and the sustainable ~2.9% ordinary yield are two very different truths about the same stock. All yields are price-dependent and computed on figures cited above; re-verify CMP live.
Dividend History Analysis
| Financial Year | Total Dividend / Share | Payout Ratio | Notable |
|---|---|---|---|
| FY26 (12m to Mar-26) | ₹205 | ~104% | Incl. ₹50 special |
| FY25 (9m to Mar-25) | ₹125 | ~89% | Transition period |
| FY24 (Jul23–Jun24) | ~₹260 | ~215% | Large special year |
| FY23 (Jul22–Jun23) | ~₹96 | ~69% | — |
| FY22 (Jul21–Jun22) | ~₹52 | ~45% | Lower payout |
| FY21 (Jul20–Jun21) | ~₹130 | ~122% | Above earnings |
| FY20 (18m to Jun20) | ~₹230 | ~150% | Cash-return heavy |
Per-share figures aggregated from exchange corporate-action records and payout ratios per Screener.in. Frequent financial-year changes (Dec → Jun → Mar) make year-on-year per-share comparison imprecise; figures marked “~” are indicative and should be desk-verified against restated data (Ind AS 33) before publication.
Classification: Consistent but Lumpy Payer
PGHL has paid a dividend in almost every year, so it qualifies as a consistent payer — but the amounts are lumpy, swinging with periodic special dividends rather than a smooth, growing base. The recurring ordinary dividend is the reliable part; the large specials (FY20, FY24, FY26) are episodic returns of surplus cash.
The payout trend to watch
Payout ratios have repeatedly exceeded 100% (FY20, FY21, FY24, FY26). Paying out more than the company earns is only possible by drawing on accumulated reserves. For a cash-rich, low-growth business that can be rational — but it is not the same as a dividend fully funded by the current year’s profit.
Financial Performance Analysis
Revenue FY26
₹1,408 Cr
PBT FY26
₹450 Cr
Net Profit FY26
₹327 Cr
EPS FY26
₹196.94
The comparability trap in the headline growth number
Several data feeds show FY26 profit up around 30% versus the prior year. That comparison is misleading. PGHL changed its financial year-end from June to March, so the “prior year” (FY25) was a nine-month stub period (Jul 2024–Mar 2025), while FY26 is a full twelve months. Comparing 12 months against 9 months manufactures growth that isn’t there on a like-for-like basis. The company itself flags this non-comparability in its results.
Growth reality
On a clean multi-year view, 5-year sales growth is roughly 1% CAGR — effectively flat. This is a slow-growth, brand-driven business (Evion, Neurobion, Seven Seas, Nasivion, Polybion, Livogen). Profit has grown faster than sales because operating margins expanded from the low-20s to about 33%, not because the top line is compounding.
Earnings quality
Profit is not propped up by other income — other income of about ₹15–17 Cr is small against ₹450 Cr PBT. The Q4 tax line carried a deferred-tax charge and an earlier-period tax adjustment, so quarter-level tax rates are noisy, but full-year tax at ~27% is normal. The core operating profit is genuine.
Cash Flow Analysis
Reported profit is an accounting opinion; cash is fact. On this test PGHL scores well. FY26 operating cash flow was ₹337.79 Cr against net profit of ₹326.91 Cr — an OCF-to-PAT ratio of about 1.03x. The company is converting more than its full accounting profit into actual cash, which is the hallmark of a high-quality, working-capital-light business.
Free cash flow
How the dividend is funded
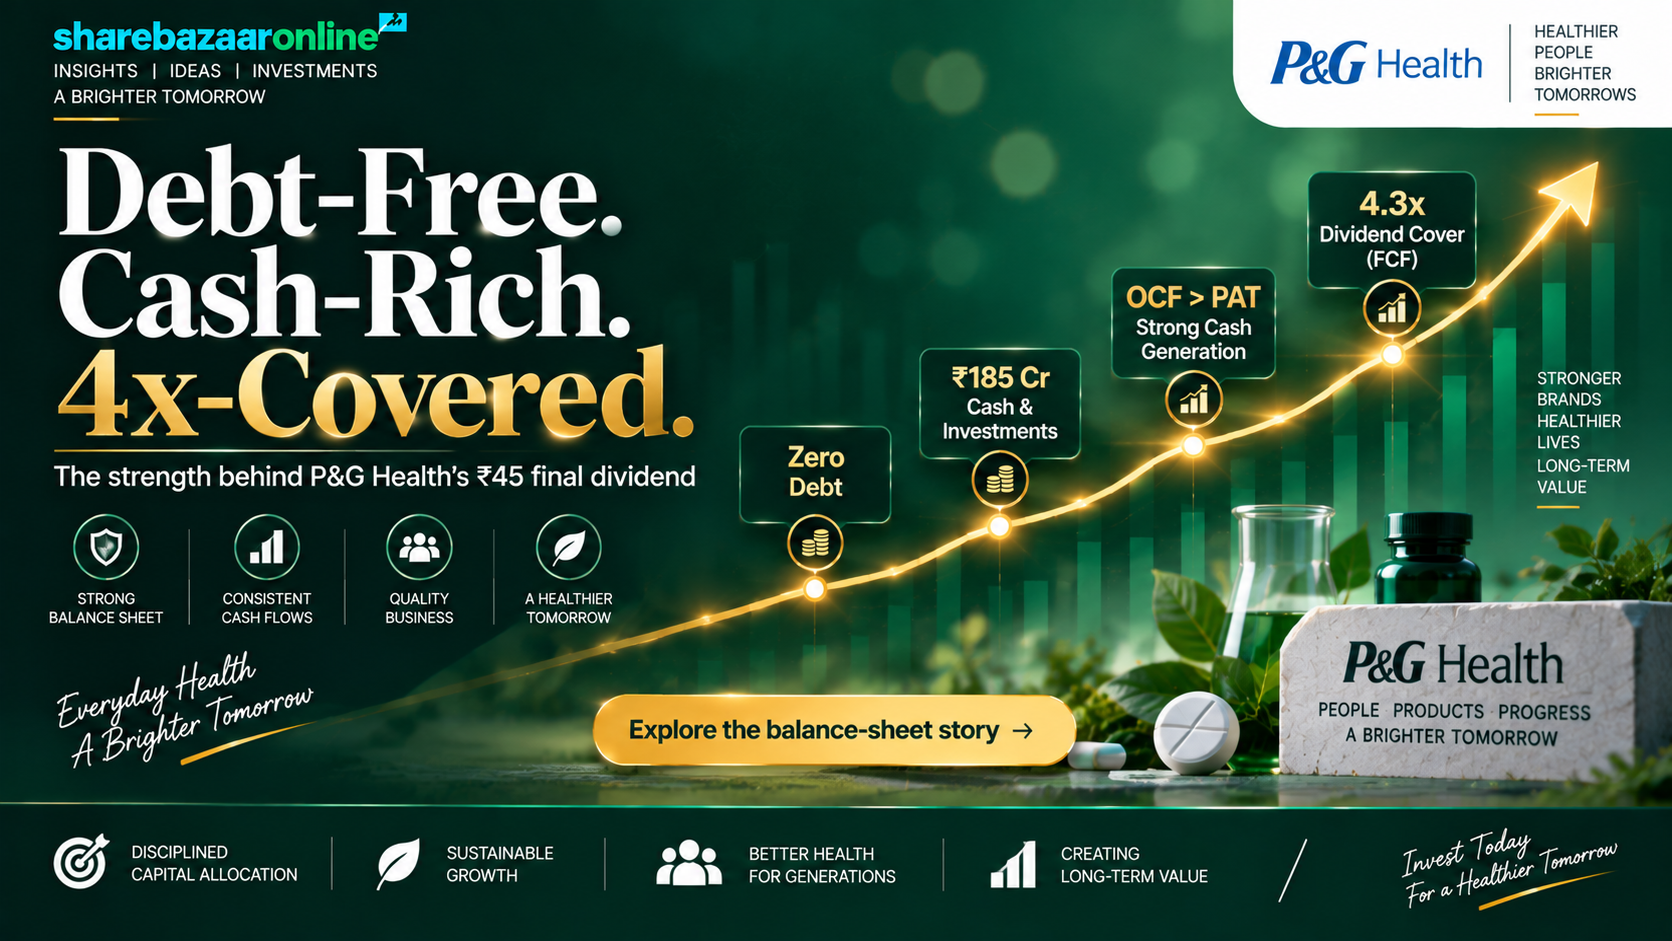
The ₹45 final dividend (₹74.70 Cr) is comfortably covered by FCF 4.3x over. But the full FY26 distribution of ₹340.30 Cr slightly exceeds FCF of ₹322.28 Cr — a coverage of about 0.95x. In other words, once the one-time special is added in, the year’s total payout is funded by current cash generation plus a small draw on the cash pile, not by earnings and FCF alone.
The company’s own cash-flow statement confirms the scale: ₹340.28 Cr of dividend was actually paid during FY26 (versus ₹232.40 Cr the prior period). That paid figure reconciles almost exactly with our computed FY26 distribution of ₹340.30 Cr — an important integrity check that the per-share math and the cash statement agree.
Balance Sheet Strength
Debt-free, cash-backed
Return ratios
The hidden story: reserves are shrinking
Sky-high ROE and ROCE are partly a capital-structure effect: because PGHL keeps distributing profit rather than retaining it, its equity base stays small, mechanically lifting return ratios. Reserves have fallen from roughly ₹890 Cr (mid-2020) to about ₹508 Cr (Mar 2026). That is deliberate cash return, not distress — but it means the balance-sheet cushion is thinning even as the business remains debt-free.
Dividend Sustainability Analysis
| Test | Final ₹45 | Full-Year ₹205 | Verdict |
|---|---|---|---|
| Earnings coverage (EPS/DPS) | 4.38x | 0.96x | Final strong; full-year tight |
| OCF coverage | 4.52x | 0.99x | Final strong; full-year tight |
| FCF coverage | 4.31x | 0.95x | Final strong; full-year <1x |
| Cash coverage (years of cover) | 2.48x | 0.54x | Ample for ordinary payout |
Verdict: Sustainable on the ordinary dividend; Conditionally Sustainable at the full ₹205 rate
The recurring ordinary dividend (₹155, including the ₹45 final) is comfortably covered by earnings and free cash flow. The stress only appears when the one-time ₹50 special is included: at ₹205 the payout crosses 100% of profit and just tips past FCF. Since the special is explicitly non-recurring, the right read is sustainable ordinary dividend, with periodic specials that depend on surplus cash rather than a permanent commitment. The debt-free balance sheet and ₹185 Cr cash give management room, but repeated 100%+ payout years cannot continue indefinitely without either faster earnings growth or a smaller cash pile.
Peer Comparison
| MNC Pharma | Div Yield | Payout | 3-Yr ROE | Debt |
|---|---|---|---|---|
| P&G Health (PGHL) | ~2.9% | ~104% | ~43% | Debt-free |
| Abbott India | ~1.5% | ~72% | ~35% | Debt-free |
| Sanofi India | ~2.8% | ~72% | ~48% | Debt-free |
| P&G Hygiene (PGHH) | ~2.0% | high | high | Debt-free |
Yields/payouts per data vendors (Screener.in, SimplyWall.st, INDmoney); figures are approximate, trailing, and price-dependent — desk-verify before publication. The broad Indian pharmaceuticals industry average dividend yield is only about 0.8%.
Against listed MNC-pharma peers, PGHL sits at the high end for dividend yield and the highest for payout ratio. All four names share the MNC template — debt-free, cash-rich, brand-led, margin-focused rather than volume-focused. What sets PGHL apart is that it is distributing at or above 100% of profit, well ahead of Abbott and Sanofi’s ~72%. On yield alone, PGHL comfortably beats the ~0.8% pharma-industry average.
Promoter Impact Analysis
Who owns PGHL
Promoter dividend income
With a 51.82% promoter stake, the P&G parent receives just over half of every rupee distributed. Of the full FY26 payout of ₹340.3 Cr, roughly ₹176 Cr flows to the promoter and the balance to public and institutional shareholders. Because dividends are paid pro-rata, minority holders benefit on identical per-share terms — but it is worth noting that a high-payout, reserve-drawing policy is one common way a cash-rich MNC subsidiary channels surplus back to its parent. There is no differential treatment; every shareholder receives the same ₹45 per share.
Taxation Analysis
Since April 2020, dividends are taxed in the hands of the investor at their applicable income-tax slab rate — the company no longer pays Dividend Distribution Tax. The company deducts TDS at 10% if your total dividend from PGHL in a financial year exceeds ₹10,000 (TDS is 20% if PAN is not furnished). That TDS is adjustable against your final tax liability.
Worked example — final ₹45, 1,000 shares
Full-year ₹205, 1,000 shares
For a 30%-slab investor, the effective post-tax yield on the final ₹45 is roughly 0.58% at a ~₹5,426 price. Surcharge/cess ignored for simplicity.
Key Risks
1. Flat top line. Five-year sales CAGR of about 1% means dividend growth ultimately depends on margins, not volume. If margins normalise from today’s ~33%, payout capacity falls.
2. Payout above 100%. Distributing more than the company earns draws down reserves (₹890 Cr → ₹508 Cr). This cannot continue indefinitely without faster growth.
3. One-time specials inflate expectations. A shareholder anchoring on the ₹205 / ~3.8% full-year figure may be disappointed when the ₹50 special does not repeat.
4. Regulatory / pricing pressure. Portions of the pharma portfolio can fall under National Pharmaceutical Pricing Authority price control, capping margins.
5. Concentration and valuation. A single-segment (pharmaceuticals) MNC subsidiary trading at ~27x earnings and ~17x book leaves little room for disappointment; low liquidity can amplify price swings.
What To Monitor
1. Ordinary-dividend trajectory. Strip out specials and track whether the recurring ₹155-ish base is holding, rising, or slipping year to year.
2. Revenue growth returning. Any move above low-single-digit sales growth would materially change the dividend-sustainability math.
3. Operating margin (OPM ~33%). Since profit growth is margin-led, watch for raw-material or employee-cost pressure compressing OPM.
4. Cash and reserves balance. Continued reserve erosion signals distributions are outrunning earnings; a stabilising cash pile signals discipline.
5. Payout-ratio normalisation. Watch whether payout settles back toward the ~70–90% of peers or keeps breaching 100%.
Conclusion
P&G Health’s ₹45 final dividend is a genuinely well-covered payout — earnings and free cash flow cover it more than four times over, and the balance sheet is debt-free with ₹185 Cr of cash. The headline “450%” is a face-value artefact; the real recurring yield is closer to ~2.9%, still above the pharma-industry average. The nuance sits in the full-year picture: at ₹205 per share, FY26’s total payout crossed 100% of profit and edged past free cash flow, propped up by a one-time ₹50 special and a modest draw on reserves.
Positives
- Debt-free, cash-rich, high return ratios
- OCF exceeds net profit — strong cash conversion
- Ordinary dividend well covered (4x+)
- Yield above pharma-industry average
Negatives
- Near-flat ~1% sales CAGR
- Full-year payout above 100% of profit
- Reserves shrinking on repeated high payouts
- Specials inflate the headline yield
Frequently Asked Questions
What dividend has P&G Health announced for FY26?
What is the P&G Health dividend yield?
What was the record date for the PGHL final dividend?
What is the ex-dividend date?
When will the dividend be paid?
Who was eligible for this dividend?
How is the P&G Health dividend taxed?
Is the PGHL dividend sustainable?
What is P&G Health’s dividend history?
Why does the “450%” dividend not mean a 450% return?
What should investors monitor going forward?
Disclaimer
This article is for informational and educational purposes only and does not constitute investment, financial, legal or tax advice, nor a buy, sell or hold recommendation. ShareBazaar Online is not a SEBI-registered investment adviser. Dividend figures, dates and financials are drawn from the company’s exchange filing dated 26 May 2026 and third-party sources (Screener.in, exchange corporate-action records, data vendors) believed reliable but not independently guaranteed. Market price, yield, record/ex-dates and AGM/payment status are time-sensitive and must be re-verified against official NSE/BSE disclosures before any decision. All computed ratios are derived from the figures cited and may differ from other groupings. Investing in equities carries risk, including loss of capital. Please consult a SEBI-registered investment adviser and conduct your own due diligence before investing.