
Dividend Snapshot
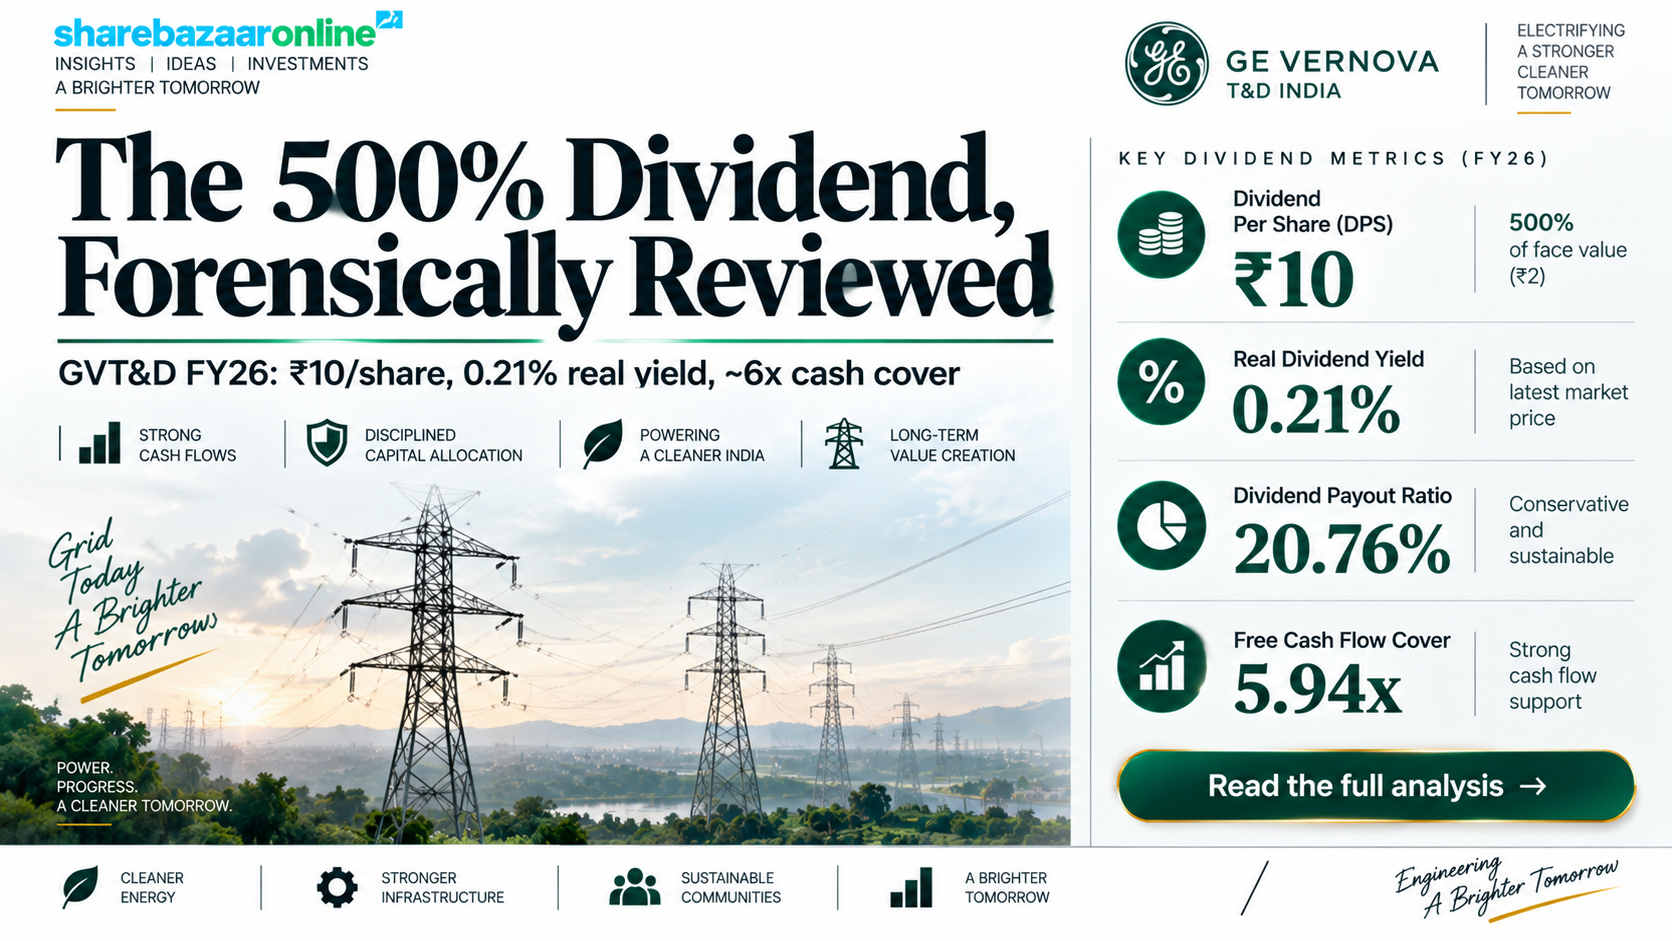
Dividend Per Share
₹10.00
Final dividend for FY2025-26 (500% of ₹2 face value)
Real Dividend Yield (at CMP)
~0.21%
₹10 ÷ ₹4,673 CMP (NSE close, 9 Sep 2026)
Dividend Type
Final
Recommended by Board on 18 May 2026; AGM-approved 9 Sep 2026
Payout Ratio
20.76%
₹256.05 Cr dividend ÷ ₹1,233.25 Cr PAT (FY26)
Record Date
21 Aug 2026
Friday (now passed); ex-date also 21 Aug 2026
Total Dividend Outflow
₹256.05 Cr
On ~25.61 crore equity shares
Dividend Announcement Summary
At its board meeting on 18 May 2026, the Board of GE Vernova T&D India Limited (formerly GE T&D India Limited) recommended a final dividend of ₹10 per equity share — a 500% dividend on the ₹2 face value — for the financial year ended 31 March 2026. The recommendation was subject to shareholder approval at the ensuing Annual General Meeting, which was held on 9 September 2026 where the payout was approved.
What "500%" really means
The 500% figure is dividend as a percentage of face value (₹10 ÷ ₹2). It is not a 500% return. Because GVT&D trades near ₹4,673, the ₹10 payout translates to a real yield of only about 0.21%. This face-value versus market-price gap is the single most misread number in Indian dividend headlines.
A doubling of the payout
GVT&D paid ₹5 per share for FY2024-25. The FY2025-26 dividend of ₹10 is a 100% increase in the rupee payout. Crucially, the payout ratio stayed near 21% because earnings themselves roughly doubled — the company kept its distribution discipline rather than stretching it.
Key Dates Timeline
Board Meeting / Announcement
18 May 2026
Ex-Dividend Date
21 Aug 2026
Record Date
21 Aug 2026 (Friday)
AGM (Approval)
9 Sep 2026 — Approved
Payment / Dispatch Date
Within 30 days of AGM — i.e. on or before ~8 October 2026
Exact credit date: Not Disclosed by Company (company stated the 30-day outer limit from AGM).
Dividend Yield Analysis — The Reality Check
This is where GVT&D separates the headline from the reality. A "500% dividend" grabs attention, but for anyone buying at today's price the income is negligible.
Face value vs market price
- Dividend on face value: 500% (₹10 on ₹2)
- Real yield at CMP ₹4,673: ~0.21%
- Yield at announcement (18 May 2026): ~0.21% (CMP was ~₹4,760)
Why the yield is so low
The yield is low not because the dividend is weak — it doubled — but because the share price has re-rated sharply. GVT&D is up roughly 60% over the past year and trades at about 85x earnings and 44.5x book value. When a stock compounds faster than its dividend, yield compresses. This is a growth-and-capital-appreciation story, not an income story.
Bottom line: Investors chasing the "500%" tag as income will be disappointed — ₹1,00,000 invested today would generate roughly ₹214 of gross dividend a year before tax. GVT&D is owned for growth in India's power transmission and HVDC build-out, with the dividend a small token of a disciplined ~21% payout policy.
Dividend History Analysis
| Financial Year | Dividend Per Share | On ₹2 Face Value | Type |
|---|---|---|---|
| FY2025-26 | ₹10.00 | 500% | Final |
| FY2024-25 | ₹5.00 | 250% | Final |
| Earlier years | ₹1.80 – ₹5.00 (range) | 90% – 250% | Varied / with gaps |
Per-share amounts restated to the current ₹2 face value. Multi-year detail: Not Independently Verified against official records — desk to confirm exact per-year DPS from company filings before publish.
Consistency verdict
GVT&D is best classified as an Irregular-to-Cyclical Payer transitioning to a growing payer. Third-party trackers indicate it paid dividends in roughly 6 of the last 10 years, with at least one cut in that window — a legacy of the earlier loss-making phase of the T&D business. The pattern has firmed up markedly as profitability turned around.
Growth trend
The recent trajectory is clearly upward: ₹5 (FY25) → ₹10 (FY26), a doubling. There have been no special dividends in the recent record; this is an ordinary final dividend tracking the earnings turnaround. The 2008 5:1 stock split is the main historical corporate action to remember when comparing older per-share figures.
Financial Performance Analysis (FY2025-26)
GE Vernova T&D India has no subsidiary, associate or joint venture, so its standalone results are effectively its consolidated results. All figures below are audited for the year ended 31 March 2026.
Revenue from Operations
₹6,206.31 Cr
+44.6% YoY (from ₹4,292.30 Cr)
Net Profit (PAT)
₹1,233.25 Cr
+102.7% YoY (from ₹608.33 Cr)
EPS (Basic & Diluted)
₹48.16
+102.7% YoY (from ₹23.76)
Operating EBITDA Margin (approx.)
~27%
Sharp expansion vs the low-margin legacy years
Earnings quality: is the profit doubling "real"?
This is where most wire coverage stops. We looked underneath the profit. The doubling of PAT is operationally driven and high quality, for three reasons:
- Other income is small: just ₹90.84 Cr, only ~7.4% of PAT — the profit is not propped up by treasury gains.
- The exceptional item was a charge, not a credit: a net ₹63.57 Cr charge (a labour-code provision) actually reduced reported profit. Profit doubled despite a one-off drag, which is a positive signal.
- Tax rate is normal: effective tax was ~25.2%. A modest ₹38.5 Cr deferred-tax credit helped at the margin but did not distort the result.
Operating leverage did the heavy lifting: revenue up ~45% flowed through to profit doubling as fixed costs were absorbed and margins expanded — the opposite of the "revenue up, profit down" trap.
Cash Flow Analysis — Because Cash Is Fact
Operating Cash Flow (FY26)
₹1,709.88 Cr
OCF/PAT = 1.39x (excellent conversion)
Free Cash Flow (OCF − Capex)
₹1,521.46 Cr
Capex a modest ₹188.42 Cr — asset-light growth
Profits are backed by cash
Reported profit is an opinion; cash is a fact — and here the two agree. GVT&D converted ₹1.39 of operating cash for every ₹1 of reported profit, a rare feat for a project-heavy engineering business. This is largely because it runs on customer advances: even though trade receivables rose ~₹747 Cr with the order surge, a larger jump in advances and current liabilities kept working capital cash-positive.
How is the dividend funded?
The ₹256.05 Cr dividend is funded entirely from current-year free cash flow — not from reserves, asset sales or borrowings. FCF of ₹1,521 Cr covers the payout nearly 6 times over. One item to watch: the company lent ₹392.70 Cr as an inter-corporate deposit to a related party during FY26, a larger cash use than the dividend itself. This is a governance/capital-allocation point worth monitoring, not a red flag on the dividend.
Balance Sheet Strength
Total Borrowings
NIL — Debt-Free
Only lease liabilities of ~₹24 Cr on the books
Cash & Bank Balances
₹1,527.72 Cr
Plus ₹971 Cr inter-corporate deposit (loans)
Total Equity (Net Worth)
₹2,690.29 Cr
Book value ~₹105 per share
Return on Equity (approx.)
~55%
Among the highest in the heavy-electrical space
Dividend Sustainability Analysis
Test 1 — Earnings Coverage
4.82x — PASS
EPS ₹48.16 vs DPS ₹10
Test 2 — Operating Cash Flow Coverage
6.68x — PASS
OCF ₹1,709.88 Cr vs outflow ₹256.05 Cr
Test 3 — Free Cash Flow Coverage
5.94x — PASS
FCF ₹1,521.46 Cr vs outflow ₹256.05 Cr
Test 4 — Cash & Liquidity Coverage
5.97x — PASS
Cash+bank ₹1,527.72 Cr vs outflow; debt-free
Verdict: Sustainable
On all four tests — earnings, operating cash flow, free cash flow and liquidity — the FY26 dividend clears comfortably. With a debt-free balance sheet, ~21% payout discipline, and cash coverage of roughly 6x, the payout is Sustainable. The only caveat is that GVT&D is a cyclical, order-book-driven business: a downturn in T&D capex would pressure earnings and, in turn, the rupee dividend — even if this year's payout is amply funded.
Peer Comparison
| Company | Approx. Dividend Yield | Latest Dividend | Approx. ROE |
|---|---|---|---|
| GE Vernova T&D India | ~0.21% | ₹10 (FY26) | ~55% |
| Hitachi Energy India | ~0.02-0.03% | ₹8 (FY26) | ~23% |
| ABB India | ~1.6% | ₹90 (FY26) | ~25%+ |
| CG Power & Industrial | ~0.1% | Small | High |
| BHEL | ~0.1% | ~₹0.5 | ~6% |
Peer yields/ROE are approximate, from third-party trackers, and price-dependent. Not Independently Verified — desk to confirm live figures at publish.
The pattern is consistent across the sector: heavy-electrical and T&D leaders are low yielders because their share prices have re-rated far faster than their dividends. Only ABB India stands out with a materially higher ~1.6% yield, helped by a large one-off component in its recent payout. On profitability, GVT&D's ~55% ROE is the standout in the group — its low yield reflects a rich valuation and a growth mandate, not weak fundamentals.
Promoter Impact Analysis
Promoter Holding (GE Vernova group)
51.0%
FII ~22.9% • DII ~18.5% • Public ~7.6% (as of Jun 2026)
Promoter Share of the Dividend
~₹130.59 Cr
51% of the ₹256.05 Cr total outflow
Of the ₹256.05 Cr paid out, roughly ₹130.59 Cr flows to the GE Vernova promoter group, while public and retail shareholders (~7.6%) collectively receive around ₹19.46 Cr. Because the payout ratio is a modest ~21%, the dividend is not a mechanism to disproportionately extract cash to the promoter — it is a proportional distribution, with the bulk of profit retained in the business. Institutional interest is notable: FIIs and DIIs together own over 41%, a sign of broad professional conviction.
Taxation Analysis
Since FY2020-21, dividends in India are taxed in the hands of the shareholder at their applicable income-tax slab rate (the old Dividend Distribution Tax is gone). The company also deducts TDS at 10% under Section 194 if total dividend paid to a resident shareholder in a financial year exceeds ₹10,000 (a threshold raised from the earlier ₹5,000 with effect from FY2025-26). A valid PAN is required; without it, TDS is 20%.
Worked example — 1,000 shares, 30% tax slab
- Gross dividend: 1,000 × ₹10 = ₹10,000
- TDS @10% (as it exceeds ₹10,000 — here it is exactly at the threshold; TDS applies once crossed): up to ₹1,000, adjustable against final tax
- Total tax at 30% slab: ₹3,000
- Net dividend in hand: ₹7,000
- Post-tax effective yield at CMP ₹4,673: ~0.15%
Illustrative only; not tax advice. TDS threshold and rates depend on your residency and PAN status. Consult a tax professional.
Key Risks
- Valuation risk: at ~85x earnings and ~44.5x book, the stock prices in years of flawless execution. Any growth disappointment could de-rate the shares sharply — a far bigger swing than the 0.21% dividend.
- Cyclicality & order-book dependence: revenue is tied to power-transmission and HVDC capex cycles (PowerGrid, state utilities). A slowdown in ordering would hit earnings and the future rupee dividend.
- Execution & supply-chain risk: tighter delivery windows and global bottlenecks for HVDC valves and high-voltage components can compress margins if timelines slip.
- Related-party exposure: the ₹392.70 Cr inter-corporate deposit lent to a related party during FY26, and material related-party transactions approved at the AGM, warrant ongoing governance scrutiny.
- Margin normalisation: current ~27% operating margins are elevated; as industry capacity expands and competition intensifies (ABB, Hitachi Energy, Siemens Energy, CG Power), pricing power could ease.
What To Monitor
- Order inflows & backlog: track quarterly order intake and the private-sector backlog (which surged into Q1 FY27) — the leading indicator of future revenue and dividend capacity.
- Operating margin trajectory: watch whether ~27-29% margins hold as the order book converts to revenue.
- Payout policy: see if management holds the ~21% payout as earnings grow, or formalises a dividend policy — that would signal how much of future profit reaches shareholders.
- Related-party dealings: monitor the inter-corporate deposit balance and RPT disclosures for any escalation.
- Working capital & cash conversion: keep an eye on receivables versus customer advances; the strong OCF/PAT ratio depends on advances staying healthy.
- HVDC project wins & exports: large HVDC awards and export orders are the structural growth levers underpinning the premium valuation.
Conclusion
The GE Vernova T&D India dividend for FY2025-26 is a study in reading beyond the headline. The "500% dividend" is a real ₹10 per share, but a real yield of only ~0.21% — because the stock has compounded far faster than its payout. On the numbers that matter, the dividend is on solid ground: PAT doubled to ₹1,233.25 Cr on high-quality, cash-backed earnings; the payout of ₹256.05 Cr is covered nearly 6x by free cash flow; and the balance sheet is debt-free with ~55% ROE.
The honest framing for readers: GVT&D is not an income stock. It is a high-growth, richly valued play on India's power-transmission and HVDC build-out, where the dividend is a small, disciplined token rather than the reason to own it. The payout is Sustainable today; the real risks sit in valuation, cyclicality and execution — not in the cheque itself.
Frequently Asked Questions
What dividend has GE Vernova T&D India announced for 2026?
What is the GE Vernova T&D India dividend yield?
What is the record date for the GE Vernova T&D India dividend?
What was the ex-dividend date?
When will the GE Vernova T&D India dividend be paid?
Who was eligible for the dividend?
How is the GE Vernova T&D India dividend taxed?
Is the GE Vernova T&D India dividend sustainable?
What is GE Vernova T&D India's dividend history?
Why is the dividend yield so low despite a 500% dividend?
What should investors monitor going forward?
Does GE Vernova T&D India have any debt?
Disclaimer
This article is for informational and educational purposes only and does not constitute investment, financial, legal or tax advice, nor a recommendation to buy, sell or hold any security. ShareBazaar Online is not a SEBI-registered investment adviser or research analyst. Dividend figures, dates and financials are drawn from the company's exchange filing dated 18 May 2026 and third-party sources; market-price-dependent metrics (yields, valuation multiples) change continuously and were based on data available around 9-11 September 2026. Peer and keyword-metric figures marked as not independently verified require desk confirmation. Readers must verify all figures against official NSE/BSE disclosures and consult a qualified financial adviser before making any investment decision. ShareBazaar Online accepts no liability for actions taken based on this content.