
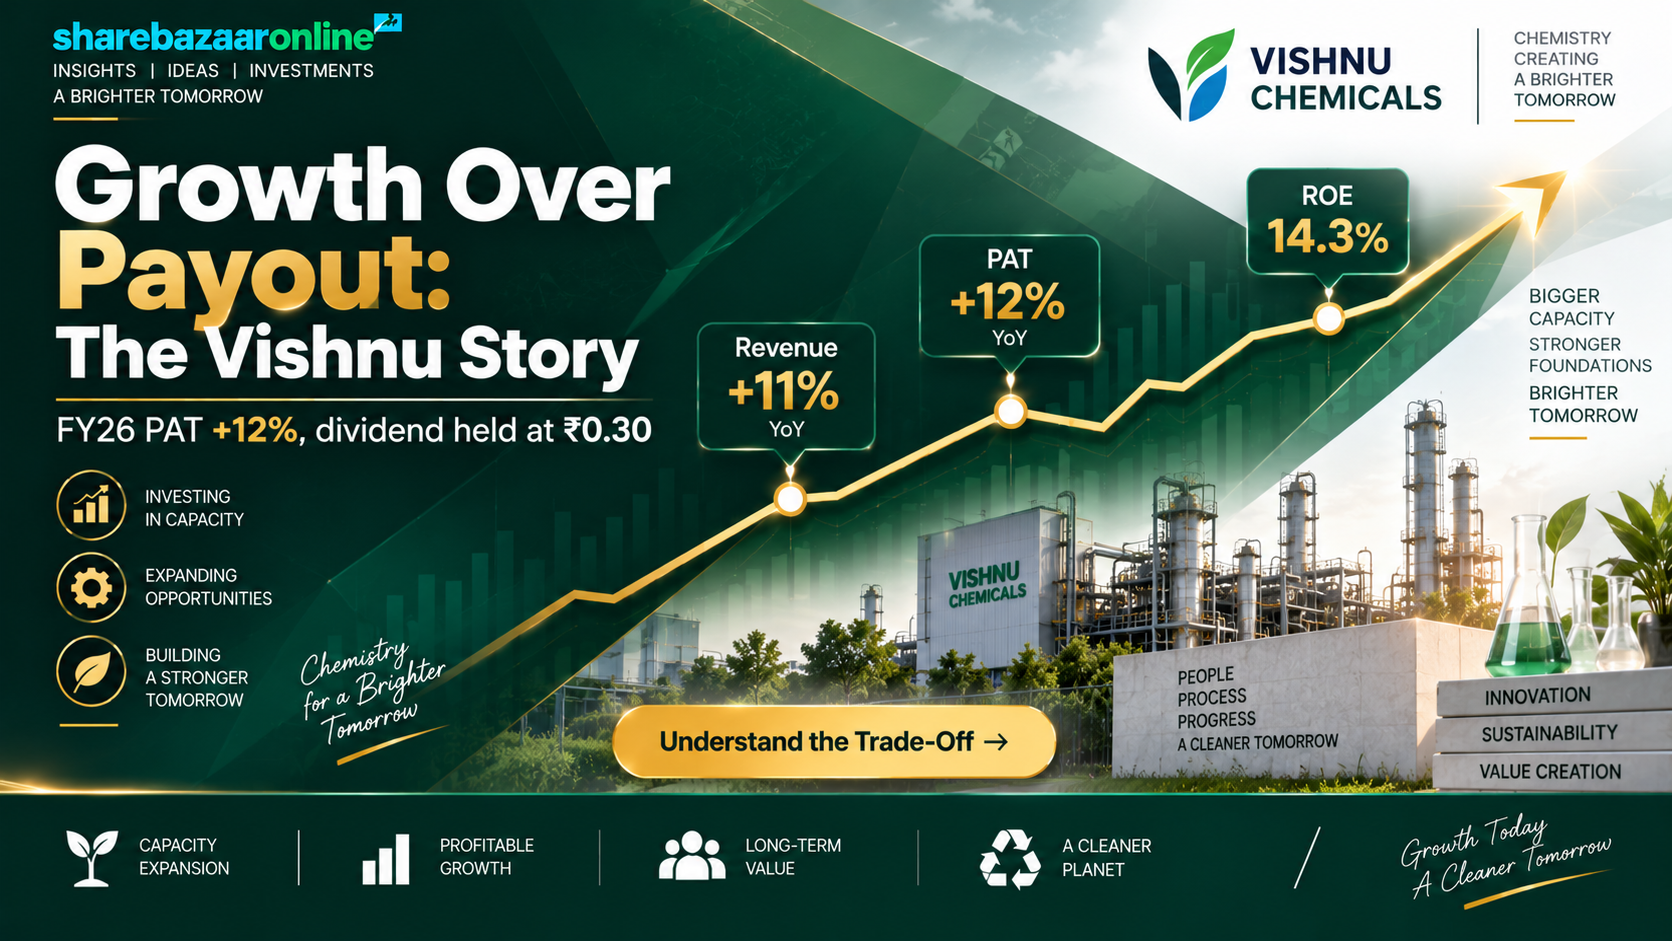
Dividend Snapshot
Vishnu Chemicals Limited (NSE: VISHNU, BSE: 516072, ISIN: INE270I01022) has recommended a final dividend of ₹0.30 per equity share for the financial year ended March 31, 2026. On a face value of ₹2, this works out to a 15% dividend. The headline "15%" is calculated on face value, not on the market price — a distinction that changes everything for a real investor.
Dividend Details
- Dividend Type: Final Dividend
- Dividend Per Share: ₹0.30
- Dividend Rate (on face value): 15%
- Face Value: ₹2
- Financial Year: FY 2025–26
- Board Meeting: May 30, 2026
The Real Yield
- Market Price (CMP): ₹709 (09-Sep-2026)
- Face-Value Yield (headline): 15.0%
- Actual Market Yield: 0.04%
- Total Dividend Outflow: ₹2.02 crore
- Dividend Payout (consolidated): 1.42% of PAT
- Earnings Coverage: 70.5x
The one-line story: Vishnu Chemicals is a fast-growing, high-return specialty chemicals maker whose dividend is a token gesture — a payout of barely 1.4% of profit and a real yield near zero. The company is retaining almost all of its cash to fund a large capital-expenditure cycle, so this is a growth stock that happens to pay a symbolic dividend, not an income stock. Record date, ex-date and payment date were not disclosed in the board outcome and are pending an official exchange circular.
Dividend Announcement Summary
At its board meeting held on May 30, 2026 (commenced 3:30 pm, concluded 4:15 pm), the Board of Directors of Vishnu Chemicals Limited approved the audited standalone and consolidated financial results for FY26 and recommended a final dividend of ₹0.30 per equity share of ₹2 each (15%). The dividend is expressly subject to shareholder approval at the ensuing 33rd Annual General Meeting (AGM).
What the Board Confirmed
- Auditors (Jampani & Associates) issued an unmodified opinion on both standalone and consolidated results.
- Dividend recommended for FY 2025–26.
- Payment is conditional on AGM approval — final dividends are not payable until shareholders ratify them.
What Was Left Open
- Record date — Not Disclosed by Company (to be informed in due course).
- Ex-date — Not Disclosed by Company.
- Payment date — Not Disclosed by Company.
- 33rd AGM date — Not Disclosed by Company.
For context, the company followed the same pattern last year: the FY25 final dividend of ₹0.30 had a record date of 08-Aug-2025 and was paid around 08-Sep-2025, with the AGM in the August–September window. A similar timeline is plausible for FY26 but has not been confirmed and must be verified against the official NSE/BSE corporate-action circular before relying on any date.
Key Dates Timeline
| Event | Date | Status |
|---|---|---|
| Board Meeting / Announcement | 30-May-2026 | Confirmed (filing) |
| Record Date | Not Disclosed by Company | Pending exchange circular |
| Ex-Dividend Date | Not Disclosed by Company | Pending exchange circular |
| 33rd AGM | Not Disclosed by Company | To be informed |
| Payment Date | Not Disclosed by Company | Within 30 days of AGM (statutory limit) |
Under the Companies Act, 2013, once a final dividend is declared at the AGM it must be paid within 30 days. Until the record date is officially notified, no investor can confirm eligibility. Buying on or after the ex-date does not entitle you to this dividend.
Dividend Yield Analysis
The Face-Value Illusion
This is the single most misunderstood number in Indian dividend reporting. A "15% dividend" sounds generous, but 15% is applied to the ₹2 face value, not the price you pay in the market. Fifteen percent of ₹2 is exactly ₹0.30. Against the market price of ₹709, that ₹0.30 is a yield of just 0.04% — roughly ₹4 of dividend for every ₹10,000 invested.
Yield, Three Ways
- On face value (headline): 15.00%
- On CMP ₹709 (real yield): 0.042%
- On approx. announcement-day price (~₹525): 0.057% (price NIV)
What ₹1,00,000 Earns
At ₹709 per share, ₹1,00,000 buys about 141 shares, which earn roughly ₹42 in dividend for the year (before tax). The return from holding Vishnu Chemicals has come almost entirely from capital appreciation — the stock is up around 47% over the past year — and not from dividend income.
Read this correctly: a near-zero yield here is not a warning sign of distress. It is a deliberate choice by a profitable, reinvesting company. The yield is low because the share price has risen sharply and because management keeps the payout tiny to fund expansion — the opposite of a "high yield trap," where a yield is high because the price has collapsed.
Dividend History Analysis
Vishnu Chemicals changed its face value from ₹10 to ₹2 (a 1:5 sub-division, ex-date 13-Jan-2023). To compare dividends fairly across years, older payouts must be restated to the current ₹2 face value (per Ind AS 33). The restated table below tells the real story.
| Financial Year | DPS (restated to ₹2 FV) | As Declared | Payout % of PAT |
|---|---|---|---|
| FY21 | ₹0.20 | ₹1.00 (₹10 FV) | ~3% |
| FY22 | ₹0.40 | ₹2.00 (₹10 FV) | ~3% |
| FY23 | ₹0.40 | ₹0.40 (₹2 FV) | ~2% |
| FY24 | ₹0.30 | ₹0.30 (₹2 FV) | ~2% |
| FY25 | ₹0.30 | ₹0.30 (₹2 FV) | ~2% |
| FY26 | ₹0.30 | ₹0.30 (₹2 FV) | ~1.4% |
The Non-Obvious Finding
The per-share dividend has actually declined and then frozen — from a restated ₹0.40 (FY22–FY23) down to ₹0.30, held flat for three straight years (FY24, FY25, FY26). Meanwhile profits roughly doubled. The result: the payout ratio has collapsed from ~11% a decade ago to about 1.4% today. Vishnu has grown its earnings far faster than its dividend.
Classification
Consistent Payer — Token Level. The company has paid a small dividend every year without cuts or suspensions, which signals financial stability. But the amount is symbolic and has not grown with earnings. Investors should treat the dividend as a reliability signal, not a source of income.
Financial Performance Analysis
| Consolidated (₹ crore) | FY26 | FY25 | Growth |
|---|---|---|---|
| Revenue from Operations | 1,609.70 | 1,446.56 | +11.3% |
| EBITDA | 275.03 | 243.69 | +12.9% |
| Profit Before Tax | 195.35 | 168.23 | +16.1% |
| Net Profit (PAT) | 142.27 | 126.64 | +12.3% |
| EPS (₹) | 21.14 | 19.23 | +9.9% |
Operating Leverage Check
Growth is healthy and broadly balanced: revenue +11.3%, EBITDA +12.9%, PBT +16.1%. Operating margin nudged up slightly to 17.1% (from 16.9%). PBT grew faster than EBITDA mainly because finance costs and depreciation rose only modestly. This is genuine operating strength, not a one-off.
Earnings Quality Flag
One caveat: other income jumped 48% to ₹22.66 crore and now contributes 11.6% of PBT (up from 9.1%). PAT (+12.3%) grew slower than PBT (+16.1%) because the effective tax rate rose to ~27%. Core operating profit remains the main driver, but the growing "other income" reliance is worth monitoring.
Standalone vs Consolidated Divergence
This is a genuine holding-company structure with ten subsidiaries. Consolidated EPS is ₹21.14, but standalone EPS is only ₹13.21 — meaning subsidiaries contribute close to 40% of group profit. Standalone PAT was ₹88.93 crore versus consolidated ₹142.27 crore. Any dividend decision at the parent is funded from standalone cash, so both views matter. Against standalone profit, the payout is still tiny at just 2.3%.
Cash Flow Analysis
Reported profit is an accounting opinion; cash is a fact. Here the two diverge in an important way.
Operating Cash Flow
- Consolidated OCF FY26: ₹127.13 crore
- OCF / PAT: 0.89x
- Net Profit FY26: ₹142.27 crore
OCF covers most of profit but not all of it — working capital keeps absorbing cash. Inventory rose ~₹109 crore and receivables ~₹16 crore during the year, a normal feature of a growing, inventory-heavy chemicals business (inventory days ~271).
Free Cash Flow — The Key Finding
- Capex (PP&E + CWIP): ₹257.19 crore
- Free Cash Flow FY26: –₹130.07 crore
- FCF coverage of dividend: Negative
FCF is deeply negative because capex (₹257 crore) was double the operating cash flow. So the ₹2.02 crore dividend is not funded by free cash flow this year — it is effectively funded from fresh borrowings raised for the expansion.
Perspective on the negative FCF: negative free cash flow here reflects a growth investment cycle, not an inability to generate cash. And the dividend itself is so small (₹2.02 crore) that it is trivially affordable — the company held ₹100+ crore in cash and bank balances, roughly 50 times the annual payout. The forensic point is that on a whole-company basis, every rupee of internally generated cash (and more) is being reinvested; the dividend is being topped up with debt.
Balance Sheet Strength
Debt Position (Consolidated)
- Total Borrowings: ₹527.23 crore
- Cash + Bank Balances: ₹100.39 crore
- Net Debt: ₹426.84 crore
- Net Debt / Equity: 0.40x
- Total Debt / EBITDA: 1.92x
Equity & Returns
- Shareholders' Equity (attributable): ₹1,069 crore
- Book Value: ₹159 per share
- Return on Equity (FY26): 14.3%
- Return on Capital Employed: 16.4%
The debt story: total borrowings jumped from ~₹342 crore to ₹527 crore — a ₹185 crore rise in a single year, driven by long-term loans raised to fund the capex programme. Leverage is still moderate (net debt/equity 0.40x, debt/EBITDA ~1.9x) and comfortably serviced by EBITDA of ₹275 crore, but the direction is worth noting: the company is adding debt while paying a dividend. Returns are solid though decelerating — ROCE has drifted down from ~30% (FY23) to 16.4% as the expanding, not-yet-productive capital base (CWIP up to ₹159 crore) dilutes near-term returns.
Dividend Sustainability Analysis
| Sustainability Test | Metric | Verdict |
|---|---|---|
| Earnings Coverage | EPS ₹21.14 vs DPS ₹0.30 = 70.5x | Very Strong |
| Operating Cash Cover | OCF ₹127 cr vs outflow ₹2.02 cr = 63x | Very Strong |
| Free Cash Flow Cover | FCF –₹130 cr (negative) | Weak (capex-led) |
| Cash / Liquidity Cover | Cash ₹100 cr vs outflow ₹2.02 cr = 50x | Very Strong |
Overall Verdict: Sustainable
Three of four tests are overwhelmingly strong; only free cash flow fails, and it fails purely because of an elective capex cycle, not weak operations. A dividend that consumes just 1.4% of profit and is covered 50 times over by cash on hand is about as safe as an Indian dividend can be. The sustainability question for Vishnu is not "can it pay?" but "will it ever pay meaningfully more?" — and the three-year freeze at ₹0.30 suggests income investors should keep expectations low while the expansion runs.
Peer Comparison
Vishnu Chemicals sits in the specialty chemicals space and is a global leader in chromium and barium chemicals — a niche with few pure listed comparables. As a category, Indian specialty-chemical companies in a growth/capex phase typically run very low dividend yields (often well under 1%), because capital is retained for expansion. Vishnu is a textbook example.
| Metric (Vishnu, FY26) | Value | Read-across |
|---|---|---|
| Dividend Yield | 0.04% | Bottom of sector; growth-mode |
| Dividend Payout | ~1.4% | Very low vs sector |
| ROE / ROCE | 14.3% / 16.4% | Healthy, sector-competitive |
| Net Debt / Equity | 0.40x | Moderate leverage |
| Stock P/E | ~32x | Growth-premium valuation |
Desk note: exact peer-by-peer dividend yields and payout ratios for named specialty-chemical companies were Not Independently Verified for this note and should be confirmed against a live screen before publication. The directional conclusion is robust: on dividend yield, Vishnu ranks near the bottom of its peer set, which is consistent with its capital-allocation choice to reinvest rather than distribute.
Promoter Impact Analysis
Who Gets the Dividend
- Promoter Holding: 69.21% (Jun-2026)
- Total Dividend Outflow: ₹2.02 crore
- Promoter Share of Dividend: ₹1.40 crore
- Public / Institutional Share: ₹0.62 crore
Ownership Mix
- Promoters: 69.21%
- FIIs: 2.51%
- DIIs: 5.94%
- Public: ~22.35%
Interpretation: because promoters own nearly 70%, they receive the lion's share of any dividend — but the total is so small (₹1.40 crore to promoters) that dividends are clearly not the way this family monetises the business. The retain-and-reinvest policy actually keeps capital inside the company for all shareholders. Note that promoter holding has fallen ~5.8 points over three years (from 75% to 69.21%), a trend minority investors should keep watching, as promoter stake changes can signal confidence shifts.
Taxation Analysis
Since April 2020, dividends are taxed in the hands of the investor at their applicable income-tax slab rate (the old Dividend Distribution Tax was abolished). Dividend income is added to "Income from Other Sources."
TDS Rule
A company must deduct TDS at 10% only if total dividend paid to a resident shareholder in a financial year exceeds ₹10,000 (the threshold was raised from ₹5,000 effective FY 2025–26). Given Vishnu's dividend of ₹0.30 per share, you would need to hold over 33,000 shares to cross that limit — so most retail investors will have no TDS deducted.
Worked Example — 1,000 Shares
- Shares held: 1,000
- Dividend @ ₹0.30: ₹300 gross
- TDS (below ₹10,000 limit): ₹0
- Tax @ 30% slab: ₹90
- Net Dividend: ₹210
- Effective post-tax yield @ ₹709: ~0.03%
The tax takeaway is almost academic here: on a ₹300 dividend, a top-slab investor keeps ₹210. The numbers underline the central point — the dividend is symbolic, and tax treatment does not change the investment case in any material way.
Key Risks
- Execution & funding risk on capex: capex of ₹257 crore pushed free cash flow to –₹130 crore and lifted borrowings by ₹185 crore. If new capacity (including CWIP of ₹159 crore) is delayed or under-utilised, returns and cash flow could stay pressured.
- Declining return ratios: ROCE has fallen from ~30% (FY23) to 16.4% as the capital base expands ahead of earnings — a dilution that must reverse once projects ramp up.
- Commodity & input-price exposure: as a chromium/barium chemicals maker, margins are sensitive to raw-material costs (chrome ore, power) and are classified by the company as a single commodity-chemicals segment. Operating margin is thin at ~17%.
- Export & currency risk: nearly 48% of revenue is overseas (₹769 crore), exposing earnings to global demand cycles, foreign-exchange swings and trade/tariff shifts across its 57-country footprint.
- Concentration & regulatory risk: chromium chemicals face environmental scrutiny globally (hexavalent chromium regulation), and heavy reliance on a narrow product family raises single-segment risk.
- Promoter stake dilution trend: promoter holding has slipped from 75% to 69.21% over three years, which minority investors should monitor.
What To Monitor
- Capex-to-cash-flow turnaround: watch for free cash flow to return toward positive as capacity commercialises — the single most important number for whether the dividend can ever rise.
- Official record date & AGM date: confirm the FY26 dividend record date, ex-date and 33rd AGM schedule via the NSE/BSE corporate-action circular before assuming eligibility.
- New growth projects: track execution of the recently announced 50:50 chromium-metal joint venture with DCX Chrome (6,000 TPA plant, Visakhapatnam) — a diversification into higher-value chromium metal.
- Debt trajectory: monitor whether net debt (₹427 crore) stabilises or keeps climbing; check the CARE credit-rating updates for any change in outlook.
- Return ratios: look for ROCE to re-inflect upward once CWIP converts to operating assets — a sustained recovery would validate the reinvestment strategy.
- Payout policy signals: any commentary in concalls or the annual report about lifting the dividend from the three-year ₹0.30 freeze.
Conclusion
Vishnu Chemicals' FY26 final dividend of ₹0.30 per share (15% on face value) is best understood as a reliability signal, not an income stream. The real market yield is about 0.04%, the payout is a mere 1.4% of profit, and earnings cover it 70 times over. The dividend has been frozen at ₹0.30 for three years even as profits grew, and this year it was effectively funded by borrowing because a ₹257 crore capex programme drove free cash flow to –₹130 crore.
Positives
- Consistent, never-cut dividend record
- Strong FY26 growth: revenue +11%, PAT +12%
- Healthy ROE 14.3% / ROCE 16.4%
- Trivially affordable payout (50x cash cover)
- Moderate leverage (net debt/equity 0.40x)
Negatives
- Near-zero real yield (0.04%)
- Dividend frozen 3 years despite profit growth
- Negative FCF; debt up ₹185 crore YoY
- ROCE decelerating from ~30% to 16.4%
- Rising other-income reliance (11.6% of PBT)
Bottom line: this is a growth-and-reinvestment story with a token dividend attached. Income-focused investors will find little here; those interested in the business must weigh the capex-led expansion and its returns. We present the facts — positives, negatives, risks and monitoring points — and leave the decision to you.
Frequently Asked Questions
What dividend has Vishnu Chemicals announced for FY26?
What is the actual dividend yield of Vishnu Chemicals?
What is the record date for the Vishnu Chemicals dividend?
What is the ex-dividend date?
When will the dividend be paid?
Who is eligible to receive this dividend?
How is the Vishnu Chemicals dividend taxed?
Is the Vishnu Chemicals dividend sustainable?
What is Vishnu Chemicals' dividend history?
Why is Vishnu's free cash flow negative if it is profitable?
What should investors monitor going forward?
How much of the dividend goes to promoters?
Disclaimer
This article is for informational and educational purposes only and does not constitute investment advice or any buy, sell or hold recommendation. ShareBazaar Online is not a SEBI-registered investment adviser. Dividend figures are as disclosed by Vishnu Chemicals Limited in its board outcome dated May 30, 2026; market price, yield, financial ratios and shareholding data are sourced from public exchange filings and financial data providers as of 09-Sep-2026 and are subject to change. All yield figures depend on the live market price and must be re-verified. The record date, ex-date, AGM date and payment date were not disclosed by the company and must be confirmed against the official NSE/BSE corporate-action circular. Figures involving computation have been rounded. Readers should consult a qualified financial adviser and verify all data independently before making any investment decision. Investments in securities are subject to market risks.