
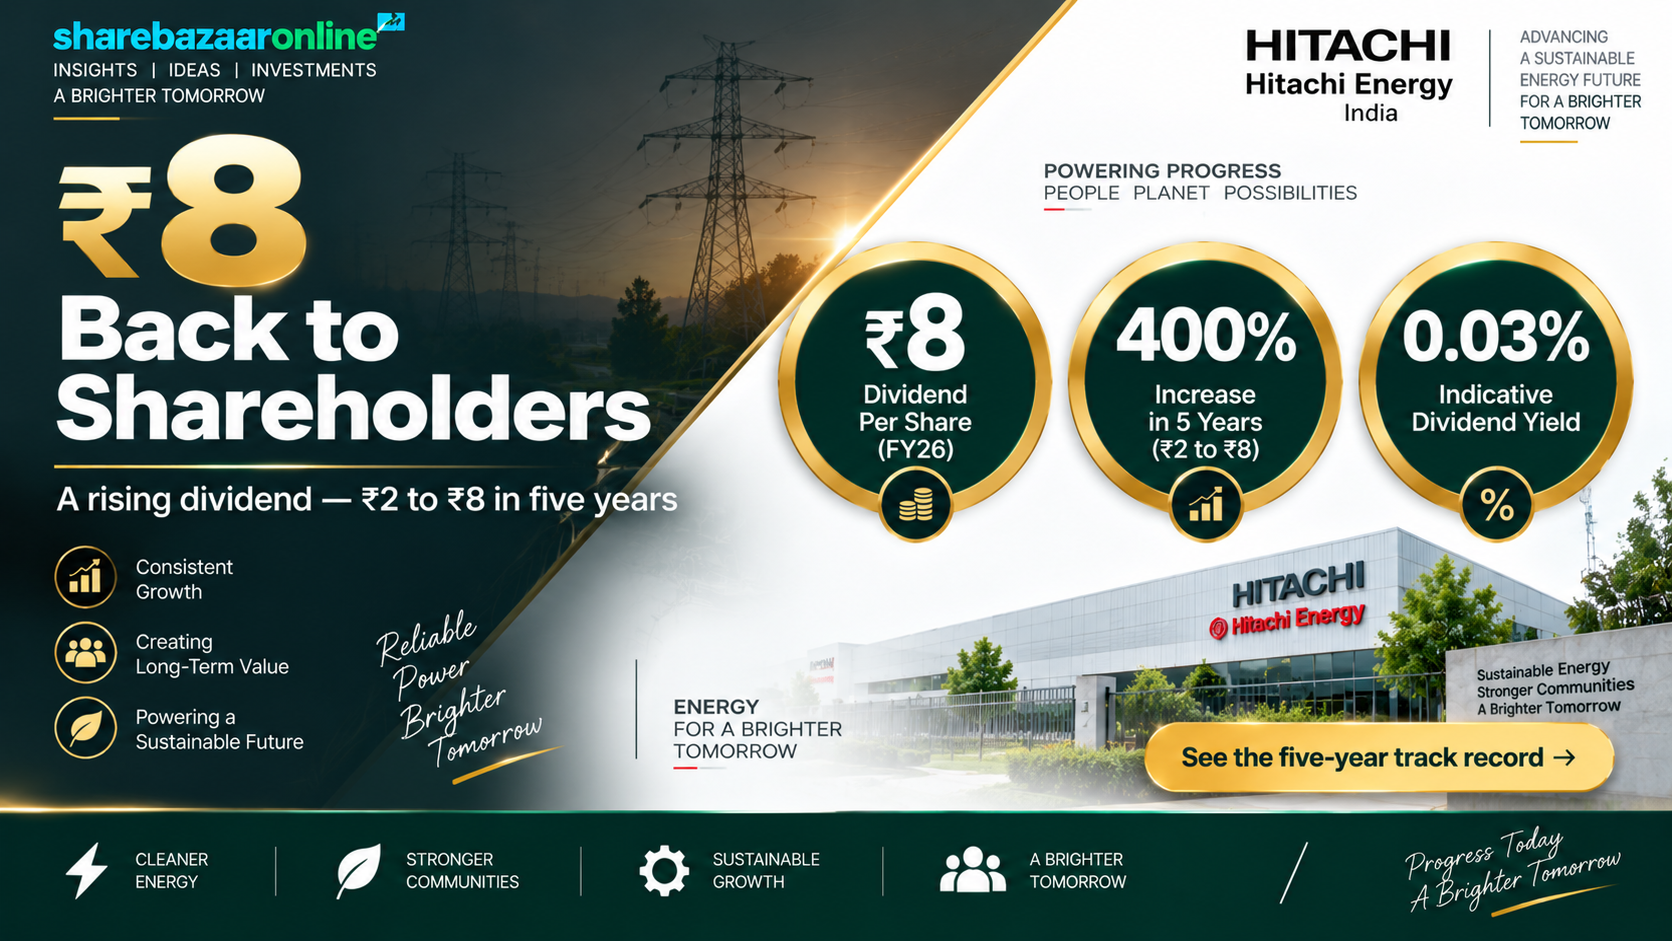
Dividend Snapshot
Hitachi Energy India Limited (NSE: POWERINDIA, BSE: 543187) has recommended a final dividend of ₹8 per equity share for FY2025-26 — a headline 400% dividend on the ₹2 face value. That percentage looks dramatic, but it is calculated on face value, not on the market price. On the current market price of about ₹31,380, the real dividend yield works out to just 0.03%. This is the single most important number for any income-focused reader to internalise before going further.
Dividend Details
Dividend per share: ₹8.00
Dividend rate on face value: 400%
Face value: ₹2 per share
Dividend type: Final Dividend (FY26)
Real yield at market price: ~0.03%
Key Metrics
Total dividend outflow: ~₹35.66 crore
Dividend payout ratio: ~3.6% of profit
Dividend coverage: 27.7x earnings
FY26 net profit: ₹987.84 crore
FY26 EPS: ₹221.63
The one-line takeaway: the dividend is comfortably affordable and consistent with a long track record of rising payouts, but it is a token distribution. The company is choosing to retain almost all of its profit to fund a large capacity-expansion cycle. This is a growth stock that happens to pay a small dividend, not an income stock.
Market price, market capitalisation, yield and ratio benchmarks are sourced from public market data providers (Screener.in, exchange filings) as of 10 September 2026 and move with the share price. Live re-verification is required before publication.
Dividend Announcement Summary
At its board meeting on 25 May 2026, the Board of Directors of Hitachi Energy India recommended a final dividend of ₹8 per equity share (400% of face value ₹2) for the financial year ended 31 March 2026. The recommendation was placed for shareholder approval at the company's Seventh Annual General Meeting (AGM). The AGM was held on 28 August 2026, and the company has confirmed that all resolutions, including the dividend, were passed.
What Was Announced Alongside
The same board meeting cleared a fresh ₹2,000 crore investment in a greenfield large power transformers facility at Karjan, Vadodara (Gujarat). Combined with the capex announced in October 2024, this takes the company's cumulative committed capex to ₹4,000 crore. The scale of this spending is central to understanding why the dividend stays small.
Why It Matters
A ₹35.66 crore dividend sits next to a ₹4,000 crore capex plan and a ₹29,555 crore order backlog. That contrast frames the whole story: the ₹8 payout is a signal of confidence and a nod to shareholders, not a meaningful income stream. The growth reinvestment is the main event.
Key Dates Timeline
All of the dividend eligibility dates for this payout have now passed. The record date and ex-date fell on 21 August 2026, and the AGM approved the dividend on 28 August 2026. Investors reading this after these dates cannot become newly eligible for this particular dividend.
Corporate Action Calendar
Announcement (board meeting): 25 May 2026
Record date: 21 August 2026
Ex-dividend date: 21 August 2026
AGM (dividend approved): 28 August 2026
Payment / dispatch: after 28 August 2026
Reading The Dates
Under India's T+1 settlement, the ex-date and record date coincide. Shareholders on the register as of the close of 21 August 2026 were entitled to the ₹8 per share. Per the company's filing, the dividend is paid or dispatched after the AGM date of 28 August 2026; the statutory outer limit for payment is 30 days from declaration. An exact payment date was not specified as a single calendar day by the company.
Dividend Yield Analysis
This is where a retail reader is most likely to be misled. The "400%" figure is the dividend expressed as a percentage of the ₹2 face value (₹8 ÷ ₹2). It has nothing to do with the return on money you would invest today. The number that matters is the dividend yield on the market price.
Face Value vs Market Price
Headline rate on face value: 400%
Real yield at CMP ₹31,380: 0.0255% (~0.03%)
Yield around announcement (~₹37,000): ~0.02%
In plain terms: invest ₹31,380 to buy one share, and you receive ₹8 in dividend. That is roughly 2.5 paise for every ₹100 invested.
Yield Reality Check
The yield is this low for a benign reason, not a worrying one: the share price has compounded far faster than the dividend. The stock trades near ₹31,380 with a 52-week range of about ₹16,104 to ₹38,800. Even though the dividend has quadrupled from ₹2 to ₹8 over five years, the price has risen much more, so the yield keeps shrinking. This is a "good problem" — a low yield driven by a strong stock, not by a weak dividend.
Bottom line on yield: nobody should buy this stock for dividend income. At ~0.03%, a simple savings account pays many multiples more. The investment case, if any, rests entirely on capital appreciation and earnings growth — not on the payout.
Dividend History Analysis
Despite the tiny yield, the dividend track record is genuinely consistent and rising. Since the entity began paying dividends, the per-share amount has increased every single year without a cut or a skip. The company transitioned its financial year from December to March around 2022, which is why one period below is a 15-month year.
Dividend Per Share — Last Six Years
| Financial Year | Dividend / Share | Change | Type |
|---|---|---|---|
| FY21 (Dec-2020 yr) | ₹2.00 | — | Final |
| FY22 (15-month) | ₹3.00 | +50.0% | Final |
| FY23 | ₹3.40 | +13.3% | Final |
| FY24 | ₹4.00 | +17.6% | Final |
| FY25 | ₹6.00 | +50.0% | Final |
| FY26 | ₹8.00 | +33.3% | Final |
Dividend history compiled from public dividend-history providers (TipRanks, INDmoney, exchange corporate-action records). Desk verification against NSE/BSE circulars recommended.
Consistency Verdict
The dividend has grown from ₹2 to ₹8 in five years, a compound growth of about 32% per year. There are no cuts, no suspensions and only annual (not special) dividends. On the pattern of payments alone, this qualifies as a Consistent Payer with a rising trend.
The Catch
Rising rupee dividends are welcome, but the payout ratio has actually fallen — from about 15% of profit in FY23 to roughly 3.6% in FY26. Profits are growing much faster than the dividend, so shareholders are receiving a shrinking slice of a rapidly growing pie. That is a deliberate capital-allocation choice, discussed later.
Financial Performance Analysis
FY26 was an exceptional year on the surface. Because the company has no subsidiaries, associates or joint ventures (as confirmed in its results), its standalone numbers are effectively its consolidated numbers — there is no holding-company drag or minority-interest complication to untangle.
FY26 vs FY25 (₹ crore)
| Metric | FY26 | FY25 | Growth |
|---|---|---|---|
| Revenue from operations | 8,147.71 | 6,384.93 | +27.6% |
| Operating EBITDA | 1,252.6 | 592.3 | +111.5% |
| Profit before tax | 1,320.92 | 516.39 | +155.8% |
| Net profit (PAT) | 987.84 | 383.98 | +157.3% |
| EPS (₹) | 221.63 | 90.36 | +145.3% |
Operating Leverage — The Good News
This is a textbook case of positive operating leverage. Revenue rose 27.6%, but operating EBITDA more than doubled at +111.5%, and the operating margin jumped from about 9.3% to 15.4%. Better project execution and pricing meant costs grew far slower than sales — profit growth vastly outran revenue growth. That is exactly what investors want to see.
Earnings Quality — Read The Fine Print
Two nuances temper the headline 157% PAT jump. First, it is flattered by a low FY25 base (that year carried heavy margin pressure). Second, other income of ₹239.92 crore — about 18% of PBT, and almost entirely interest income of ₹238.64 crore earned on a large cash pile — is a real but lower-quality, non-operating contributor. Working the other way, a one-time ₹54.24 crore Labour Codes charge actually depressed FY26 profit; excluding it, profit would have been higher still.
Cash Flow Analysis
Reported profit is an accounting opinion; cash is a fact. Here the two line up well. FY26 operating cash flow was strong, and even after a heavy investment year the company generated healthy free cash flow — many multiples of what the dividend costs.
Cash Generation (FY26, ₹ crore)
Operating cash flow (OCF): 1,244.83
Capex (PPE + intangibles): ~509.83
Free cash flow (FCF): ~735.00
Dividend outflow: ~35.66
Dividend as % of FCF: ~4.9%
Profit vs Cash Check
OCF of ₹1,245 crore against PAT of ₹988 crore gives a cash-conversion of over 125% — profit is backed by real cash, not just receivables. Note that FY26 OCF was slightly lower than FY25's ₹1,494 crore, largely because receivables and inventory rose as the order book scaled up. That is normal for a fast-growing project business, but working capital is worth watching.
How is the dividend funded? Entirely from current-year free cash flow. The ₹35.66 crore payout consumes under 5% of FCF and well under 1% of the company's cash balance. There is no reliance on borrowings or asset sales — the company is, in effect, almost debt-free.
Balance Sheet Strength
The balance sheet is the strongest part of the story and the clearest explanation for the small dividend. The company is sitting on a very large cash reserve, much of it raised through a Qualified Institutional Placement (QIP) and earmarked for growth.
Key Balance Sheet Items (31 Mar 2026, ₹ crore)
Cash & bank balances: ~4,689
Total equity: 5,175.96
Borrowings (mostly lease liabilities): ~86
Total assets: 12,043.72
Book value per share: ~₹1,161
Net Cash, Not Net Debt
With about ₹4,689 crore of cash and only ~₹86 crore of lease-related liabilities, the company is in a large net-cash position. Crucially, of the QIP proceeds, ₹2,006.48 crore remained unutilised at year-end, of which ₹1,870 crore was parked in bank deposits. That idle cash is what generates the ₹239 crore of interest income flagged earlier — and it is why the dividend is trivially affordable.
Return Ratios
Return on capital employed (ROCE) is around 29.4% and return on equity (ROE) around 21.9% — both healthy. Note, though, that the large idle cash balance and the recent QIP dilution slightly depress the reported ROE versus the underlying operating business, because a big chunk of equity is currently sitting in low-return bank deposits awaiting deployment into the ₹4,000 crore capex programme.
Dividend Sustainability Analysis
On every affordability test, this dividend is over-covered many times. The only "risk" to the dividend is not that it becomes unaffordable, but that management chooses to keep it small while it invests for growth.
Four-Test Coverage Scorecard
Earnings coverage (EPS ÷ DPS): 27.7x
Operating cash flow coverage: ~34.9x
Free cash flow coverage: ~20.6x
Cash & bank coverage: ~131.5x
Verdict: Sustainable
The payout is classified as Sustainable. It absorbs under 4% of profit and under 5% of free cash flow, is fully funded from current earnings, and is backed by a net-cash balance sheet. There is enormous headroom to raise the dividend if management ever chose to — the constraint is strategy, not capacity.
Peer Comparison
Low dividend yields are the norm across India's listed power transmission and electrical-equipment names — these are growth-and-capex companies, not income plays. Even against that backdrop, Hitachi Energy India sits at the bottom of the yield table.
Yield & Return Profile vs Peers
| Company | Div. Yield | Payout | ROE | ROCE |
|---|---|---|---|---|
| Hitachi Energy India | ~0.03% | ~3.6% | ~21.9% | ~29.4% |
| GE Vernova T&D India | ~0.21% | ~21% | High | High |
| Siemens Ltd | ~0.46% | ~19% | ~15.6% | ~21.4% |
| ABB India | ~0.5% | Modest | High | ~27% |
Peer figures are approximate, drawn from public market-data providers as of early-mid September 2026, and vary with price. The sector/electrical-industry average dividend yield is roughly 0.4%. Desk re-verification recommended before publication.
What the table shows: Hitachi Energy India's yield (~0.03%) is roughly one-tenth of even the modest sector average (~0.4%) and well below GE Vernova T&D, Siemens and ABB India. Its ROCE of ~29%, however, is at or near the top of the group. The read-through: this is one of the most efficient operators in the space, but the one that returns the least to shareholders as cash — because it is reinvesting the most.
Promoter Impact Analysis
The promoter is the global Hitachi Energy group (Hitachi Ltd, Japan, holds 100% of Hitachi Energy Ltd, which in turn holds the stake in the Indian entity). Promoter holding stood at 71.31% as of the latest shareholding data, having come down from 75% after the March-2025 QIP.
Who Gets The ₹35.66 Crore
Promoter share of the dividend (71.31%): ~₹25.43 crore
Public + institutional share (28.69%): ~₹10.23 crore
The majority of the dividend flows to the parent group, as expected for a majority-owned multinational subsidiary.
Alignment, Not Extraction
Importantly, this is not a case of a cash-hungry promoter draining the company through dividends. The payout ratio is only ~3.6%, and the promoter is forgoing far larger potential distributions so the company can fund its ₹4,000 crore capex. Interests are aligned around growth. Minority shareholders benefit from the same reinvestment, even if their cash cheque is small.
Capital Allocation Question
With ~₹4,689 crore of cash and ₹2,006 crore of QIP money still unutilised, a fair question is whether the company is hoarding cash. The counter-argument is the ₹4,000 crore committed capex and a record ₹29,555 crore order backlog that this capacity will serve. The company could have paid a larger dividend or bought back stock; it has chosen to retain and reinvest. Whether that idle cash is deployed at high returns is the key thing to monitor.
Taxation Analysis
Since April 2020, dividends in India are taxed in the hands of the shareholder, not the company. The dividend is added to your total income and taxed at your applicable income-tax slab rate. There is no separate lower rate for dividends.
TDS Rule
The company deducts TDS at 10% if your total dividend from that company in a financial year exceeds ₹5,000 (for resident individuals with a valid PAN; 20% without PAN). This TDS is only an advance tax — you adjust it against your final liability when filing your return.
Worked Example (30% slab)
Holding: 1,000 shares × ₹8 = ₹8,000 gross dividend
TDS at 10% (above ₹5,000): ₹800 deducted upfront
Total tax at 30% slab: ₹2,400
Net in hand after tax: ₹5,600
Effective post-tax yield at ₹31,380/share: ~0.018%
Practical note: to receive ₹8,000 gross you would need to invest about ₹3.14 crore in the stock at current prices. For most retail investors the dividend is too small to have any meaningful tax consequence. Tax treatment differs for NRIs and non-individual holders; consult a tax adviser for your specific situation.
Key Risks
These are business and valuation risks relevant to the stock as a whole, since the dividend itself is not at risk of being cut.
1. Rich Valuation
The stock trades at a P/E of roughly 117x and about 27x book value. That leaves very little room for disappointment; any slowdown in order execution or margins could de-rate the price sharply. The near-zero yield offers no downside cushion.
2. Capex Execution Risk
The ₹4,000 crore capex (including the new Karjan transformer plant) must be built on time, on budget, and then filled with profitable orders. Large greenfield projects carry delay and cost-overrun risk, and returns take years to materialise.
3. Working Capital & Cash Drag
Receivables and inventory rose in FY26, and OCF dipped year-on-year. Meanwhile a large slice of equity sits idle in bank deposits, diluting returns until it is deployed. Poor working-capital discipline or slow capex deployment would hurt reported ROE.
4. Input Cost & Geopolitical Pressure
Management itself flagged crude-oil-linked cost pressure and geopolitical supply-chain disruption. As an equipment and project company with imported inputs, margins are exposed to commodity and currency swings.
5. Related-Party & Parent Dependence
The company recently sought shareholder approval (via postal ballot) for material related-party transactions with Hitachi Energy group entities. Heavy reliance on the parent for technology and cross-border transactions is a governance area minority shareholders should track.
6. Not An Income Stock
A specific risk for the wrong buyer: anyone purchasing this share expecting dividend income will be disappointed. At ~0.03% yield, the payout is immaterial to total return.
What To Monitor
Forward-Looking Checklist
1. Capex deployment: how quickly the ₹2,006 crore of unutilised QIP cash and the ₹4,000 crore capex are put to work, and at what returns.
2. Order backlog conversion: whether the record ₹29,555 crore backlog translates into revenue and margins on schedule.
3. Operating margin durability: whether the jump to a ~15.4% operating EBITDA margin holds or was partly cyclical.
4. Working capital & cash flow: receivable and inventory days, and whether OCF re-accelerates toward FY25 levels.
5. Payout policy & ROE: any shift toward a higher payout or buyback once capex peaks, and the trend in ROE as idle cash is deployed.
Conclusion
Hitachi Energy India's ₹8 final dividend is a story of two very different numbers. The "400%" headline is technically accurate but practically meaningless — it is a percentage of a ₹2 face value. The number that matters, the yield on the market price, is about 0.03%.
The Positives
A consistently rising dividend (₹2 to ₹8 in five years), a fortress net-cash balance sheet, sector-leading ROCE of ~29%, explosive FY26 profit growth on genuine operating leverage, and a dividend covered nearly 28x by earnings. The payout is unambiguously sustainable.
The Negatives
A near-zero yield offering no income, a very rich valuation (~117x earnings) that leaves no margin for error, a shrinking payout ratio, a chunk of profit coming from interest on idle cash, and meaningful capex-execution and related-party considerations.
Read as an income decision, this dividend is irrelevant. Read as a signal, it says management is confident enough to keep raising the payout while pouring the bulk of profits back into a multi-year growth cycle. Whether that reinvestment earns strong returns — not the ₹8 cheque — is what will decide shareholder outcomes. We present the positives, negatives, risks and monitoring points; the decision is yours.
Frequently Asked Questions
What dividend has Hitachi Energy India announced for FY26?
What is the actual dividend yield?
What was the record date for the dividend?
What was the ex-dividend date?
When is the dividend paid?
Who was eligible for this dividend?
How is this dividend taxed?
Is the dividend sustainable?
What is Hitachi Energy India's dividend history?
Why is the dividend so small if profits jumped 157%?
How does the yield compare with peers?
What should investors monitor going forward?
Disclaimer
This article is for informational and educational purposes only and does not constitute investment, financial, legal or tax advice, nor a recommendation to buy, sell or hold any security. ShareBazaar Online is not a SEBI-registered investment adviser or research analyst. Figures relating to the dividend, financial year results and corporate-action dates are drawn from Hitachi Energy India Limited's own exchange filing dated 25 May 2026; market price, market capitalisation, yield, ratio and peer figures are sourced from third-party public data providers as of the dates stated and change continuously with the market. Dividend yield, valuation and coverage figures are price-dependent and should be re-verified against live data before any decision. Readers must conduct their own due diligence and consult a qualified, registered financial adviser before making any investment decision. Past performance and past dividend trends are not indicative of future results. ShareBazaar Online accepts no liability for any loss arising from the use of this information.