
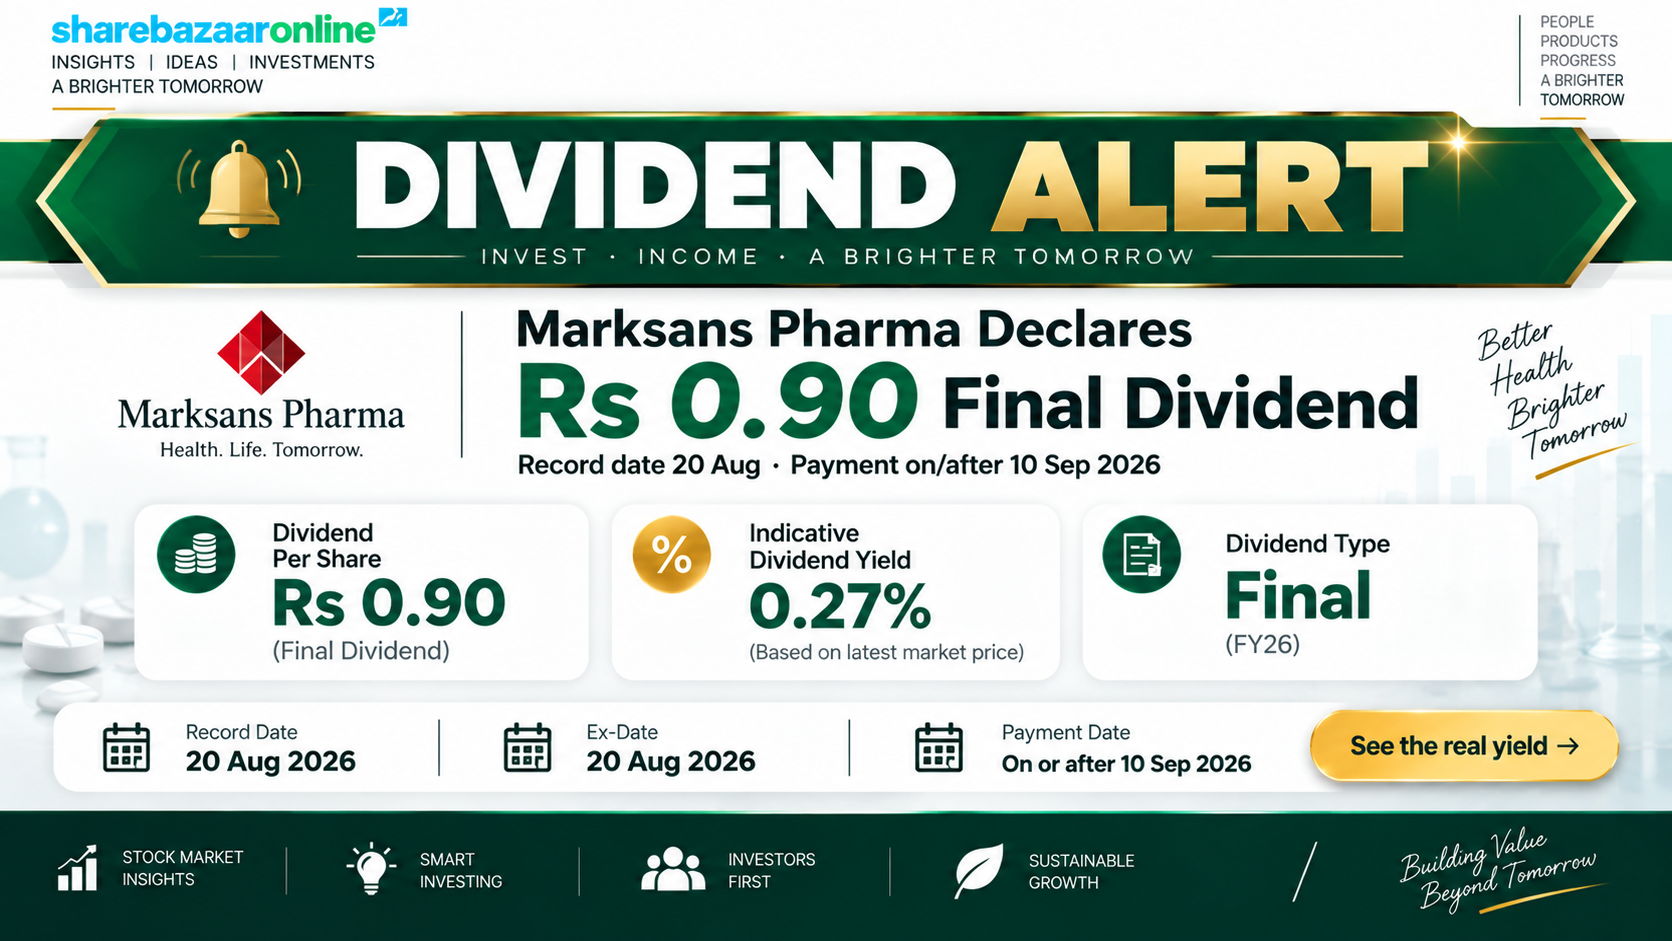
Dividend Snapshot
Marksans Pharma Limited (NSE: MARKSANS · BSE: 524404 · ISIN: INE750C01026) has declared a final dividend of ₹0.90 per equity share for the financial year 2025-26. Because the face value of the share is only Re 1, the company describes this as a 90% dividend. That headline "90%" is calculated on face value, not on the market price — so it does not mean investors earn 90% on their money. Measured against the current market price of about ₹330, the real dividend yield is only about 0.27%.
| Company | Marksans Pharma Ltd |
| Dividend Type | Final Dividend |
| Dividend per Share | ₹0.90 |
| Dividend % (on face value) | 90% |
| Face Value | ₹1 |
| Financial Year | FY2025-26 |
| Real Dividend Yield (at ₹330) | ~0.27% |
| Announcement-Day Yield | ~0.35% |
| Total Dividend Outflow | ₹40.78 crore |
| Dividend Payout (Consolidated) | 9.8% |
| Reporting Basis | Consolidated |
| AGM Approval | Approved (27 Aug 2026) |
The one-line takeaway: This is a small, comfortably affordable dividend from a debt-light, cash-rich generics company. The payout is highly secure, but the income yield is tiny — Marksans is a growth-and-capital-appreciation story, not an income stock. Numbers marked "Not Disclosed by Company" or "NIV" (not independently verified) are flagged as such rather than estimated.
Dividend Announcement Summary
At its board meeting on 26 May 2026, the Board of Directors of Marksans Pharma recommended a final dividend of ₹0.90 per equity share of face value Re 1 (90%) for FY2025-26. The recommendation was made alongside the audited standalone and consolidated results for the quarter and year ended 31 March 2026, on which the statutory auditors (MSKA & Associates LLP) issued an unmodified (clean) opinion.
What the filing said
The dividend was recommended by the Board and was stated to be payable only if approved by shareholders at the Annual General Meeting (AGM), with credit/dispatch within 30 days of the AGM. This is the standard route for a final dividend (unlike an interim dividend, which the Board can pay directly).
What has happened since
The company's 34th AGM was held on 27 August 2026 and shareholders approved the ₹0.90 final dividend (source: BSE AGM voting-results filing dated 27 Aug 2026). The dividend therefore stands confirmed, with payment on or after 10 September 2026.
Context that the wire reports skip: the ₹0.90 dividend is a 12.5% increase over last year's ₹0.80, continuing an unbroken run of rising dividends. But the increase in the rupee amount is far smaller than the growth in the company's cash pile and profits — the payout ratio has stayed pinned at roughly 10%.
Key Dates Timeline
| Event | Date | Status |
|---|---|---|
| Board Meeting / Dividend Recommendation | 26 May 2026 | Completed |
| Record Date | 20 Aug 2026 | Completed |
| Ex-Dividend Date (inferred, T+1) | 20 Aug 2026 | Completed |
| Annual General Meeting (AGM) | 27 Aug 2026 | Approved |
| Payment / Credit Date | On or after 10 Sep 2026 | As per company |
The record date is the cut-off used to decide who is eligible to receive the dividend. The ex-date is the first day the share trades without the right to the dividend — under India's T+1 settlement, the ex-date and record date now typically coincide. The ex-date shown here is inferred on that convention and should be confirmed against the official NSE/BSE corporate-action circular. Because the record date has already passed, eligibility for this dividend is now fixed.
Dividend Yield Analysis
The "90%" number is a face-value illusion
Indian companies quote dividends as a percentage of face value. Marksans has a face value of Re 1, so ₹0.90 works out to a "90% dividend." That figure tells you nothing about the return on your investment. The number that matters is the dividend yield, which divides the dividend by the actual share price.
| Yield Measure | Value |
|---|---|
| Headline "yield" on face value | 90.00% |
| Yield at announcement (₹254.79, 26 May) | 0.35% |
| Yield around record date (~₹333) | 0.27% |
| Yield at current price (₹330) | 0.27% |
Why the yield is so low
The yield is low for a healthy reason, not a worrying one. The share price has roughly doubled over the past year (up ~87% per Screener), so even though the dividend rose 12.5%, the price rose far faster and pushed the yield down. This is the opposite of a "value trap," where a high yield is caused by a collapsing price.
For perspective, the Indian pharmaceuticals sector average dividend yield is around 0.8% (Simply Wall St). At ~0.27%, Marksans yields roughly a third of the sector average — a clear signal that management prioritises reinvestment and acquisitions over cash returns.
Dividend History Analysis
| Financial Year | Dividend / Share | Payout Ratio |
|---|---|---|
| FY2016-17 | ₹0.05 | 23% |
| FY2017-18 | ₹0.05 | 6% |
| FY2018-19 | ₹0.05 | 3% |
| FY2019-20 | ₹0.10 | 3% |
| FY2020-21 | ₹0.25 | 4% |
| FY2021-22 | ₹0.25 | 6% |
| FY2022-23 | ₹0.50 | 9% |
| FY2023-24 | ₹0.60 | 9% |
| FY2024-25 | ₹0.80 | 10% |
| FY2025-26 | ₹0.90 | 10% |
Per-share figures from exchange/dividend-history sources (TipRanks); payout ratios from Screener.in consolidated data. No bonus or split has occurred since 2008, so no Ind AS 33 restatement is required for this window.
Verdict: Consistent & Growing Payer
The dividend has been paid every year and has risen from ₹0.05 to ₹0.90 over the last decade — roughly an 18x increase, and eight straight years of growth. There have been no cuts and no suspensions in this window.
The catch: growth has slowed
The dividend was doubling every couple of years until FY23. Since then the increases have shrunk (₹0.60 → ₹0.80 → ₹0.90), and the payout ratio has flat-lined near 10%. Profit is growing much faster than the dividend.
Financial Performance Analysis
| Metric (Consolidated, ₹ crore) | FY25 | FY26 | Growth |
|---|---|---|---|
| Revenue from Operations | 2,622.85 | 2,950.94 | +12.5% |
| Total Income | 2,689.17 | 3,033.47 | +12.8% |
| EBITDA (derived) | 532.68 | 600.78 | +12.8% |
| Operating Margin (OPM) | 20.3% | 20.4% | +5 bps |
| Profit Before Tax | 503.97 | 560.56 | +11.2% |
| Net Profit (owners) | 380.58 | 417.90 | +9.8% |
| EPS | ₹8.40 | ₹9.22 | +9.8% |
Operating leverage: revenue and profit moved together
Revenue, EBITDA and total income all grew at almost exactly the same pace (~12.5–12.8%), and the operating margin held steady near 20%. That is a sign of a stable, well-controlled cost base — there was no margin compression or cost blow-out this year. Net profit grew slightly slower (+9.8%) than EBITDA, mainly because finance costs more than doubled (₹11.7 cr to ₹24.1 cr) as the company drew on working-capital funding, and depreciation rose with its expanding asset base.
Standalone vs consolidated
Marksans earns most of its money abroad through subsidiaries in the US, UK/Europe and Australia. Standalone FY26 net profit was ₹300.70 cr (EPS ₹6.64) versus consolidated ₹417.90 cr (EPS ₹9.22). We use the consolidated basis for yield and payout, as it captures the whole group.
Quality-of-profit check
Reported profit was helped by ₹82.5 cr of "other income," which includes a net foreign-exchange gain of ~₹50 cr and interest income. A deferred-tax credit of ~₹12.5 cr also trimmed the tax charge. These are real but partly non-operating — strip them out and the core business still grew in double digits.
Cash Flow Analysis
Reported profit is an accounting opinion; cash is a fact. A dividend can only be paid out of cash. So the key question is: does the business actually generate the cash it reports as profit? For Marksans in FY26, the answer is a clear yes.
| Cash Flow (Consolidated) | FY26 (₹ cr) |
|---|---|
| Operating Cash Flow (OCF) | 458.13 |
| Capital Expenditure | (130.53) |
| Free Cash Flow (FCF) | 327.60 |
| Dividend Paid in FY26 (prior yr ₹0.80) | 36.25 |
| Net Profit (total) | 420.06 |
Cash conversion is strong
Operating cash flow of ₹458 cr was 1.09x the reported net profit of ₹420 cr — the business converts more than 100% of its accounting profit into cash. OCF also more than doubled from ₹207 cr in FY25, a big improvement in working-capital discipline.
How the dividend is funded
The ₹40.78 cr dividend is funded entirely from current-year earnings and free cash flow. It is not being paid from cash reserves, asset sales or borrowings. Free cash flow of ₹328 cr covers the payout roughly 8 times over. One watch-point: inventory days have crept up to ~278 and the cash-conversion cycle to ~261 days (Screener), typical of a generics exporter building stock for regulated markets — worth monitoring but not a dividend risk today.
Balance Sheet Strength
| Item (Consolidated, FY26) | ₹ crore |
|---|---|
| Cash & Cash Equivalents | 644.57 |
| Other Bank Balances | 634.14 |
| Total Cash & Bank | 1,278.70 |
| Borrowings (current) | 29.59 |
| Net Cash (ex-lease) | 1,249.11 |
| Lease Liabilities | 313.79 |
| Total Equity | 3,052.68 |
Effectively debt-free and cash-rich
Marksans holds about ₹1,279 cr in cash and bank balances against just ₹30 cr of borrowings, leaving net cash of ~₹1,249 cr. Screener classifies the company as "almost debt free." Book value is around ₹66.7 per share, return on equity ~15.2% and return on capital employed ~18.8% (Screener). Against this fortress balance sheet, a ₹41 cr dividend is a rounding error.
Dividend Sustainability Analysis
| Coverage Test | Result | Read |
|---|---|---|
| 1. Earnings coverage (EPS ÷ DPS) | 10.24x | Very strong |
| 2. Operating cash flow coverage | 11.23x | Very strong |
| 3. Free cash flow coverage | 8.03x | Strong |
| 4. Cash & liquidity coverage | 31.35x | Fortress |
Composite verdict: Highly Sustainable
The dividend passes all four tests comfortably. Earnings cover it 10x, operating cash flow 11x, free cash flow 8x, and total cash more than 31x. Earnings are growing, debt is negligible and cash is rising. The only realistic "risk" to this dividend is that management chooses to keep it small on purpose — the constraint is willingness to pay, not ability to pay.
Peer Comparison
| Company | Div Yield | Payout | ROE | ROCE |
|---|---|---|---|---|
| Marksans Pharma | ~0.27% | ~10% | 15.2% | 18.8% |
| Ajanta Pharma | ~1.0% | ~36% | — | — |
| Eris Lifesciences | ~0.53% | — | — | — |
| JB Chemicals* | ~1.07% | ~40% | — | — |
| Pharma sector average | ~0.8% | — | — | — |
Cells marked "—" are intentionally left blank rather than filled with unverified figures. *JB Chemicals was merged into Torrent Pharmaceuticals effective 8 July 2026 and is no longer separately listed; its data is shown for historical dividend-policy context only. Sources: Screener.in, Simply Wall St, INDmoney, Equitymaster.
Marksans stands out for its low payout ratio. Established formulation peers such as Ajanta Pharma and JB Chemicals return 35–40% of profits as dividends and yield around 1%. Marksans returns only ~10% and yields a third of the sector average. On returns, however, Marksans holds its own with ROE ~15% and ROCE ~19%. The message: Marksans is choosing growth and cash accumulation over shareholder distributions.
Promoter Impact Analysis
| Holder (Jun 2026) | Stake | Share of ₹40.78 cr |
|---|---|---|
| Promoter & Group | 43.87% | ₹17.89 cr |
| FIIs | 17.47% | ₹7.13 cr |
| DIIs | 6.19% | ₹2.52 cr |
| Public & Others | 32.46% | ₹13.24 cr |
Who benefits
Of the ₹40.78 cr dividend, roughly ₹17.89 cr flows to the promoter group (the Saldanha family, 43.87%). Retail and other public shareholders receive about ₹13.24 cr. Because the payout ratio is low, the promoter is clearly not using the dividend to strip cash out — the family is leaving the overwhelming majority of profit inside the company, which aligns their interests with minority holders who are betting on growth.
Taxation Analysis
How dividends are taxed in India
Since April 2020, dividends are taxed in the hands of the investor at their applicable income-tax slab rate (the company no longer pays Dividend Distribution Tax). The company deducts TDS of 10% under Section 194 only if the total dividend paid to a resident shareholder by that company exceeds ₹10,000 in a financial year (this threshold was raised from ₹5,000 in the 2025 Budget). If your PAN is not linked, TDS is 20%.
Worked example: 1,000 shares
| Shares held | 1,000 |
| Dividend per share | ₹0.90 |
| Gross dividend | ₹900 |
| TDS (below ₹10,000 limit) | ₹0 |
| Tax @ 30% slab + 4% cess | ₹280.80 |
| Net in hand (after tax) | ₹619.20 |
Effective yield after tax
For a top-slab (30%) investor, the ₹900 gross dividend becomes ₹619 after tax. On a ₹3.3 lakh investment (1,000 shares at ₹330), that is a net yield of just 0.19%, versus a gross yield of 0.27%. Even before tax this is a token income; after tax it is negligible. Investors in lower slabs keep proportionately more, and no TDS applies here because the payout is well under the ₹10,000 threshold.
Key Risks
- Income-investor mismatch: at ~0.27% yield (about a third of the pharma sector's ~0.8%), Marksans offers almost no dividend income. Anyone buying for regular cash flow will be disappointed.
- Payout policy is deliberately low: the ~10% payout ratio has not moved in three years despite surging cash. There is no stated dividend policy committing management to raise it, so the dividend may stay token even as profits grow.
- US/regulated-market dependence: most revenue comes from the US, UK/Europe and Australia. USFDA inspections, price erosion in US generics, and product recalls can hit profits — and therefore the pool from which dividends are paid.
- Currency exposure: a meaningful slice of "other income" is foreign-exchange gains (~₹50 cr in FY26). A reversal of the rupee's movement could reduce reported profit even if the underlying business is unchanged.
- Working-capital build-up: inventory days (~278) and the cash-conversion cycle (~261 days) have risen. If cash gets increasingly tied up in stock and receivables, free cash flow — and dividend headroom — could tighten in future years.
- Acquisition-led strategy: management is actively acquiring companies (ABCnow GmbH, QliniQ B.V., new Ireland/Canada subsidiaries). Capital directed to M&A is capital not returned as dividends, and integration carries execution risk.
What To Monitor
- Payout ratio trend: watch whether management lifts the payout above ~10% or announces a formal dividend/capital-return policy. That would be the single biggest signal for income-focused investors.
- Free cash flow direction: FY26 FCF jumped to ₹328 cr. Track whether this holds as capex and acquisitions scale up — sustained FCF is what underwrites future dividend growth.
- Working-capital cycle: monitor inventory and debtor days each quarter; a further rise would signal cash being trapped in the balance sheet.
- USFDA / regulatory status: follow inspection outcomes (EIR, VAI, warning letters) at Marksans and its subsidiaries' facilities, as these directly affect the US business.
- Acquisition returns: assess whether recent buys (ABCnow, QliniQ) and new geographies add to profit and cash, or dilute returns.
- Margin trajectory: the ~20% operating margin is the anchor of profitability — watch for raw-material, freight or employee-cost pressure that could compress it.
Conclusion
Positives
- Dividend raised 12.5% to ₹0.90; eighth straight year of growth
- Passes all four sustainability tests (earnings 10x, OCF 11x, FCF 8x, cash 31x)
- Net cash of ~₹1,249 cr; effectively debt-free
- Strong cash conversion (OCF 1.09x profit) and ~20% operating margin
- Low payout means promoter is reinvesting, not extracting cash
Negatives
- Real yield only ~0.27% — the "90%" is a face-value illusion
- Yield is a third of the pharma sector average (~0.8%)
- Payout ratio stuck near 10% for three years
- After tax, a top-slab investor's yield is ~0.19%
- Earnings and cash depend on US/regulated markets and forex
Marksans Pharma's FY26 dividend is best understood as a small, symbolic, and extremely safe distribution from a fast-growing, cash-rich generics company. The dividend's safety is not in question — but its size is deliberately modest, and the yield is negligible. This is a business geared toward capital appreciation and reinvestment, not dividend income. Whether that suits you depends entirely on your own goals; the facts, positives, negatives and risks are laid out above for you to decide.
Frequently Asked Questions
What dividend has Marksans Pharma announced for FY2025-26?
What is the actual dividend yield on Marksans Pharma?
What was the record date for the Marksans Pharma dividend?
What is the ex-dividend date?
When will the Marksans Pharma dividend be paid?
Who is eligible to receive this dividend?
How is the Marksans Pharma dividend taxed?
Is the Marksans Pharma dividend sustainable?
What is Marksans Pharma's dividend history?
Why is the dividend yield so low if the company is doing well?
How much of the dividend goes to the promoter?
Should I analyse Marksans on a standalone or consolidated basis?
What should investors monitor going forward?
Disclaimer
This article is for informational and educational purposes only and does not constitute investment, financial, legal or tax advice, nor a recommendation to buy, sell or hold any security. ShareBazaar Online is not a SEBI-registered investment adviser or research analyst. Dividend amounts, dates and financial figures are based on the company's stock-exchange filings and third-party data sources believed to be reliable as of publication; figures may be revised, and all price-dependent numbers (such as dividend yield) change with the market price. Investors must independently verify all figures, including the live market price, record date and ex-date, against official NSE/BSE circulars and the company's filings before making any decision. Investments in securities are subject to market risks; past performance and past dividends are not indicative of future results. Please consult a SEBI-registered adviser and a qualified tax professional for guidance specific to your situation.