
Dividend Snapshot
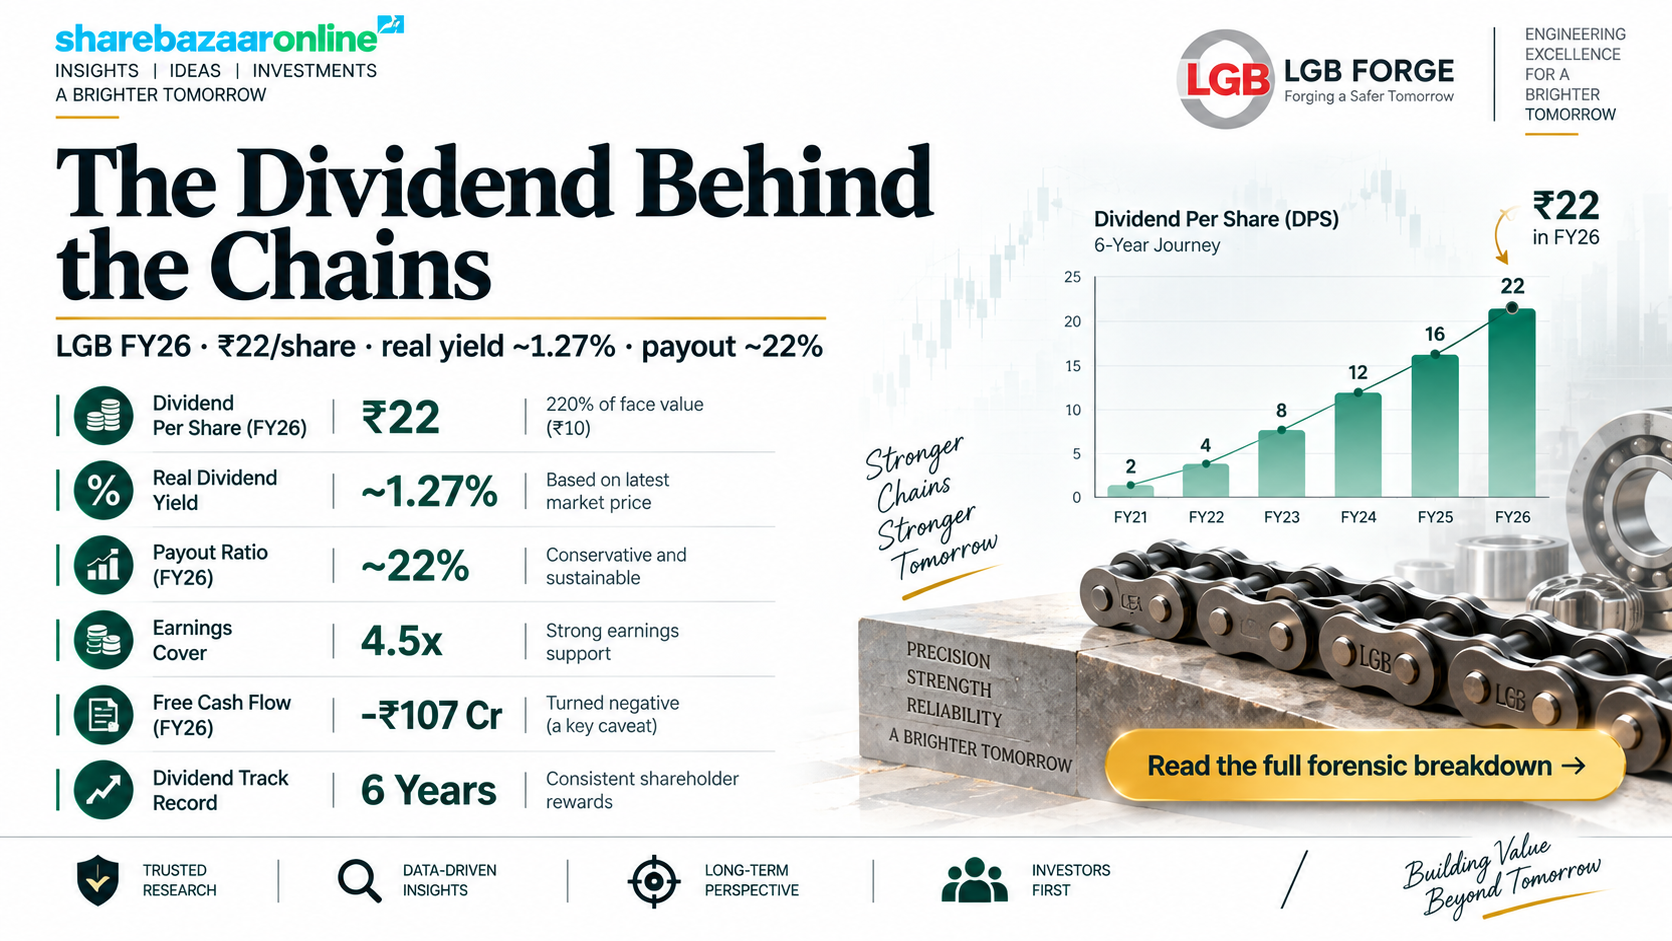
L.G. Balakrishnan & Bros Limited (NSE: LGBBROSLTD, BSE: 500250), the Coimbatore-based maker of chains, sprockets and metal-formed auto components sold under the Rolon brand, has declared a final dividend of ₹22 per equity share for the financial year ended 31 March 2026. On the ₹10 face value, that headline reads 220% — but the number that actually matters to an investor is the real yield on the market price, which works out to only about 1.27%.
Dividend At A Glance
| Dividend per share | ₹22.00 |
| Dividend on face value | 220% |
| Face value | ₹10 |
| Dividend type | Final |
| Real yield (on market price) | ~1.27% |
| Financial year | FY 2025–26 |
Key Numbers (Consolidated FY26)
| Revenue from operations | ₹3,075.63 cr |
| Net profit (PAT) | ₹318.74 cr |
| EPS | ₹99.95 |
| Total dividend outflow | ₹70.16 cr |
| Dividend payout ratio | ~22% |
| Net cash position | ~₹79.6 cr net cash |
Market price, market cap and yield figures are sourced from public market data (NSE/BSE, Screener) as on 10 September 2026 and are price-dependent; all financials are from the company’s audited results filed on 2 May 2026.
Dividend Announcement Summary
At its board meeting held on Saturday, 2 May 2026, the Board of Directors of L.G. Balakrishnan & Bros recommended a final dividend of ₹22 per equity share of ₹10 each (220% of face value) for FY2025–26. The recommendation was placed before shareholders at the 70th Annual General Meeting held on 26 August 2026, where it was approved (confirmed via the company’s AGM-outcome filing on the exchanges).
What The Board Approved
- Final dividend of ₹22 per share for FY26.
- Same board meeting also approved the audited standalone and consolidated results, with an unmodified audit opinion from Suri & Co., Chartered Accountants.
- Dividend is a single annual final dividend — the company does not pay interim dividends in a typical year.
Accounting Treatment
Per Ind AS 10, a proposed dividend is not recognised as a liability until it is approved. The company therefore did not book the ₹22 dividend as a liability in the FY26 balance sheet. The ₹70.16 crore outflow will appear in the FY27 cash-flow statement, not FY26.
Key Dates Timeline
| Event | Date | Status |
|---|---|---|
| Board meeting / announcement | Sat, 2 May 2026 | Confirmed |
| Record date (dividend) | Wed, 19 Aug 2026 | Confirmed |
| Ex-dividend date | Wed, 19 Aug 2026 | Under T+1 (ex = record) |
| Book closure (for AGM) | 20–26 Aug 2026 | Confirmed |
| 70th AGM (approval) | Wed, 26 Aug 2026 | Approved |
| Payment date | On or before 18 Sep 2026 | As disclosed |
How To Read These Dates
The record date is the cut-off: only shareholders on the register on 19 August 2026 are eligible. Under India’s T+1 settlement, the ex-date and record date fall on the same day — you had to already own the shares by the end of 18 August 2026 (buying on 19 August did not qualify). Independent market-data providers (Yahoo Finance, Google Finance, INDmoney) also show the ex-date as 19 August 2026, consistent with the T+1 convention. The company stated the dividend would be paid on or before 18 September 2026; a precise payment date was not separately disclosed, so the outer statutory limit is shown.
Dividend Yield Analysis
The 220% Headline Is Not A Yield
A “220% dividend” sounds enormous, but that figure is simply ₹22 expressed as a percentage of the ₹10 face value. It is an accounting convention, not a return. A shareholder does not buy the stock at ₹10 — they buy it near its market price of roughly ₹1,730 (NSE, 10 Sep 2026). The genuine cash return, or dividend yield, is the dividend divided by the price you actually pay.
Face Value vs Real Yield
| Headline (on ₹10 face value) | 220% |
| Real yield @ ₹1,730 (current) | ~1.27% |
| Yield @ ₹1,682.60 (post-announcement, 4 May 2026) | ~1.31% |
The gap between 220% and ~1.3% is the single most common source of confusion in Indian dividend reporting.
Why The Yield Is Modest
LGB’s ~1.27% yield is not the result of a falling price or a one-off special payout. The stock is up strongly over the past year (near a ₹2,048 52-week high). Instead, the yield is modest because the company deliberately retains most of its profit — it pays out only about 22% of earnings and reinvests the rest into capacity. This is a growth-and-modest-income profile, not a high-yield one.
Dividend History Analysis
Dividend Per Share — Last Six Years
| Financial year | DPS (₹) | On face value | Payout ratio |
|---|---|---|---|
| FY21 | 10.00 | 100% | ~24% |
| FY22 | 15.00 | 150% | ~19% |
| FY23 | 16.00 | 160% | ~20% |
| FY24 | 18.00 | 180% | ~21% |
| FY25 | 20.00 | 200% | ~21% |
| FY26 | 22.00 | 220% | ~22% |
DPS history compiled from exchange/dividend records; payout ratios from consolidated earnings. Per-share figures before FY21 are not directly comparable because the equity capital base changed around FY19 (equity capital rose from ~₹16 cr to ~₹31 cr); those years would require restatement under Ind AS 33 before any like-for-like comparison.
The Trend
The dividend has risen every single year for six years — from ₹10 in FY21 to ₹22 in FY26, a compound growth rate of about 17% a year. There have been no cuts, no skipped years and no suspensions in this window. The payout ratio has stayed in a tight 19–24% band, meaning the rising dividend has been funded by rising profit rather than by stretching the payout.
Classification
On this record, LGB reads as a consistent, progressive dividend payer — a steadily growing annual dividend anchored to earnings growth. It is not a cyclical or irregular payer, though investors should note that as an auto-ancillary its earnings (and therefore its dividend capacity) remain tied to the automotive cycle.
Financial Performance Analysis
Consolidated FY26 vs FY25
| Metric (₹ cr) | FY26 | FY25 | Growth |
|---|---|---|---|
| Revenue from operations | 3,075.63 | 2,578.29 | +19.3% |
| Operating profit (EBITDA) | ~484 | ~416 | +16.4% |
| Profit before tax | 424.40 | 391.39 | +8.4% |
| Net profit (PAT) | 318.74 | 302.09 | +5.5% |
| EPS (₹) | 99.95 | 95.44 | +4.7% |
Forensic Finding: Operating Leverage Worked In Reverse
Revenue grew a strong +19.3%, but net profit rose only +5.5%. Profit grew roughly one-quarter as fast as sales — the opposite of positive operating leverage. The reason is that every major cost line grew faster than revenue:
- Cost of materials: +21.3%
- Employee costs: +22.4%
- Depreciation: +25.9% (new capacity being commissioned)
- Finance costs: +48.8% (borrowings rose to fund capex)
- Total expenses: +20.2% vs revenue +19.3%
One-Time Items To Note
FY26 included a net exceptional gain of ₹2.60 cr, made up of a ₹15.03 cr subsidy received and a ₹12.43 cr one-time charge for the statutory impact of India’s new Labour Codes (effective 21 November 2025). These two largely offset each other, so reported profit is not materially flattered or depressed by exceptionals. The margin squeeze above is therefore an operating story, not an accounting one.
Segment Split
LGB reports two segments. Transmission (chains, sprockets, tensioners, belts, brake shoes — the Rolon business) is the engine, at roughly ₹2,309.75 cr of consolidated revenue (~85%). Metal Forming (fine blanking, machined components, wire drawing) contributes about ₹765.87 cr. Transmission also carries the higher segment margin, so the dividend is effectively underwritten by the chains franchise.
Cash Flow Analysis
Reported profit is an accounting opinion; cash is fact. On the cash side, LGB looks healthy at the operating level but ran a negative free cash flow year because of an aggressive capex programme.
Cash Conversion Is Strong
| Operating cash flow (OCF) | ₹331.71 cr |
| Net profit (PAT) | ₹318.74 cr |
| OCF as % of PAT | ~104% |
OCF slightly exceeds reported profit — a sign of good earnings quality. Profits are being converted into real cash rather than sitting in receivables or inventory. Debtor days (~48) and inventory days (~140) have been broadly stable.
Forensic Finding: Free Cash Flow Is Negative
| Operating cash flow | ₹331.71 cr |
| Capital expenditure | ₹371.26 cr |
| Free cash flow (FCF) | –₹39.55 cr |
Because capex outran operating cash, FCF was negative this year. That means the FY26 dividend is not funded out of the current year’s surplus cash — it is funded from accumulated cash reserves and current earnings, while the business is simultaneously investing heavily for growth (including the new Nagpur chains plant).
Integrity Cross-Check
As a data check, the FY26 cash-flow statement shows “Dividend Paid” of ₹63.38 cr — this is the FY25 dividend of ₹20 paid out during FY26 (₹20 × 3.19 cr shares ≈ ₹63.8 cr). The close match confirms our share count. The new ₹22 dividend (₹70.16 cr) will show up in the FY27 statement.
Balance Sheet Strength
Net Cash Balance Sheet
| Total borrowings | ₹184.78 cr |
| Cash & bank balances | ₹264.37 cr |
| Net debt / (net cash) | (₹79.59 cr) net cash |
| Non-current investments | ₹140.19 cr |
| Total equity (net worth) | ₹2,156.24 cr |
What It Means For The Dividend
Even after borrowing to fund capex, LGB holds more cash and bank balances (₹264.37 cr) than total debt (₹184.78 cr) — a net cash position of roughly ₹80 cr, with a further ₹140 cr in investments. A net-cash company with a ₹70 cr dividend has ample cushion. The company also carries an ICRA “AA” long-term credit rating, and its own filing confirms it is not classified as a “Large Corporate” borrower (zero qualified borrowings), underlining a conservative funding profile. Book value is about ₹675 per share.
Dividend Sustainability Analysis
Four-Test Coverage Scorecard
| Test | Coverage | Verdict |
|---|---|---|
| Earnings coverage (EPS ÷ DPS) | 4.54x | Very comfortable |
| Operating cash flow coverage | 4.73x | Very comfortable |
| Free cash flow coverage | –0.56x | Fails (capex year) |
| Cash & bank coverage | 3.77x | Very comfortable |
Payout ratio ~22% (consolidated) / ~23% (standalone). Including non-current investments, liquid-asset coverage rises to ~5.8x.
Composite Verdict: Sustainable
Three of the four tests pass comfortably. The dividend consumes only ~22% of profit and ~21% of operating cash flow, and the company sits on more cash than debt. The one test that fails — free cash flow coverage — fails only because FY26 was a heavy investment year (capex of ₹371 cr against OCF of ₹332 cr). This is a deliberate growth-capex choice, not a distress signal: the shortfall is bridged by a large cash pile. On balance, the ₹22 dividend looks sustainable. The item to watch is whether capex stays elevated for several more years while OCF grows to catch up.
Peer Comparison
Dividend & Return Profile vs Auto-Ancillary Peers
| Company | Div. yield | Payout | ROE | ROCE |
|---|---|---|---|---|
| LGB (LGBBROSLTD) | ~1.27% | ~22% | 15.5% | 19.6% |
| Suprajit Engineering | ~0.7% | ~32% | NIV | NIV |
| Fiem Industries | ~1.30% | NIV | NIV | NIV |
| Pricol | ~0.36% | NIV | NIV | NIV |
| Subros | ~0.24% | ~11% | NIV | NIV |
Peer yields/payouts from public market data (FY25–26). Cells marked NIV (Not Independently Verified) are intentionally left un-filled rather than populated with unconfirmed figures.
Reading The Table
Within this peer set, LGB’s ~1.27% yield sits near the top — broadly in line with Fiem and comfortably above Suprajit, Pricol and Subros. Yet LGB does this with a relatively modest payout (~22%): its higher yield reflects a lower valuation multiple and steady dividend growth rather than an aggressive distribution. LGB’s ROCE (~19.6%) is healthy for the sector, while its ROE (~15.5%) is somewhat restrained by its large, low-leverage equity base.
Promoter Impact Analysis
Who Receives The ₹70.16 cr
| Promoters (~34.84%) | ~₹24.44 cr |
| Non-promoters (~65.16%) | ~₹45.72 cr |
| — Public | ~45.28% |
| — Domestic institutions (DII) | ~13.46% |
| — Foreign institutions (FII) | ~6.42% |
Shareholding as per the latest available pattern (Jun 2026). Promoter holding was ~34.83% at Mar 2026.
Interpretation
The promoter family holds a relatively low ~34.8% stake for a founder-run company, so the majority of the dividend (~₹45.7 cr) flows to public and institutional shareholders rather than to promoters. Promoters take home about ₹24.4 cr. Because the payout ratio is modest and applies equally per share, the dividend does not disproportionately benefit insiders — minority holders receive nearly two-thirds of the pool. The low promoter stake is flagged by screeners as a governance point to be aware of, though it also means broad public participation in the payout.
Taxation Analysis
How Dividends Are Taxed In India
Since April 2020, dividends are taxed in the hands of the shareholder, not the company (the old Dividend Distribution Tax is gone). A dividend is added to your total income under “Income from Other Sources” and taxed at your applicable income-tax slab rate. The company must deduct TDS at 10% under Section 194 if your total dividend from LGB in a financial year exceeds ₹10,000 (20% or the applicable treaty rate for NRIs). That TDS is adjustable against your final tax liability.
Worked Example — Investor Holding 1,000 Shares (30% Slab)
| Gross dividend (1,000 × ₹22) | ₹22,000 |
| TDS deducted @10% (u/s 194) | ₹2,200 |
| Total tax @30% slab | ₹6,600 |
| Net dividend in hand (after full tax) | ₹15,400 |
| Pre-tax yield (at ₹1,730) | ~1.27% |
| Post-tax yield (30% slab) | ~0.89% |
TDS of ₹2,200 is not an extra cost — it is a prepayment adjusted against the ₹6,600 total tax. A shareholder in a lower slab (or below the taxable threshold) pays less and can claim a refund of excess TDS. Surcharge/cess ignored for simplicity. This is general information, not tax advice.
Key Risks
- Margin compression is real. FY26 showed revenue +19.3% but PAT only +5.5%, as materials (+21.3%), employee costs (+22.4%) and depreciation (+25.9%) all outgrew sales. If input and staff costs stay elevated, profit — and dividend headroom — growth could lag revenue growth.
- Negative free cash flow during the capex cycle. Capex (₹371 cr) exceeded operating cash flow (₹332 cr) in FY26, giving negative FCF of ~₹40 cr. A prolonged heavy-investment phase funded partly by debt could pressure future distribution capacity.
- Automotive cyclicality. LGB’s chains and metal-forming demand is tied to 2-wheeler, tractor and auto OEM/replacement cycles. A downturn in vehicle demand directly hits earnings and, indirectly, the dividend.
- Rising finance costs. Interest expense jumped ~48.8% year-on-year as borrowings rose to fund capacity; total borrowings increased to ~₹184.78 cr from ~₹157 cr a year earlier.
- Low promoter holding (~34.8%). A modest promoter stake is flagged by market screeners as a structural point; it can raise questions on alignment and makes the register more float-driven.
- Modest yield. At ~1.27%, LGB is not an income stock; a purely dividend-seeking investor gets a small cash return relative to price.
What To Monitor
- Capex-to-OCF trajectory. Watch whether operating cash flow rises to cover capex in FY27–28, which would flip free cash flow back to positive and remove the one weak spot in the dividend-coverage scorecard.
- Operating margin (OPM). Consolidated OPM eased to ~16% (and quarterly readings dipped to ~13–14% in the latest quarters). A recovery toward the ~17–19% seen in FY22–24 would restore profit leverage.
- Ramp-up of new capacity. Track utilisation and revenue contribution from the new Nagpur transmission-chain plant — the payoff that justifies the current capex-heavy phase.
- Payout-ratio policy. The payout has crept from ~19% to ~22%; whether management holds this band or lets it drift up will shape future dividend growth versus reinvestment.
- Export/end-market mix and auto demand. Monitor 2-wheeler and replacement-market demand and any shift in exports, which drive the transmission segment that funds the dividend.
- Borrowings and finance cost. Keep an eye on debt levels; a further rise would erode the current net-cash comfort.
Conclusion
Positives
- Sixth straight year of a rising dividend (₹10 → ₹22, ~17% CAGR); no cuts or skips.
- Dividend is well covered by earnings (4.54x) and operating cash flow (4.73x) at a conservative ~22% payout.
- Net-cash balance sheet (~₹80 cr net cash plus ₹140 cr investments) and an ICRA “AA” rating.
- High earnings quality — operating cash flow at ~104% of profit.
- Real yield (~1.27%) is competitive within the auto-ancillary peer group.
Negatives / Watch-Outs
- Profit grew far slower than revenue (+5.5% vs +19.3%) as costs outran sales.
- Free cash flow was negative (–₹39.55 cr) in a heavy-capex year; the dividend was funded from reserves, not FY26 surplus cash.
- Finance costs up ~48.8%; borrowings rising.
- Modest ~1.27% yield — not an income play.
In short, LGB’s ₹22 FY26 dividend is a reliable, growing but small payout backed by a strong balance sheet — a growth-oriented auto-ancillary that shares a modest slice of profit while reinvesting the bulk into capacity. The two forensic caveats a reader should carry away are the margin squeeze and the negative free cash flow during the current investment cycle. We present the facts, positives, negatives and monitoring points; the investment decision is yours.
Frequently Asked Questions
What dividend has L.G. Balakrishnan & Bros announced for FY26?
What is the real dividend yield of LGB?
What is the record date for the LGB dividend?
What is the ex-date for the LGB dividend?
When will the LGB dividend be paid?
Who is eligible to receive the dividend?
How is the LGB dividend taxed?
Is the LGB dividend sustainable?
What is LGB’s dividend history?
How much of the dividend goes to promoters?
Why did profit grow so much slower than revenue in FY26?
What should investors monitor going forward?
Disclaimer
This article is for informational and educational purposes only and is not investment, financial, legal or tax advice, nor a recommendation to buy, sell or hold any security. ShareBazaar Online is not a SEBI-registered investment adviser or research analyst. All company financials are drawn from L.G. Balakrishnan & Bros Limited’s audited FY26 results and board-meeting disclosures filed with the exchanges on 2 May 2026 and its AGM-outcome filing dated 26 August 2026. Market price, market capitalisation, yield, shareholding and peer figures are sourced from publicly available market data (NSE/BSE, Screener and other providers) and are dynamic — all yield figures are price-dependent and should be re-verified against the live market price before relying on them. Ratios have been computed by ShareBazaar Online from disclosed data; items that could not be independently verified are marked “NIV” or “Not Disclosed by Company.” Investors should read the company’s original filings and consult a qualified professional before making any decision. Investments in securities are subject to market risks.