
Dividend Snapshot
Bandhan Bank Limited (NSE: BANDHANBNK | BSE: 541153) has recommended a final dividend of ₹1.50 per equity share for the financial year ended March 31, 2026 (FY26). The headline is often quoted as a “15% dividend”, but that 15% is measured on the ₹10 face value — not on what you actually pay for the share. Measured against the live market price of about ₹174 (NSE, 10 September 2026), the real cash return works out to roughly 0.86%. That gap between the headline percentage and the real yield is the single most important thing for a retail investor to understand about this payout.
Dividend Per Share
₹1.50
Final dividend · 15% of ₹10 face value
Real Dividend Yield
~0.86%
On CMP ₹174 (NSE, 10-Sep-2026)
Record Date
17-Aug-2026
Ex-date also 17-Aug-2026
Total Dividend Outflow
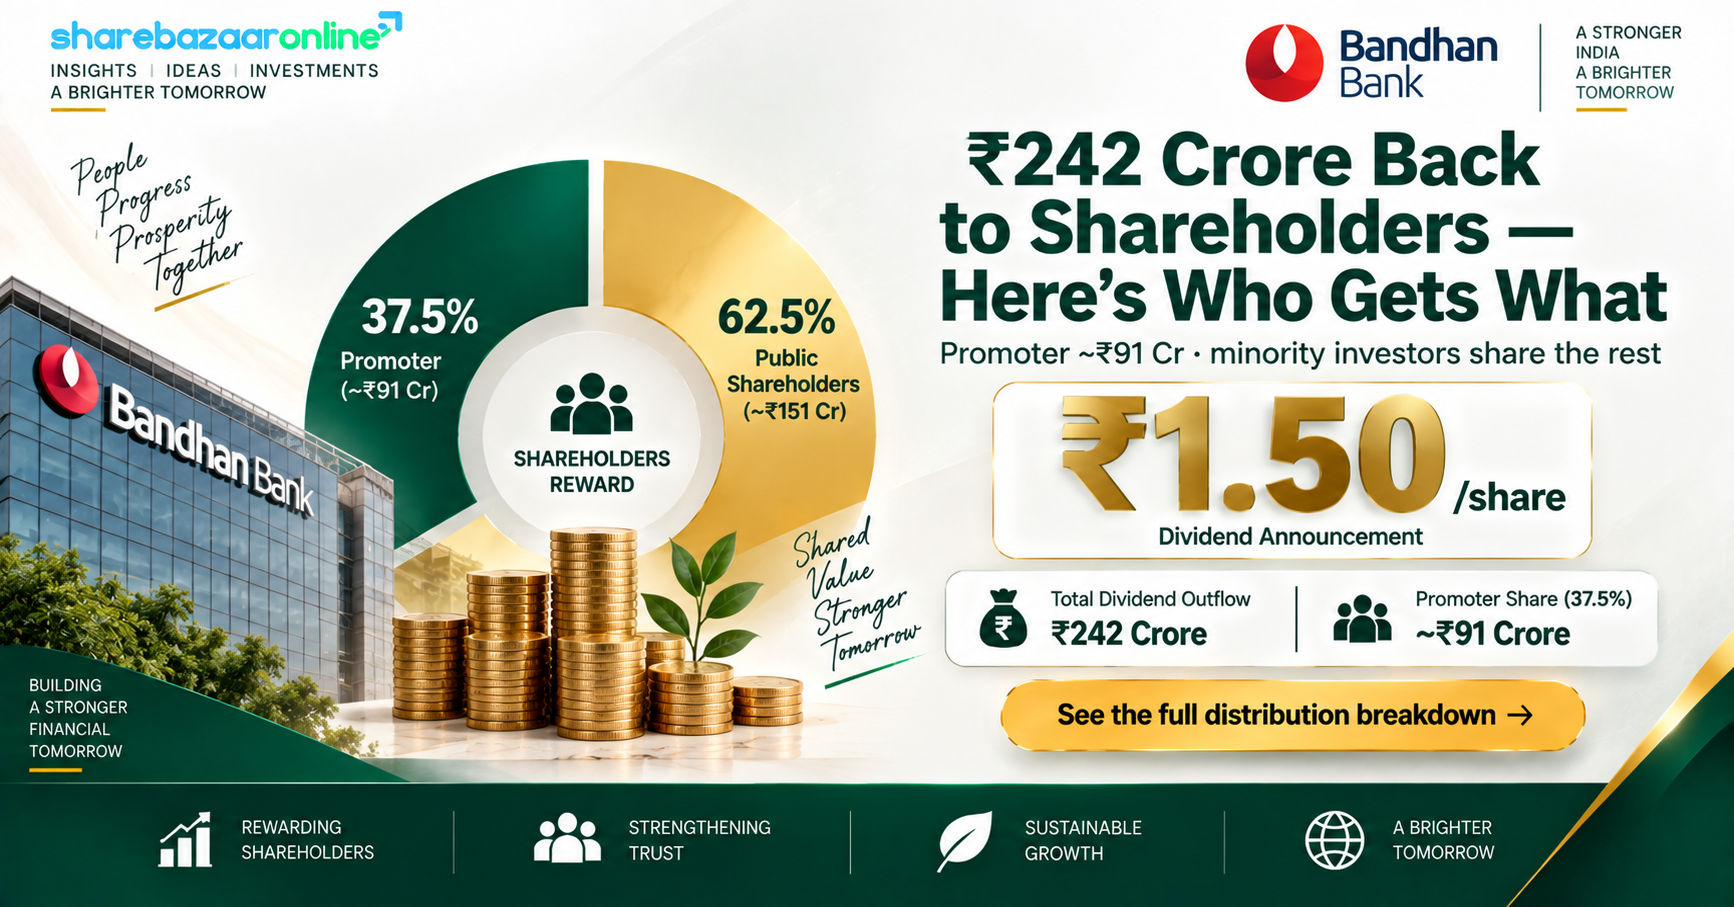
~₹242 Cr
On ~161.1 crore shares
Dividend Payout Ratio
~19.7%
Of FY26 PAT of ₹1,224 Cr
Earnings Coverage
5.07x
EPS ₹7.60 ÷ DPS ₹1.50
The one-line takeaway: Bandhan Bank kept its dividend flat at ₹1.50 for a fourth year running, even though FY26 net profit fell about 55%. The dividend itself is small and comfortably covered, but the story worth watching is why the same ₹1.50 now eats up a much larger slice of a shrunken profit.
Dividend Announcement Summary
At its board meeting held on Tuesday, 28 April 2026 in Kolkata (which began at 10:00 A.M. and concluded at 3:35 P.M.), the Board of Directors of Bandhan Bank approved the audited financial results for Q4 and the full year ended 31 March 2026, and recommended a dividend of ₹1.50 per equity share (Rupee One and Fifty Paisa only) on shares of ₹10 face value — equivalent to 15% of face value — out of the profits of the Bank for FY26.
What the filing actually says
The dividend is a recommendation, not yet a final entitlement. Per the exchange filing, the payout is “subject to the approval of Shareholders at the ensuing Annual General Meeting (AGM)”, and will be paid or dispatched only after that approval. The auditors (V. Sankar Aiyar & Co. and V. Singhi & Associates) issued an unmodified opinion on the results.
Why FY26 was unusual
The same board meeting reported a sharp full-year profit decline but a strong Q4 recovery, with net profit up about 68% year-on-year in the March quarter. The Board chose to hold the dividend steady at ₹1.50 rather than cut it in line with the lower full-year earnings — a signal of confidence in the recovery, but one that pushes the payout ratio higher.
Key Dates Timeline
| Event | Date | Status / Note |
|---|---|---|
| Board meeting & dividend recommendation | 28-Apr-2026 | Confirmed from exchange filing |
| Record date | 17-Aug-2026 | Confirmed (BSE/NSE corporate action) |
| Ex-dividend date | 17-Aug-2026 | Same as record date under T+1 |
| AGM approval | Ensuing AGM | Required before payment |
| Payment / credit date | ~19-Sep-2026 | Reported post-AGM; filing states “after AGM approval” |
To have been eligible, an investor needed to hold the shares in their demat account as of the record date, 17 August 2026. Because both the ex-date and record date have already passed, this is now a completed corporate action — the analysis below is written for readers researching the payout after the event.
Dividend Yield Analysis
This is where most retail readers are misled. The number you see in headlines — “15%” — is the dividend as a percentage of the ₹10 face value (₹1.50 ÷ ₹10 = 15%). It is not the return on your investment. Nobody buys Bandhan Bank at ₹10; the share trades near ₹174. The real dividend yield — the actual cash return on money invested — is what matters, and it is far smaller.
The face-value illusion vs. reality
| Headline (on ₹10 face value) | 15.0% |
| Real yield at CMP ₹174 (10-Sep-2026) | ~0.86% |
| Yield at announcement close ₹178.65 (28-Apr-2026) | ~0.84% |
| Yield near recent low ₹163 (07-Sep-2026) | ~0.92% |
How the yield changes with price
Because the dividend is fixed at ₹1.50, the yield moves purely with the share price. When the stock touched its 52-week high of ₹220.76, the same dividend yielded only ~0.68%; near its 52-week low of ₹134.25 it would yield ~1.12%. A “higher yield” here would come from a falling price, not a richer dividend — a classic yield trap to keep in mind. At every realistic price, Bandhan’s yield sits well below a bank fixed deposit.
Bottom line on yield: Bandhan Bank is not a dividend-income stock. At ~0.86%, the cash yield is a rounding error next to the stock’s own price swings (a 52-week range of ₹134 to ₹221). Any investment case rests on capital appreciation and a profit recovery, not on the dividend cheque.
Dividend History Analysis
| Financial Year | Dividend / Share | EPS (₹) | Payout Ratio |
|---|---|---|---|
| FY26 | ₹1.50 | 7.60 | ~20% |
| FY25 | ₹1.50 | 17.04 | ~9% |
| FY24 | ₹1.50 | 13.84 | ~11% |
| FY23 | ₹1.50 | 13.62 | ~11% |
| FY22 | Nil | 0.78 | 0% |
| FY21 | ~₹1.00* | 13.69 | ~7% |
| FY20 | Nil | 18.78 | 0% |
*FY21 per-share figure derived from Screener payout data; exact amount to be desk-verified. FY20 and FY22 were nil-dividend years (pandemic provisioning and RBI-related constraints). Prior maiden dividends (around FY18–FY19) were followed by cuts.
The pattern: flat, not growing
Bandhan has now paid exactly ₹1.50 for four straight years (FY23–FY26), despite earnings that swung from ₹13.62 to ₹17.04 and back down to ₹7.60 per share. The dividend has not risen with good years, and this year it did not fall with a bad one. Independent trackers note the payout has effectively gone from about ₹1.00 (FY18 era) to ₹1.50 — modest growth spread across several years, with cuts and skipped years in between.
How we classify the record
Given the two nil years (FY20, FY22) and an earlier history of cuts, followed by four years of a flat ₹1.50, Bandhan Bank reads as a recently consistent but non-growing payer with an irregular earlier track record — closer to a “symbolic” dividend policy than a genuine income compounder.
Financial Performance Analysis
| Metric (Standalone) | FY26 | FY25 | Change |
|---|---|---|---|
| Total income (₹ Cr) | 21,689 | 21,948 | −1.2% |
| Net interest income (₹ Cr) | 10,830 | ~11,490 | −5.8% |
| Profit before tax (₹ Cr) | 1,734 | 3,623 | −52.1% |
| Net profit / PAT (₹ Cr) | 1,224 | 2,745 | −55.4% |
| EPS (₹) | 7.60 | 17.04 | −55.4% |
The operating-leverage story
Revenue barely moved (−1.2%), yet profit more than halved. The pressure came from above the top line and in provisions: net interest income fell ~5.8% as the cost of funds rose faster than lending yields, squeezing the net interest margin. On top of that, elevated credit costs and write-offs in the microfinance-linked book — the bank took large technical write-offs during the year — drove profit before tax down about 52%. This is the textbook case of “revenue flat, profit falling” caused by margin compression plus higher provisioning, not a demand collapse.
A strong Q4 tail
The full-year weakness masks a recovering exit quarter. Q4 FY26 PAT of ₹534 crore was up ~68% year-on-year (and up ~159% sequentially), helped by sharply lower provisions and improving asset quality. So the FY26 dividend is set against a full year that was poor but a fourth quarter that looked like the start of a turnaround. Whether that momentum holds is the crux of the investment debate.
Cash Flow Analysis
An important caveat first: a bank is not a manufacturer. For lenders, the usual “operating cash flow” and “free cash flow” tests are not meaningful gauges of dividend safety, because deposits, loan growth and investment book movements dominate the cash flow statement and can swing wildly from year to year. For banks, the right questions are: are profits real, is capital adequate, and is liquidity comfortable? We answer those in the sections that follow, and treat the cash flow lines below as context only.
FY26 cash flow (context only)
| Cash from operating activity | ₹1,143 Cr |
| Cash from investing activity | ₹317 Cr |
| Cash from financing activity | ₹2,923 Cr |
| Net cash flow | ₹4,382 Cr |
Is the dividend funded by earnings?
Yes. The ~₹242 crore payout is small relative to the ₹1,224 crore of FY26 profit and is funded from current-year earnings, not from borrowing or one-off asset sales. Even on the (imperfect) cash view, operating cash flow of ₹1,143 crore covers the dividend roughly 4.7 times. The dividend is not the risk here; the risk is the earnings level itself.
Balance Sheet Strength
Franchise & funding
| Total deposits (Mar-26) | ~₹1.66 lakh Cr |
| Gross advances | ~₹1.54 lakh Cr |
| Total business | ~₹3.21 lakh Cr |
| CASA ratio | ~29.3% |
| Liquidity coverage ratio | ~131.8% |
Capital & asset quality
| Capital adequacy (CRAR, incl. profits) | 18.0% |
| Regulatory minimum | 11.5% |
| Gross NPA (Mar-26) | 3.27% |
| Net NPA | 0.97% |
| Book value per share | ~₹159 |
The balance sheet is the reassuring part of this story. Capital adequacy of 18.0% sits a comfortable 6.5 percentage points above the regulatory floor, giving the bank ample room to both absorb credit stress and pay its (small) dividend. Asset quality improved through the year, with gross NPAs falling to 3.27% and net NPAs below 1%, and liquidity is strong at an LCR near 132%. The weakness is in the profit-and-loss engine, not in solvency or funding.
Dividend Sustainability Analysis
We assess sustainability using a four-test framework, adapted for a bank (where the free-cash-flow test is replaced by capital adequacy, the correct affordability gauge for a lender).
1. Earnings coverage — Strong
EPS of ₹7.60 covers the ₹1.50 dividend 5.07 times. Even after a 55% profit fall, the payout is only ~20% of earnings.
2. Capital adequacy (bank FCF proxy) — Strong
CRAR at 18.0% vs an 11.5% minimum. A ₹242 crore dividend is trivial against a capital base of this size; it does not threaten regulatory buffers.
3. Liquidity / cash coverage — Strong
LCR near 132% and a large deposit franchise mean funding the cash payout is a non-issue. Cash and short-term investments cover the dividend many times over.
4. Earnings trend — The watch-point
This is the one amber flag. Profit is declining, and the payout ratio has jumped from ~9% to ~20% simply because EPS fell — the same dividend on a smaller profit. Sustainability depends on the FY26-Q4 recovery continuing.
Composite verdict: Sustainable. The ₹1.50 dividend is comfortably affordable on every metric that matters for a bank — earnings coverage, capital and liquidity are all strong. The caveat is qualitative rather than about affordability: the dividend is being held flat into a profit downturn, so the payout ratio is rising. If earnings do not recover, future dividend growth is unlikely, even though the current payout is safe.
Peer Comparison
| Bank (FY26) | Dividend / Share | Approx. Yield | FY26 RoE |
|---|---|---|---|
| Bandhan Bank | ₹1.50 | ~0.86% | ~4.9% |
| IDFC First Bank | ₹0.25 | ~0.3–0.6% | NIV |
| Ujjivan Small Finance Bank | Nil (FY26) | 0% | NIV |
Peer RoE and payout cells marked NIV (Not Independently Verified) are left blank rather than filled with unverified figures. Yields are price-dependent and should be re-checked live.
Where Bandhan sits
Among microfinance-exposed lenders, Bandhan’s ~0.86% yield is actually at the higher end — IDFC First pays a token ₹0.25, and Ujjivan SFB cut its dividend to nil in FY26 after paying ₹1.50 the year before. In that light, simply maintaining ₹1.50 stands out.
The sector backdrop
Independent analysis (S&P Global Market Intelligence) projected Indian banks’ aggregate dividend payouts to fall about 4.2% in FY26 on weaker margins and profits, with even large banks such as HDFC Bank and Bank of Baroda expected to trim per-share dividends. Bandhan holding steady runs against that grain.
Promoter Impact Analysis
Who receives the dividend
| Promoter (Bandhan Financial Holdings) | 37.54% |
| FIIs | 18.64% |
| DIIs | 27.47% |
| Public / others | 16.33% |
| Government | 0.07% |
Shareholding as of June 2026 (Screener). Institutional split can vary by classification across sources.
Promoter dividend pass-through
On the ~₹242 crore total outflow, the promoter (Bandhan Financial Holdings Limited) receives roughly ₹91 crore at its 37.54% stake. Minority public shareholders together receive the balance in proportion to their holdings — a retail holder of 1,000 shares receives ₹1,500 before tax. The dividend is a flat, pro-rata distribution: no shareholder class is advantaged over another on a per-share basis.
Worth noting: the promoter has been steadily reducing its stake — from ~40% a year earlier to ~37.5% by June 2026. A declining promoter holding is a factor investors typically watch, as it can create a supply overhang and signals the promoter is monetising rather than adding to its position. The dividend it collects (~₹91 crore) is modest next to the value of the stake it has been selling.
Taxation Analysis
Since April 2020, dividends in India are taxed in the hands of the investor, not the company. Your dividend is added to your total income and taxed at your applicable income-tax slab rate. Separately, the company deducts TDS at 10% before paying, but only if your total dividend from that company exceeds ₹10,000 in a financial year (with PAN; 20% without PAN). The TDS is not an extra cost — you adjust it against your final tax liability when filing your return.
Worked example — retail investor holding 1,000 shares (30% slab)
| Gross dividend (1,000 × ₹1.50) | ₹1,500 |
| TDS at source (dividend < ₹10,000, so none) | ₹0 |
| Tax at 30% slab + 4% cess | ₹468 |
| Net dividend in hand | ₹1,032 |
| Effective post-tax yield (at CMP ₹174) | ~0.59% |
Illustrative only; surcharge may apply at higher incomes. Consult a tax adviser for your situation.
The tax reality: for a top-slab investor, tax converts an already-thin ~0.86% pre-tax yield into a ~0.59% post-tax return. For anyone in the 30% bracket, the dividend is a marginal cash-flow item, not a reason to own the stock.
Key Risks
- Microfinance / EEB stress: The Emerging Entrepreneurs Business (microfinance) book remains the source of elevated slippages and write-offs; a fresh stress cycle in unsecured rural lending would hit profits directly.
- Margin (NIM) compression: FY26 net interest income fell ~5.8% as funding costs rose faster than lending yields. Management has already flagged its earlier RoA goal of 1.6–1.8% as harder to reach because of higher funding and technology costs.
- Earnings volatility: EPS swung from ₹17.04 to ₹7.60 in a single year. Such volatility makes the dividend’s coverage unpredictable even if the absolute payout is small.
- Promoter stake reduction: Promoter holding has drifted down from ~40% to ~37.5%, which can create a share-supply overhang and weigh on the price.
- Regulatory scrutiny: The bank has faced RBI-related scrutiny and penalties in the past; compliance and provisioning surprises are an ongoing risk for a lender of this profile.
- Yield-trap optics: Because the dividend is fixed, any rise in dividend yield would most likely come from a falling share price — not something income investors should chase.
What To Monitor
- Net interest margin trajectory: Whether the Q4 FY26 NIM improvement (aided by a falling cost of funds) sustains into FY27, as this drives the profit recovery the dividend leans on.
- Asset quality in the EEB book: Slippage and collection-efficiency trends (collection efficiency was ~98.9% in Q4) in the microfinance portfolio.
- Shift to secured lending: Secured advances grew ~25% and are now ~56% of the book — a de-risking trend worth tracking for margin and credit-cost stability.
- Capital adequacy (CRAR): Currently a healthy 18.0%; watch whether growth and any stress erode this buffer.
- Return ratios / RoA reset: Progress toward management’s revised profitability targets under the “Bandhan 2.0” strategy and new leadership.
- Dividend policy signals: Whether the bank raises the dividend above ₹1.50 as/if earnings recover — the first change in four years would be a meaningful signal.
Conclusion
Positives
- Dividend held flat at ₹1.50 through a weak year, while some peers cut to nil.
- Comfortable coverage: 5.07x on earnings; ~20% payout.
- Strong balance sheet: CRAR 18.0%, net NPA <1%, LCR ~132%.
- Q4 FY26 profit up ~68% YoY — a visible recovery tail.
Negatives & caveats
- FY26 PAT down ~55%; EPS more than halved.
- Real yield only ~0.86% — below a bank FD; ~0.59% post-tax at 30%.
- Flat, non-growing dividend; payout ratio rising because profit fell.
- Margin pressure, microfinance stress and a declining promoter stake.
Bandhan Bank’s FY26 dividend is best read as a signal, not an income stream. The ₹1.50 payout is tiny in yield terms and safe in coverage terms; its real message is that the Board chose to hold the line through a difficult year, betting on the recovery that Q4 hinted at. For income-seekers the yield is immaterial; for those interested in the stock, the dividend is a footnote to the bigger question of whether earnings and margins rebound. We present the positives, negatives, risks and monitoring factors above so you can weigh them yourself — this article does not offer a buy, sell or hold view.
Frequently Asked Questions
What dividend has Bandhan Bank announced for FY26?
What is the actual dividend yield — is it really 15%?
What was the record date for the Bandhan Bank dividend?
What was the ex-dividend date?
When will (or was) the dividend paid?
Who was eligible to receive the dividend?
How is the Bandhan Bank dividend taxed?
Is the Bandhan Bank dividend sustainable?
What is Bandhan Bank’s dividend history?
Why did Bandhan Bank’s profit fall so much in FY26?
How does Bandhan’s dividend compare with peers?
How much of the dividend goes to the promoter?
What should investors monitor from here?
Is Bandhan Bank a good dividend stock?
Disclaimer
This article is for informational and educational purposes only and does not constitute investment advice, a research report, or any buy, sell or hold recommendation. ShareBazaar Online is not a SEBI-registered investment adviser or research analyst. Dividend figures, dates and financials are compiled from the company’s exchange filing dated 28 April 2026 and publicly available sources including NSE/BSE, the bank’s press release, and Screener.in; some data points are labelled “NIV” (Not Independently Verified) or “derived” where a primary confirmation was unavailable. Market prices and yields are price-dependent and change continuously — verify the live figures before acting. Past performance and past dividends do not guarantee future outcomes. Please consult a SEBI-registered investment adviser and read all offer documents / filings before making any investment decision. The author and publisher accept no liability for any loss arising from the use of this content.