
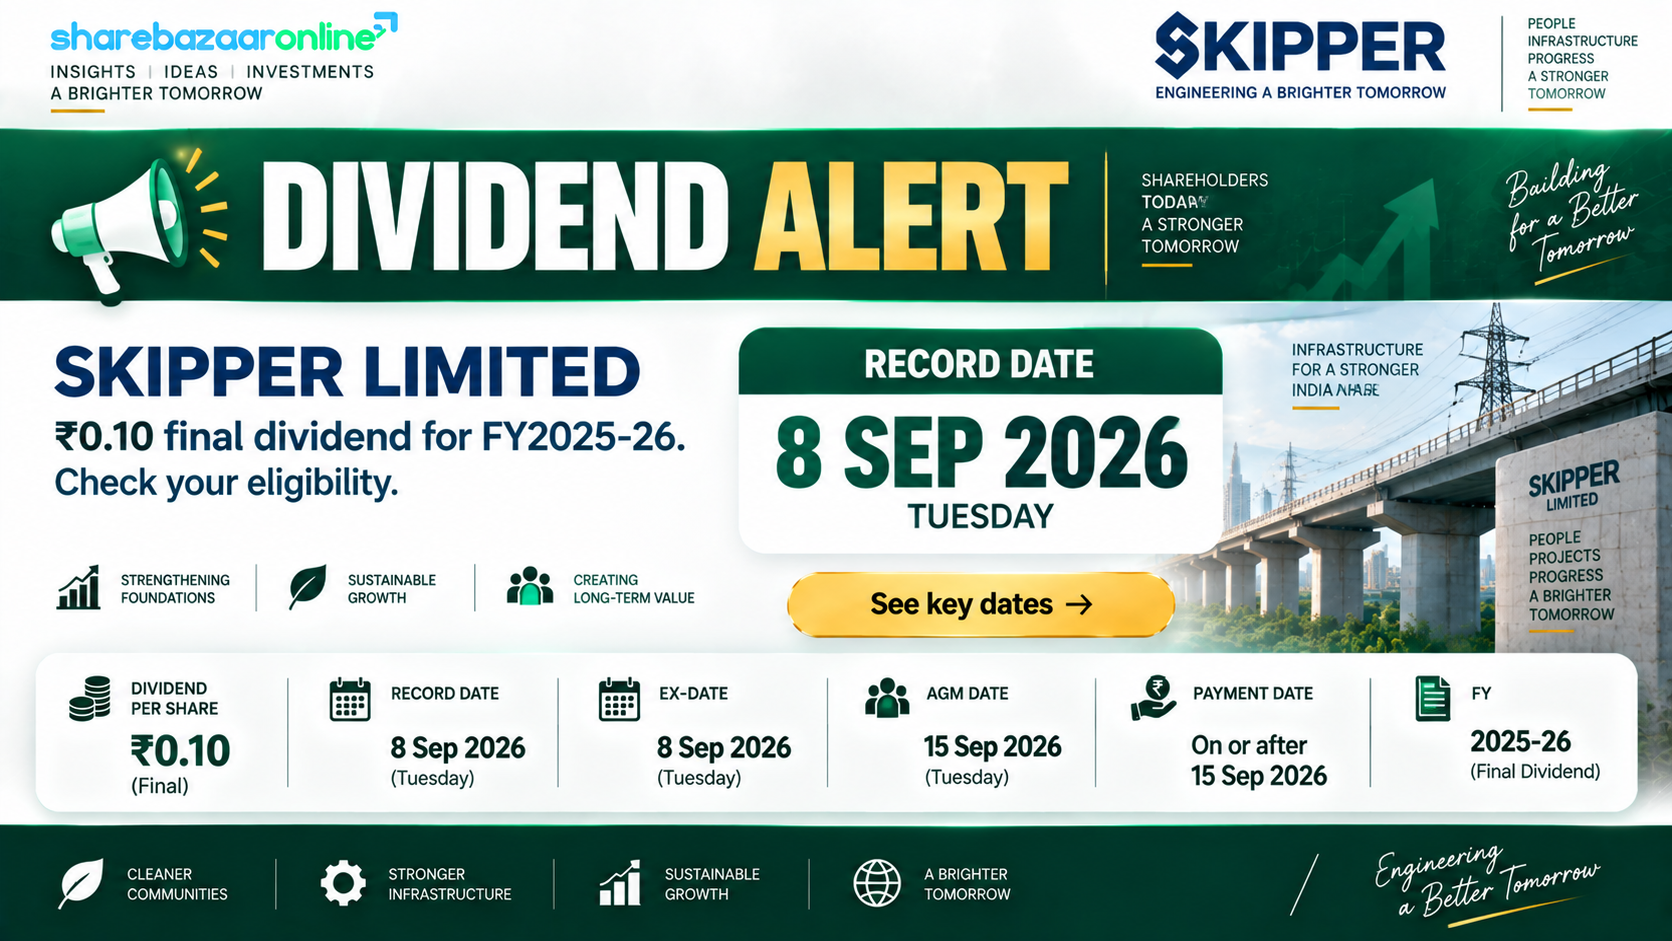
Dividend Snapshot
Skipper Limited (NSE: SKIPPER, BSE: 538562) has recommended a Final Dividend of ₹0.10 per equity share for the financial year 2025-26, on a face value of ₹1. That headline works out to a 10% dividend on face value — but on the live market price of about ₹594, the real cash yield is only about 0.02%. The payout is subject to shareholder approval at the 45th Annual General Meeting scheduled for 15 September 2026.
Dividend Per Share
₹0.10
Final Dividend, FY 2025-26 (10% of ₹1 face value)
Real Dividend Yield
~0.02%
On CMP of ₹594 (9 Sep 2026 close)
Record Date
8 Sep 2026
Revised from 4 Sep 2026
Total Dividend Outflow
~₹1.13 Cr
₹0.10 × ~11.28 crore shares
The one-line takeaway: Skipper is a fast-growing power transmission and polymer-pipe manufacturer, not an income stock. Its dividend is a token ₹0.10 that has stayed frozen for seven straight years even as earnings per share climbed from ₹3.67 to ₹18.36. The company is choosing to retain almost all profit to fund capacity expansion and manage debt.
Dividend Announcement Summary
The Board of Directors recommended a final dividend of ₹0.10 per equity share (face value ₹1) for the year ended 31 March 2026, alongside the company's FY26 annual results. Skipper first intimated the record date to the exchanges on 11 August 2026, notifying a cut-off of 4 September 2026. Through a subsequent filing dated 22 August 2026 (reference SKPL/SECT/2026-27/76), the company revised the record date to 8 September 2026. The dividend remains "recommended" and is payable only after members approve it at the AGM.
What the filing confirms
- Purpose: Payment of Final Dividend for FY 2025-26
- Type of security: Equity
- Book closure: Not applicable
- Revised record date: 8 September 2026
- Signed by Anu Singh, Company Secretary & Compliance Officer
What the filing does not state
- Dividend amount is not in the record-date letter itself (sourced from the results filing and AGM notice)
- Ex-date is not separately confirmed in this filing
- Payment date: Not Disclosed by Company
Key Dates Timeline
| Event | Date | Status |
|---|---|---|
| Board recommendation (with FY26 results) | May 2026 | Confirmed |
| Original record-date intimation | 11 Aug 2026 | Confirmed |
| Revised record-date intimation | 22 Aug 2026 | Confirmed |
| Ex-Date | 8 Sep 2026 (inferred, T+1) | To verify vs NSE/BSE circular |
| Record Date (revised) | 8 Sep 2026 | Confirmed |
| 45th Annual General Meeting | 15 Sep 2026 | Scheduled |
| Payment Date | Not Disclosed by Company | After AGM approval |
Under the T+1 settlement cycle now standard on Indian exchanges, the ex-date and record date usually fall on the same day. We therefore show the ex-date as 8 September 2026, but flag it as inferred pending the official exchange corporate-action circular. In Skipper's recent history, the actual dividend payment has landed roughly six weeks after the record date (for FY25 the record date was 16 September 2025 and payment followed on 23 October 2025).
Dividend Yield Analysis
This is where a lot of retail investors get tripped up. A "10% dividend" sounds generous, but that 10% is calculated on the ₹1 face value, not on the price you actually pay in the market. The genuine yield — the cash you receive as a percentage of your investment — is far smaller.
The face-value illusion
Dividend ₹0.10 ÷ face value ₹1 = 10%. This is the number that appears in headlines and exchange filings, and it is technically correct — but economically misleading for anyone buying at market price.
The real yield
Dividend ₹0.10 ÷ CMP ₹594 = 0.0168% (~0.02%). Buying at the announcement-window price of about ₹530 gives roughly 0.02% as well. In cash terms, ₹1 lakh invested returns roughly ₹17 a year in dividend.
Why is the yield so low? Not because the price crashed or the business is weak — the opposite. Skipper has kept the dividend fixed at ₹0.10 for years while both earnings and the share price rose sharply. A rising denominator (price) and a frozen numerator (dividend) mathematically drive the yield towards zero. This is a classic sign of a growth-and-reinvestment stock, where returns are expected via capital appreciation rather than dividend income.
Dividend History Analysis
| Financial Year | Dividend / Share | EPS (₹) | Payout Ratio |
|---|---|---|---|
| FY2025-26 | ₹0.10 | 18.36 | ~1% |
| FY2024-25 | ₹0.10 | 12.93 | ~1% |
| FY2023-24 | ₹0.10 | 6.61 | ~1% |
| FY2022-23 | ₹0.10 | 2.90 | ~3% |
| FY2021-22 | ₹0.10 | 2.53 | ~4% |
| FY2020-21 | ₹0.10 | 1.87 | ~5% |
| FY2019-20 | ₹0.10 | 3.67 | ~2% |
| FY2018-19 | ~₹0.24 | 2.76 | ~8% |
| FY2015-16 to FY2017-18 | ~₹1.37–1.61 (to verify) | 8–11 | ~13–15% |
The pattern
Skipper has paid exactly ₹0.10 for seven consecutive years (FY2019-20 to FY2025-26). It is a reliable payer, but a token one. Before that, the company paid meaningfully larger dividends (in the ₹1.37–1.61 range in FY16–FY18) that were sharply cut to ₹0.10 around FY20, after profits collapsed in FY19–FY20.
The forensic point
Even after earnings fully recovered — EPS rose from ₹3.67 (FY20) to ₹18.36 (FY26), a five-fold jump — the dividend was never restored. The payout ratio has therefore fallen from double digits to well under 1%. The board is deliberately keeping cash inside the business.
Classification: Consistent payer of a nominal (token) dividend, following a historical dividend cut that has not been reversed. Note that pre-FY19 per-share figures are drawn from third-party dividend databases and should be verified against Skipper's annual reports before republication.
Financial Performance Analysis
FY2025-26 was, by the company's own description, a record year. Because Skipper's subsidiaries are small, its standalone and consolidated numbers are almost identical; the figures below are on a standalone basis (which closely tracks consolidated). Sources: company filings and Screener.in.
| Metric (₹ Cr) | FY2024-25 | FY2025-26 | Growth |
|---|---|---|---|
| Revenue | 4,624 | 5,553 | +20.1% |
| Operating Profit (EBITDA) | 455 | 575 | +26.4% |
| Net Profit (PAT) | 146 | 207 | +41.8% |
| EPS (₹) | 12.93 | 18.36 | +42.0% |
| Operating Margin | ~10% | ~10% | Stable |
Operating leverage in action
Revenue grew 20%, EBITDA grew 26%, and PAT grew 42%. Profit is expanding faster than sales — the mark of positive operating leverage. As Skipper's high-fixed-cost manufacturing plants run at higher utilisation and interest costs stay broadly flat, each extra rupee of revenue drops more efficiently to the bottom line. This is the favourable side of the ledger, and it is a genuine business strength.
Cash Flow Analysis
Reported profit is an accounting opinion; cash is a fact. So we test whether the profit is converting into real cash, and whether the dividend is funded by operations, reserves, or borrowing.
Operating Cash Flow (FY26)
₹277 Cr
OCF is 1.34× net profit — healthy cash conversion
Free Cash Flow (FY26)
–₹88 Cr
Negative due to ~₹272 Cr growth capex
Reading the two numbers together
Operating cash flow of ₹277 Cr comfortably exceeds reported PAT of ₹207 Cr, so the earnings are backed by cash at the operating level. However, free cash flow is negative at about –₹88 Cr because the company is spending heavily on capacity — capital work-in-progress roughly doubled to ₹273 Cr as Skipper scales towards 450,000 tonnes of engineering capacity.
Is the dividend funded by cash?
The dividend outflow is only about ₹1.13 Cr. That is trivially small next to ₹277 Cr of operating cash flow, so the dividend itself is fully funded by current-year operations. The negative free cash flow is driven by expansion capex, not by the dividend. One caveat worth flagging honestly: a receivables build-up pushed debtor days up from 55 to 98 during the year, which the company should keep under control.
Balance Sheet Strength
Net Worth (FY26)
~₹1,475 Cr
Book value ~₹131 per share
Total Borrowings (FY26)
~₹931 Cr
Up ~₹220 Cr from ₹711 Cr in FY25
ROCE
~23.5%
Return on capital employed
ROE
~16.3%
3-year average is lower at ~13.7%
Return ratios are respectable, with ROCE of about 23.5% exceeding the company's cost of capital. The watch-item is debt: borrowings rose by roughly ₹220 Cr in FY26 to fund working capital and capex, taking net debt to around ₹915 Cr. Cash and investments on the balance sheet are modest (about ₹16 Cr), which is normal for a working-capital-heavy EPC-cum-manufacturing business but means the company relies on borrowing lines rather than a cash pile. This rising-debt backdrop is precisely why management is conserving cash and paying only a token dividend.
Dividend Sustainability Analysis
We run four independent coverage tests. For a dividend this small, the question is not "can they afford it" (obviously yes) but "what does the tiny payout tell us about capital-allocation intent".
| Coverage Test | Result | Verdict |
|---|---|---|
| Earnings coverage (EPS ÷ DPS) | ~184× | Very strong |
| Operating cash flow coverage | ~246× | Very strong |
| Free cash flow coverage | Negative FCF | Not covered by FCF, but immaterial |
| Cash & investments coverage | ~14× | Adequate |
Composite verdict: Sustainable (but token)
The dividend is covered 184 times over by earnings and 246 times by operating cash. Free cash flow is negative, but that is because of growth capex — the ₹1.13 Cr dividend is a rounding error against the ₹88 Cr FCF gap and is easily met from operating cash. There is essentially zero risk of this dividend being cut for affordability reasons. The more meaningful message is strategic: with earnings compounding at 40%+ and debt rising, the board is signalling it would rather reinvest than distribute. Income-focused investors should not expect a step-up soon.
Peer Comparison
| Company | Dividend / Share | Approx. Yield | Approx. Payout |
|---|---|---|---|
| Skipper Ltd | ₹0.10 | ~0.02% | ~1% |
| Kalpataru Projects Intl | ₹11.00 | ~0.8% | ~15–18% |
| KEC International | ₹5.50 | ~1.0% | Not independently verified |
Even measured against its own low-yielding transmission-and-distribution EPC peers, Skipper stands out as the lowest dividend yielder of the group. Kalpataru Projects and KEC International both pay roughly 0.8–1.0%, several times Skipper's 0.02%. Blank or "not verified" cells are left intentionally empty rather than filled with estimates. The comparison reinforces the core theme: within a sector that already prioritises reinvestment over payout, Skipper sits at the extreme retention end.
Promoter Impact Analysis
Promoter Holding (Jul 2026)
61.48%
Down ~5.02 percentage points in the quarter
Promoter Share of This Dividend
~₹0.69 Cr
61.48% of the ~₹1.13 Cr outflow
Who benefits, and by how much
Of the total ₹1.13 Cr dividend, roughly ₹69 lakh flows to the promoter group and about ₹44 lakh to public and institutional shareholders. Because the dividend is so small, it is not a meaningful cash-extraction route for promoters — unlike companies where a large payout disproportionately rewards a controlling family.
The bigger ownership story
More significant than the dividend is the drop in promoter holding from 66.50% to 61.48% in the July 2026 shareholding data — a fall of about 5 percentage points. Over the same period, FII holding rose from around 4.1% to 10.64%, suggesting the promoters likely pared their stake to institutional buyers. Investors should track the reason and any pledge details in the latest shareholding disclosures, as this shift matters far more to the equity story than a ₹0.10 dividend.
Taxation Analysis
Since April 2020, dividends in India are taxed in the hands of the shareholder at their applicable income-tax slab rate — the era of tax-free dividends is over. Companies also deduct TDS (tax deducted at source) under Section 194 where the aggregate dividend from that company crosses the annual threshold (raised to ₹10,000 per company for FY2025-26 in the 2025 Budget; please verify before filing).
Worked example — retail investor holding 1,000 shares
| Dividend per share | ₹0.10 |
| Shares held | 1,000 |
| Gross dividend | ₹100 |
| TDS (below ₹10,000 threshold) | ₹0 |
| Tax at 30% slab (on filing) | ₹30 |
| Net dividend in hand | ₹70 |
| Post-tax effective yield (cost ~₹5.94 lakh) | ~0.012% |
The practical takeaway: for a modest retail holding, no TDS is deducted (the ₹100 dividend is far below the threshold), but the ₹100 is still added to taxable income and taxed at the investor's slab. After a 30% tax, the investor keeps ₹70 — a post-tax yield of roughly 0.012%. In other words, tax treatment is almost academic here because the dividend amount is so small.
Key Risks
- Negligible income return: At ~0.02% yield, this stock offers effectively no dividend income. It is unsuitable for investors whose objective is regular cash flow.
- Rising debt: Borrowings increased by about ₹220 Cr in FY26 to ~₹931 Cr; Screener flags the cost of borrowing as high. Continued debt-funded expansion adds financial risk if order execution slows.
- Working-capital stretch: Debtor days rose from 55 to 98 during FY26. An EPC-linked business with elongating receivables can see cash flow lag reported profit.
- Promoter stake reduction: Promoter holding fell about 5 percentage points to 61.48% in the latest data. The rationale and any pledging need monitoring.
- Cyclical, order-book dependent demand: Revenue depends on government and utility transmission capex and exports; delays in power-sector spending or export weakness (Middle East, freight costs) can hit growth.
- Thin cash buffer: On-balance-sheet cash is small, so the company leans on credit lines rather than internal reserves during downcycles.
What To Monitor
- Order book and inflows: Track the ₹8,500 Cr+ order book and new order wins (Skipper announced ~₹1,305 Cr of orders in late August 2026) as the lead indicator of future revenue.
- Debt trajectory and interest cost: Watch whether borrowings stabilise once the capacity build (towards 450,000 tonnes) completes, and whether interest costs ease.
- Receivables / debtor days: Monitor whether the jump to 98 debtor days reverses, which would confirm the profit is turning into cash.
- Free cash flow turning positive: Once the current capex cycle tapers, FCF should recover from negative; that is the trigger that could eventually justify a higher payout.
- Promoter and FII holding: Follow subsequent shareholding filings to understand the recent ~5-point promoter reduction and rising FII interest.
- Margin durability: Check whether the ~10% operating margin and 40%+ profit growth hold up as the base grows and export conditions shift.
Conclusion
Skipper Limited's FY2025-26 final dividend of ₹0.10 per share is best understood as a symbolic gesture rather than a financial reward. The "10% dividend" headline reflects the ₹1 face value; the real yield is about 0.02%. The payout is bullet-proof in terms of affordability — covered roughly 184 times by earnings — precisely because it is so small.
Positives
- Record FY26: revenue +20%, PAT +42%
- Strong positive operating leverage
- Healthy ROCE (~23.5%) and cash conversion
- Large, growing order book
Negatives / Cautions
- Effectively no dividend income (~0.02%)
- Debt up ~₹220 Cr; negative FCF on capex
- Debtor days rose to 98
- Promoter holding down ~5 points
The dividend is a footnote to Skipper's real story, which is growth, reinvestment and rising debt. Whether that mix suits you depends entirely on whether you are seeking income (this is not the stock for it) or long-term capital appreciation from an infrastructure-capex cycle. This article presents the facts, positives and risks so you can decide for yourself.
Frequently Asked Questions
What dividend has Skipper Limited announced for FY2025-26?
What is the Skipper dividend yield?
What is the record date for the Skipper dividend?
What is the ex-date for the Skipper dividend?
When will the Skipper dividend be paid?
Who is eligible to receive the Skipper dividend?
How is the Skipper dividend taxed?
Is the Skipper dividend sustainable?
What is Skipper's dividend history?
Why is Skipper's dividend so small if profits are growing?
How does Skipper's yield compare with peers?
What should investors monitor going forward?
Disclaimer
This article is for informational and educational purposes only and does not constitute investment, financial, legal or tax advice, nor any buy, sell or hold recommendation. ShareBazaar Online is not a SEBI-registered investment adviser or research analyst. Figures are drawn from company filings and publicly available third-party sources (including Screener.in and exchange disclosures) and may contain errors or become outdated; market-price-dependent figures such as yield change continuously and must be re-verified against live data before any decision. Dividend details, record date, ex-date and payment date are subject to AGM approval and official NSE/BSE confirmation. Investments in securities are subject to market risks; please read all related documents carefully and consult a qualified, registered financial adviser before investing. The author and publisher accept no liability for any loss arising from the use of this information.