
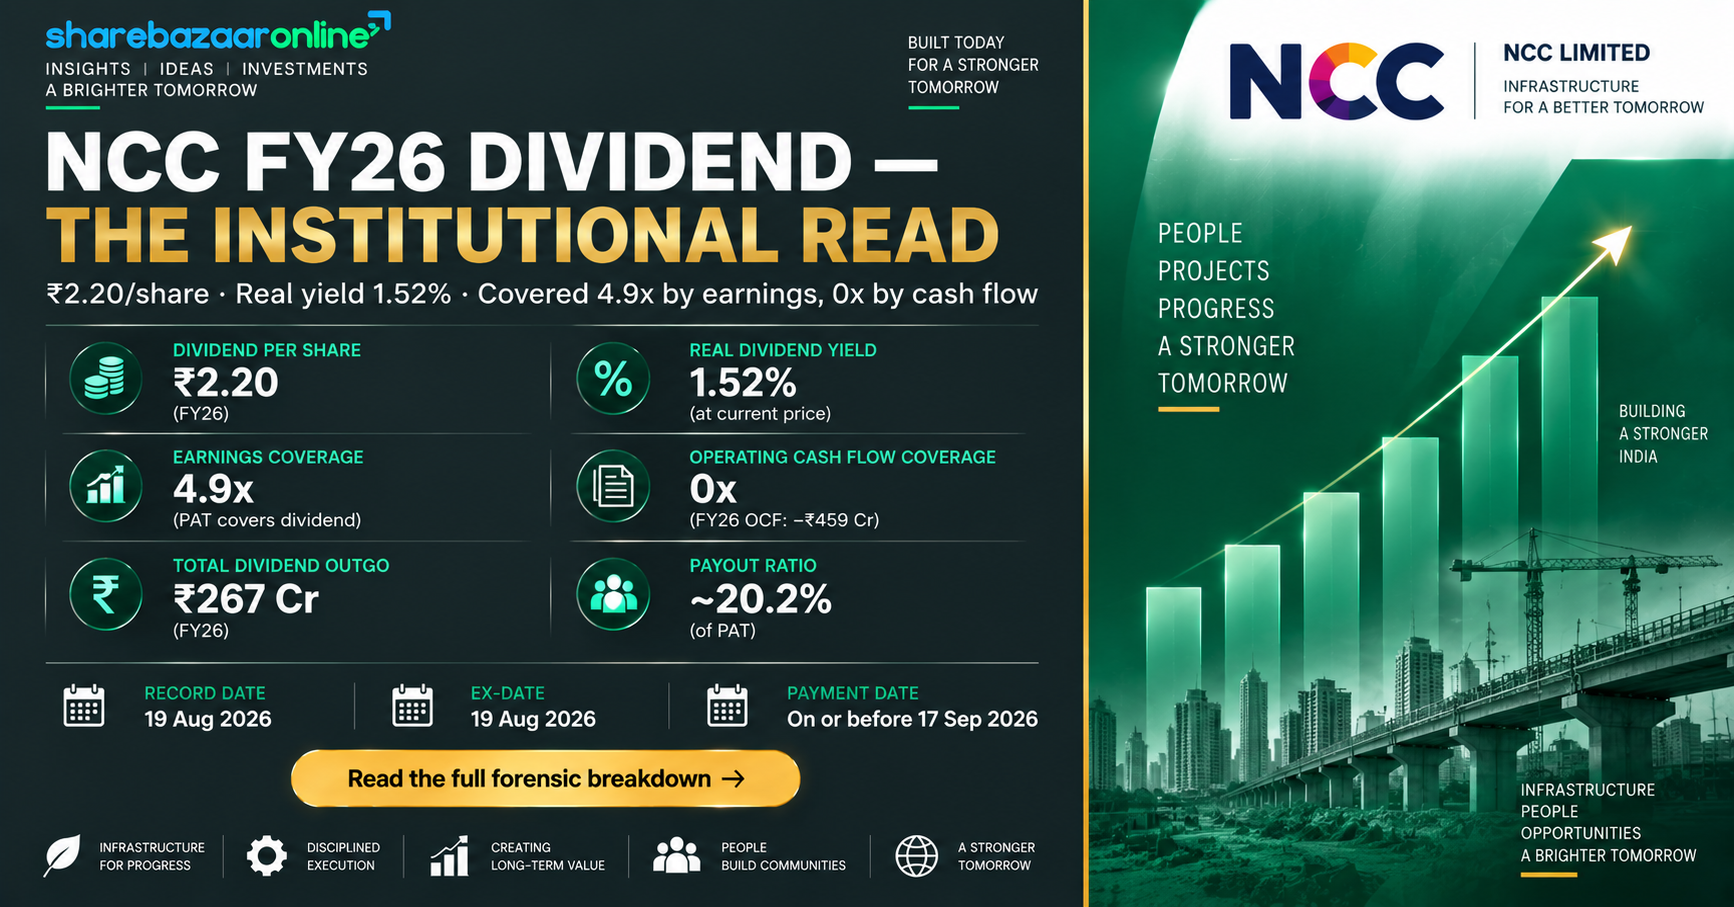
NCC Dividend 2026: Snapshot
NCC Limited (NSE: NCC, BSE: 500294) has declared a final dividend of ₹2.20 per equity share for the financial year 2025-26, on a face value of ₹2. In percentage terms the company describes this as a 110% dividend — but that figure is calculated on the tiny ₹2 face value, not on the market price. At the current share price of about ₹145, the real cash-in-hand dividend yield works out to just 1.52%. This NCC dividend 2026 payout keeps the per-share amount unchanged for the fourth year running.
Payout at a glance
- Dividend type: Final Dividend (FY2025-26)
- Dividend per share: ₹2.20
- Dividend on face value: 110% (face value ₹2)
- Real dividend yield (at ₹145): 1.52%
- Record date: 14 August 2026 (Friday)
- Total dividend outflow: ₹138.13 crore
The one non-obvious finding
The dividend is comfortably covered by profits (earnings cover it about 4.9 times), yet in FY26 it was not covered by cash flow. NCC's consolidated operating cash flow turned negative at ₹459 crore and free cash flow was ₹1,401 crore negative, while borrowings jumped by ₹1,863 crore. So this year the cash to keep the business and dividend going effectively came from fresh debt, not from operations. That is the single most important thing to understand about this payout.
Dividend Announcement Summary
NCC Limited's Board of Directors recommended the FY2025-26 final dividend at its meeting held on 15 May 2026, alongside the company's audited annual results. Through a Regulation 42 filing dated 15 May 2026 (Ref. NCCL/Reg 42/2026, signed by Executive Director A G K Raju), the company fixed Friday, 14 August 2026 as the record date for determining eligible shareholders.
The dividend was recommended by the Board subject to shareholder approval at the Annual General Meeting held on 27 August 2026. Per stock-exchange disclosures, the 36th AGM resolutions were passed and the ₹2.20 per share dividend was approved on 27 August 2026. NCC operates as one of India's large diversified EPC (engineering, procurement and construction) contractors, with a consolidated order book of about ₹83,004 crore as of 31 March 2026.
Key identifiers
Company: NCC Limited (formerly Nagarjuna Construction Company) • NSE Symbol: NCC • BSE Code: 500294 • ISIN: INE868B01028 • CIN: L72200TG1990PLC011146 • Face Value: ₹2 • Sector: Infrastructure / Civil Construction.
Key Dates Timeline
| Event | Date | Status |
|---|---|---|
| Board meeting / announcement | 15 May 2026 | Confirmed (filing) |
| Ex-dividend date | 14 August 2026 | Inferred under T+1 (same as record date) — verify against NSE/BSE circular |
| Record date | 14 August 2026 (Friday) | Confirmed (filing) |
| AGM (approval) | 27 August 2026 | Approved |
| Payment date | Within 30 days of AGM (statutory outer limit) | Not separately disclosed by company |
Note: Under India's T+1 settlement cycle, the ex-date and record date usually coincide. The exact ex-date should be confirmed against the official NSE/BSE corporate-action circular. Statutorily, an approved dividend must be paid within 30 days of the AGM.
NCC Dividend Yield Analysis: The Face-Value Illusion
The most misread number in any Indian dividend headline is the percentage. NCC's "110% dividend" is calculated on the ₹2 face value of the share (₹2 × 110% = ₹2.20). It has nothing to do with what you actually paid for the stock. To know your real return, you divide the ₹2.20 by the market price.
Yield on face value (the headline)
110%
Impressive-sounding, but purely a function of the small ₹2 face value. Not a real-world return.
Real dividend yield (on market price)
1.52%
₹2.20 ÷ ₹145 current market price. This is the yield that matters to an investor buying today.
On the announcement day (around 15 May 2026), NCC traded near ₹163, so the yield at that point was about 1.35%. The yield has since risen to roughly 1.52% — but chiefly because the share price fell, not because the dividend grew. The stock is down about 35% from its 52-week high of ₹222. A rising yield driven by a falling price is a very different signal from a yield rising because the payout increased.
All yield figures are price-dependent and should be re-checked against the live market price before acting on them.
NCC Dividend History Analysis
NCC has paid a dividend consistently for over two decades — more than 24 distinct payouts since 2003. All figures below are on the current ₹2 face value, so they are directly comparable (no stock split or bonus has affected the last decade).
| Financial Year | Dividend / Share | Type |
|---|---|---|
| FY2025-26 | ₹2.20 | Final |
| FY2024-25 | ₹2.20 | Final |
| FY2023-24 | ₹2.20 | Final |
| FY2022-23 | ₹2.20 | Final |
| FY2021-22 | ₹2.00 | Final |
| FY2020-21 | ₹0.80 | Final |
| FY2019-20 | ₹0.20 | Final (COVID cut) |
| FY2018-19 | ₹1.50 | Final |
| FY2017-18 | ₹1.00 | Final |
| FY2016-17 | ₹0.40 | Final |
| FY2015-16 | ₹0.60 | Final |
What the pattern shows
The dividend rose steadily from ₹0.40 (FY17) to ₹2.20, then flatlined at ₹2.20 for four straight years (FY23 to FY26). NCC did cut its dividend sharply to ₹0.20 during the COVID year (FY20) but restored it quickly. There have been no suspensions in the last decade.
Classification
Consistent Payer — but a stagnant one at the current level. Despite earnings per share more than doubling from ₹4.40 (FY21) to a peak of ₹13.06 (FY25), the per-share dividend has not moved beyond ₹2.20 since FY23. Dividend growth has effectively stalled.
Financial Performance Analysis (Consolidated)
| Metric (₹ Cr, consolidated) | FY2024-25 | FY2025-26 | Change |
|---|---|---|---|
| Revenue | 22,354.91 | 20,944.40 | -6.3% |
| EBITDA | ~1,918 | 1,836.08 | -4.3% |
| Profit before tax | ~1,187 | ~952 | -19.8% |
| Net profit (owners) | 819.88 | 675.32 | -17.6% |
| EPS (₹) | 13.06 | 10.76 | -17.6% |
| Interest cost | ~680 | ~745 | +9.6% |
Standalone FY26: revenue ₹17,669.28 crore, net profit ₹576.76 crore. Figures sourced from company results and Screener.in; minor differences exist between "revenue" and "total income" definitions across data providers.
The operating leverage story: why profit fell faster than sales
This is the analytical heart of NCC's FY26. Revenue slipped 6.3% and EBITDA fell a milder 4.3% — but net profit dropped a much steeper 17.6%. The gap is explained below the operating line: interest costs rose about 9.6% to roughly ₹745 crore and depreciation also ticked up. Higher finance costs — a direct result of the sharp rise in borrowings during the year — magnified a modest operating decline into a heavy bottom-line decline. In short, NCC suffered negative operating leverage in FY26.
Cash Flow Analysis: Profits Are Opinions, Cash Is Fact
A company can report a healthy profit and still generate no cash. That is exactly what happened at NCC in FY26. On a consolidated basis it posted a net profit of ₹675 crore, yet its cash from operations was negative at about ₹459 crore (versus a positive ₹742 crore the year before). Free cash flow was deeply negative at roughly ₹1,401 crore.
Where did the cash go?
Into working capital. As NCC executes a record order book, receivables and inventories build up before the company gets paid. Debtor days rose from 55 to 66, inventory days from 85 to 129, and working-capital days from 48 to 81. Management commentary through FY26 repeatedly cited slower project cash flows and delayed government payments, especially in water projects.
How was the gap plugged?
With fresh borrowing. Financing activities brought in a net ₹878 crore, and total borrowings jumped from ₹1,594 crore to ₹3,457 crore — an increase of ₹1,863 crore. Even so, the overall cash balance fell by about ₹346 crore over the year.
The practical takeaway: the FY26 dividend of ₹138 crore was not funded by current cash generation. It came from the company's large accumulated reserves and, at the margin, the same debt that funded the working-capital build. For a company executing an ₹83,000 crore order book, a working-capital-driven cash squeeze is not unusual — but it deserves to be watched closely rather than waved away.
Data note: at least one third-party data feed reports FY26 operating cash flow as positive ₹458.51 crore (same magnitude, opposite sign). The negative figure used here is internally consistent with the reported financing inflow and the ₹346 crore fall in net cash. The exact sign should be confirmed against the audited FY26 cash-flow statement in the annual report.
Balance Sheet Strength
The cushion
NCC has a solid net worth of roughly ₹7,869 crore (equity capital ₹126 crore plus reserves of about ₹7,743 crore), giving a book value near ₹125 per share. The ₹138 crore dividend is a tiny 1.78% of reserves. The stock trades at just above book value (about 1.16x), and return on capital employed (ROCE) was a respectable 16.8%.
The pressure point
Borrowings nearly doubled to ₹3,457 crore in FY26. Return on equity (ROE) softened to about 9.2% for the year, below the company's own three-year average of roughly 10.5%. Rating agency CARE Ratings continues to track the company, and management has publicly prioritised working-capital discipline and deleveraging.
In plain terms: the balance sheet is strong enough to easily absorb this dividend many times over. The concern is not affordability from reserves; it is the direction of debt and working capital, which moved the wrong way in FY26.
Dividend Sustainability Analysis
| Coverage Test | Result (FY26) | Verdict |
|---|---|---|
| Earnings coverage (EPS ÷ DPS) | 4.89x | Strong |
| Operating cash flow coverage | Negative (OCF -₹459 Cr) | Fails this year |
| Free cash flow coverage | Negative (FCF -₹1,401 Cr) | Fails this year |
| Liquidity / reserves coverage | Outflow = 1.78% of reserves | Ample cushion |
Composite verdict: Moderately Sustainable
Two of the four tests pass emphatically. The dividend is a small slice of profit (payout ratio around 20.5%), earnings cover it nearly five times over, and it barely dents a ₹7,700+ crore reserve base. That points to a payout that is easily affordable and likely to continue.
The cash-flow tests, however, failed in FY26. A dividend that has to lean on reserves and borrowings in a weak-cash year is not an immediate danger — NCC's scale and reserves make that manageable — but it is a reminder that the payout is being sustained through a soft patch, not out of surplus cash. If negative operating cash flow persists for a second or third year, the sustainability picture would weaken. On balance we classify it as Moderately Sustainable: safe on earnings and balance sheet, on watch for cash flow.
Peer Comparison
| Company | Latest DPS | Dividend Yield | Payout Ratio | ROE |
|---|---|---|---|---|
| NCC Ltd | ₹2.20 | 1.52% | ~20% | ~9.2% |
| Larsen & Toubro | ₹38.00 | ~0.94% | ~17% | — |
| Kalpataru Projects | ₹11.00 | ~0.79% | ~25% | — |
| PNC Infratech | ₹0.60 | ~0.33% | ~3% | ~12.6% |
| KNR Constructions | — | Low | — | ~16.4% |
Blank cells indicate figures not independently verified at the time of writing. Peer data from public sources; yields are price-dependent.
Yield reality check
On the surface, NCC offers the highest dividend yield in this EPC peer set — above L&T, Kalpataru and PNC Infratech. But that ranking is misleading. NCC's yield looks high largely because its share price has fallen about 28% over the past year and roughly 35% from its high, while the dividend itself has been frozen at ₹2.20. The peers with lower yields are, in most cases, growing their dividends off rising prices. A high yield here reflects price weakness more than payout generosity.
Promoter Impact Analysis
Who gets the ₹138 crore?
Promoters hold 23.09% of NCC (as of June 2026), so about ₹31.9 crore of the total dividend flows to the promoter group. The public and retail shareholders, who together own the largest chunk at 47.75%, receive roughly ₹66 crore.
Ownership structure
Promoters 23.09% • FIIs 11.29% • DIIs 17.88% • Public 47.75%. Notably, promoter holding has crept up (from 22% to 23.09%) while foreign institutional holding has fallen sharply over the past two years — domestic institutions have absorbed much of that selling.
Because NCC has a relatively low promoter holding, this dividend is comparatively more beneficial to minority and retail shareholders than at a typical promoter-heavy company: over three-quarters of the payout goes to non-promoter shareholders. The dividend does not disproportionately reward insiders.
Dividend Taxation Analysis
Since April 2020, dividends in India are taxable in the hands of the shareholder at their individual income-tax slab rate (the old Dividend Distribution Tax was abolished). The company also deducts TDS at 10% before paying, but only if your total dividend from that company in a financial year exceeds ₹10,000 (10% assumes a valid PAN; without PAN it is 20%).
Worked example — retail investor
Suppose you hold 1,000 NCC shares and are in the 30% tax slab:
- Gross dividend: 1,000 × ₹2.20 = ₹2,200
- TDS deducted: ₹0 (below the ₹10,000 threshold)
- Tax payable at 30% slab: ₹660
- Net dividend in hand: ₹1,540
- Net effective yield (at ₹145): about 1.06%
You would need to hold more than 4,545 NCC shares before the ₹10,000 TDS threshold kicks in on this dividend. Any TDS deducted can be adjusted against your final tax liability when you file your return.
This is a simplified illustration for education only, not tax advice. Your actual liability depends on your total income, chosen tax regime and applicable cess/surcharge. Consult a qualified tax professional.
Key Risks
- Cash-flow quality: FY26 saw negative operating and free cash flow. If working-capital pressure and delayed government payments persist, cash generation could stay weak even if profits look adequate.
- Rising debt and interest cost: Borrowings almost doubled to ₹3,457 crore and interest expense rose to about ₹745 crore. Higher finance costs are already eating into profit and could compress it further if debt keeps climbing.
- Earnings decline: Revenue, EBITDA and net profit all fell in FY26, with profit down about 17.6%. A construction slowdown, execution delays or margin pressure would strain future payouts.
- Government-client concentration: As a public-sector-heavy EPC contractor, NCC is exposed to project award cycles, payment delays and policy shifts largely outside its control.
- Stagnant dividend and price weakness: The per-share dividend has been flat at ₹2.20 for four years while the stock has fallen sharply; the "high yield" is partly a symptom of that price decline, not a sign of strength.
What To Monitor
- Operating cash flow in FY27: The single most important number. Watch whether NCC returns to positive OCF or whether the negative FY26 figure repeats.
- Working-capital days: Track debtor days (66), inventory days (129) and overall working-capital days (81) each quarter for signs the cash cycle is normalising.
- Debt trajectory: Monitor total borrowings and the interest-cost line. Management has flagged deleveraging as a priority — check whether that actually happens.
- Order-book execution: With a record ₹83,004 crore backlog, revenue conversion and execution pace determine whether the cash squeeze eases.
- Dividend policy signals: Any move to lift the payout above ₹2.20, or any hint of a cut, given four years of a frozen dividend.
Conclusion
NCC Limited's FY2025-26 final dividend of ₹2.20 per share is a story of two very different signals. On the positive side: the payout is easily affordable, covered nearly five times by earnings, a small fraction of a large reserve base, weighted toward retail and minority shareholders, and backed by a two-decade record of consistent payments and a record order book.
On the cautionary side: FY26 was a soft year. Revenue and profit fell, operating and free cash flow turned negative, borrowings nearly doubled, and the dividend was effectively sustained through reserves and debt rather than fresh cash. The apparently attractive 1.52% yield is inflated by a falling share price, not a growing dividend that has been frozen at ₹2.20 for four years.
The balance of evidence points to a payout that is affordable and likely to continue, but one that investors should read alongside the cash-flow and debt trends rather than in isolation. The positives, negatives, risks and monitoring points are laid out above so you can weigh them for yourself.
Frequently Asked Questions
What dividend has NCC Limited announced for FY 2025-26?
What is the NCC dividend yield in 2026?
What is the record date for the NCC dividend?
What is the NCC dividend ex-date?
When will the NCC dividend be paid?
Who is eligible to receive the NCC dividend?
How is the NCC dividend taxed?
Is the NCC dividend sustainable?
What is NCC's dividend history?
Why is NCC's dividend yield higher than peers like L&T?
What should investors monitor after this dividend?
How much dividend do NCC promoters receive?
Disclaimer
This article is for informational and educational purposes only and does not constitute investment, financial, legal or tax advice, nor any recommendation to buy, sell or hold any security. ShareBazaar Online is not a SEBI-registered investment adviser or research analyst. Figures are drawn from the company's stock-exchange filings and publicly available financial data sources (including Screener.in and company results) and may contain errors or be subject to revision; several are computed or inferred and should be independently verified against primary filings and the audited annual report. All share prices, market capitalisation and yield figures are price-dependent and change continuously — re-verify against the live market price before acting. Dividend approval, record-date, ex-date and payment-date details should be confirmed on the official NSE, BSE and company disclosures. Past performance and past dividends are not indicative of future results. Please consult a SEBI-registered adviser and a qualified tax professional before making any investment decision.