
Dividend Snapshot
Suryalata Spinning Mills Ltd (BSE: 514138 · NSE: SURYALA · ISIN: INE132C01027) has declared a Final Dividend of ₹2 per equity share for the financial year 2025-26. On a face value of ₹10, that headline reads as a 20% dividend — but the real, price-based yield is only about 0.48% at the current market price. There is a second, unusual twist that most wire reports miss: this dividend is being paid only to non-promoter (public) shareholders. The promoters have voluntarily waived their entire dividend.
Dividend Per Share
₹2.00
20% on face value of ₹10
Dividend Type
Final Dividend
For FY 2025-26
Real Dividend Yield
~0.48%
₹2 ÷ ₹418 CMP (Screener, 10-Sep-2026)
Who Gets Paid
Public Only
Promoters (70.36%) waived their share
Record Date: 14 August 2026
Payment Date: 23 September 2026
Board Recommendation: 27 May 2026
AGM Approval: 24 August 2026
Dividend Announcement Summary
At its board meeting on 27 May 2026, the board of Suryalata Spinning Mills recommended a final dividend of ₹2 per equity share (20%) for the year ended 31 March 2026, alongside its audited standalone and consolidated results. The recommendation was placed before shareholders and approved at the Annual General Meeting held on 24 August 2026.
The distinctive feature of this payout is its structure. As disclosed by the company and reported by data aggregators (Groww, Simply Wall St), the dividend is declared to non-promoter equity shareholders only — the promoter group voluntarily foregoes its dividend entitlement. This is not a one-off gesture: the promoters similarly waived their dividend for FY 2021-22, and again for the ₹3 per share FY 2021-22 payout approved at the September 2022 AGM. In effect, the promoter family channels the entire declared dividend to public shareholders while keeping the corresponding cash inside the business.
Why it matters: because promoters hold 70.36% of the equity, waiving their portion cuts the company's actual cash outgo dramatically. Our calculation (detailed in the Promoter Impact section) shows the real outflow is roughly ₹0.25 crore rather than the ₹0.85 crore that a normal all-shareholder dividend would have cost.
Key Dates Timeline
| Event | Date | Status |
|---|---|---|
| Board Recommendation (with FY26 results) | 27 May 2026 | Confirmed from filing |
| Record Date | 14 August 2026 | Confirmed from BSE filing |
| Ex-Dividend Date | On/around 14 August 2026 | Inferred under T+1 — verify vs exchange circular |
| Register / Book Closure (for AGM) | 17–24 August 2026 | Confirmed from filing |
| AGM Approval | 24 August 2026 | Confirmed |
| Dividend Payment Date | 23 September 2026 | As reported |
To be eligible, an investor needed to hold shares as of the record date of 14 August 2026. The exact ex-date should be reconciled against the official NSE/BSE corporate-action circular, since ex-dates are inferred under the T+1 settlement convention unless explicitly stated in a primary filing.
Dividend Yield Analysis
The face-value yield illusion. The company declared a "20%" dividend. That 20% is calculated on the ₹10 face value, not on what you pay for the share. A retail investor buying at the market price of about ₹418 earns a real cash yield of only:
₹2 ÷ ₹418 × 100 = 0.48%
So the "20%" headline overstates the real income return by more than 40 times. Always read a dividend percentage as a face-value figure until you convert it to a price-based yield.
Yield at Current Price (₹418)
0.48%
Screener, 10-Sep-2026
Yield Near Announcement Window
~0.51%
On approx ₹390 (exact close: Not Disclosed by Company / to be verified)
The yield has hovered in a narrow 0.4%–0.8% band in recent years, moving mostly with the share price rather than with a rising payout. Over the past year the stock re-rated sharply (the 52-week range is roughly ₹280 to ₹519), which mechanically compressed the yield even though the dividend per share held at ₹2. In short, the low yield here is a function of a re-rated share price on a small, deliberately restrained dividend — not a distressed one.
Dividend History Analysis
Dividend per share by ex-date (face value ₹10 throughout; no stock split or bonus in the period, so figures are directly comparable). Source: Trendlyne / exchange records.
| Ex-Date | Dividend Per Share | Type |
|---|---|---|
| 14 Aug 2026 (record date) | ₹2.00 | Final (non-promoter only) |
| 19 Sep 2025 | ₹2.00 | Final |
| 25 Jul 2024 | ₹2.00 | Final |
| 21 Sep 2023 | ₹3.00 | Final (non-promoter only) |
| 16 Sep 2021 | ₹2.00 | Final |
| 17 Sep 2020 | ₹1.00 | Final |
| 19 Sep 2019 | ₹1.80 | Final |
| 06 Aug 2018 | ₹1.50 | Final |
| 28 Aug 2017 | ₹1.50 | Final |
| 20 Sep 2016 | ₹2.00 | Final |
| 2004–2015 (10 more payouts) | ₹1.50–₹3.00 | Final |
Suryalata has declared 19 dividends since 2004 — a long, unbroken record for a small-cap textile spinner. The pattern is that of a consistent but conservative payer: the dividend has stayed in a ₹1.00–₹3.00 per share range for two decades and has not scaled up with profits. There is no dividend suspension in this window, though the amount was trimmed to ₹1.00 in the FY20 (COVID) year before recovering. The recurring theme — promoters routing their share of the dividend to the public — makes the "per share" figure more meaningful for a public investor than the aggregate payout suggests.
Financial Performance Analysis
Consolidated figures in ₹ crore unless stated. Source: Screener.in (consolidated).
| Metric | FY23 | FY24 | FY25 | FY26 |
|---|---|---|---|---|
| Revenue | 484 | 453 | 495 | 484 |
| Operating Profit | 61 | 45 | 38 | 51 |
| Operating Margin (OPM) | 13% | 10% | 8% | 11% |
| Other Income | 3 | 1 | 5 | 15 |
| Net Profit (Consolidated) | 34 | 19 | 15 | 35 |
| EPS (₹, Consolidated) | 79.12 | 43.71 | 36.02 | 83.10 |
Operating leverage: revenue has been broadly flat at roughly ₹480–495 crore for four years — this is a mature, capacity-constrained spinner, not a growth story. Profit, by contrast, swung hard: consolidated net profit fell from ₹34 crore (FY23) to just ₹15 crore (FY25) as operating margin compressed from 13% to 8% amid weak yarn spreads, then rebounded to ₹35 crore in FY26 as margins recovered to 11%. So the story is a margin cycle, not a volume cycle.
A one-time item flatters FY26. Note the jump in "Other Income" to ₹15 crore in FY26 from ₹5 crore the year before. Almost all of it — about ₹13.26 crore — landed in the December-2025 quarter as a single exceptional other-income item (nature not disclosed in the summary financials; to be confirmed from the notes to accounts). Stripping this out (net of roughly 23% tax) lowers underlying FY26 consolidated profit to about ₹25 crore and underlying EPS to roughly ₹59. The headline ₹35 crore / ₹83.10 EPS therefore overstates the recurring earning power of the business.
Standalone vs consolidated. On a standalone basis (the parent spinning business alone), FY26 revenue was about ₹490 crore and net profit about ₹28.94 crore (Groww / exchange filing). The gap versus the ₹35 crore consolidated figure reflects the contribution of the wholly-owned solar subsidiary, Suntree Solar Energy Pvt Ltd (a ~10 MW captive plant), plus the one-time other income. For a dividend view, the standalone number is the more relevant gauge of cash-generating capacity at the listed parent.
Cash Flow Analysis
Consolidated figures in ₹ crore. Source: Screener.in (consolidated).
| Cash Flow | FY23 | FY24 | FY25 | FY26 |
|---|---|---|---|---|
| Operating Cash Flow (OCF) | 81 | 40 | 29 | 49 |
| Investing Cash Flow | -64 | -68 | 8 | -62 |
| Financing Cash Flow | -14 | 23 | -38 | 12 |
| Free Cash Flow (FCF) | 19 | -37 | 28 | -3 |
Cash quality is good; free cash flow is lumpy. Operating cash flow of ₹49 crore in FY26 comfortably exceeds reported consolidated profit — a sign that earnings are backed by real cash, not just accounting entries. The company's own CFO-to-operating-profit conversion runs at 83%–152% over the last four years, which is healthy.
But free cash flow swings with the capex cycle. FCF was negative ₹3 crore in FY26 and negative ₹37 crore in FY24, because the company keeps reinvesting (₹62 crore of investing outflow in FY26, likely modernisation and the solar plant). Over the four years FY23–FY26, cumulative FCF is only about +₹7 crore. The key point for dividends: because the actual cash dividend is tiny (about ₹0.25 crore), even a negative-FCF year does not threaten it — but it does tell you the business consumes most of its own cash in capex, which is precisely why the dividend is kept small.
Balance Sheet Strength
Net Worth (FY26)
~₹298 Cr
Reserves ₹294 Cr + equity capital ₹4 Cr
Borrowings (FY26)
~₹85 Cr
Debt-to-equity ~0.29x
Book Value Per Share
~₹700
Stock trades at ~0.6x book
Cash & Equivalents
Thin
Exact current figure: Not Disclosed by Company (verify from AR)
The balance sheet has de-levered materially — debt-to-equity fell from around 0.9x five years ago to roughly 0.29x now. A net worth of about ₹298 crore against ₹85 crore of borrowings is comfortable, and interest is covered several times over by operating profit. The one caveat is that the company runs with very little idle cash: it deploys nearly all surplus into fixed assets and working capital, funding day-to-day needs through working-capital borrowing. That is normal for a spinner, but it is also the structural reason the dividend is kept modest — there is no large cash pile to distribute from.
Dividend Sustainability Analysis
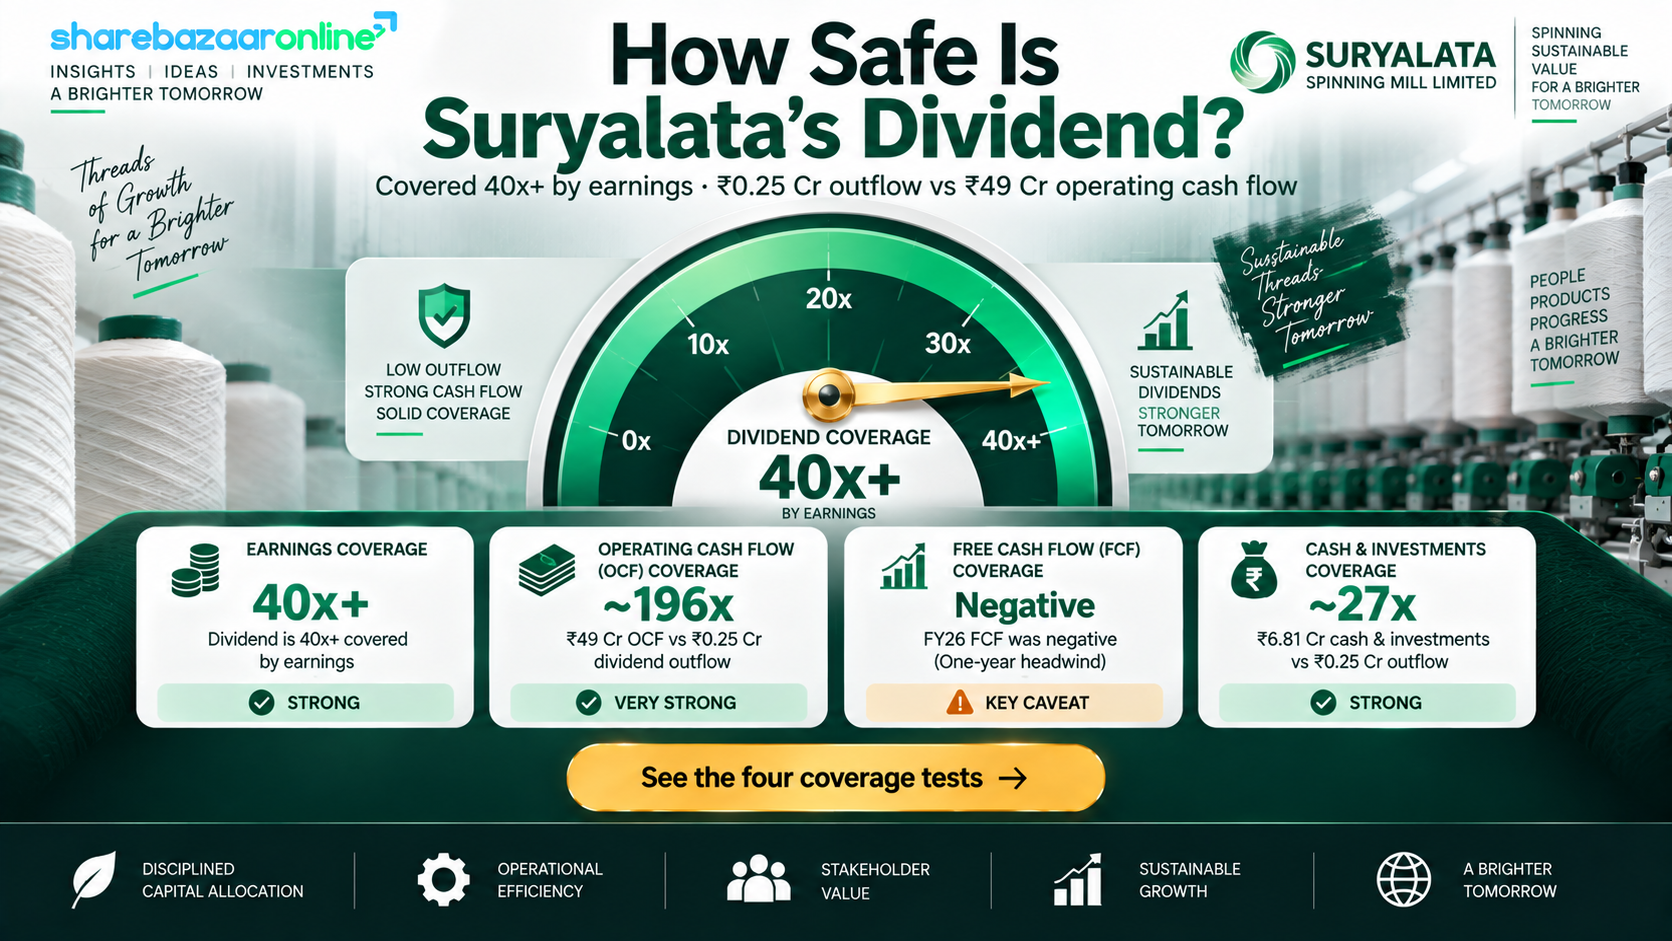
| Coverage Test | Reading | Verdict |
|---|---|---|
| Earnings coverage (EPS ÷ DPS) | ~41.5x consolidated (~33.9x standalone) | Very strong |
| Payout ratio (outflow ÷ PAT) | ~0.7% of consolidated profit | Extremely low |
| OCF coverage | ₹49 Cr OCF vs ~₹0.25 Cr outflow | Very strong |
| FCF coverage (current year) | FY26 FCF negative (-₹3 Cr) | Weak in-year, but outflow trivial |
| Cash/liquidity coverage | Cash thin, but outflow immaterial | Adequate for this payout size |
Composite verdict: Sustainable. The dividend is one of the most easily covered you will find — earnings cover it more than 40 times, and the actual cash needed (about ₹0.25 crore because promoters waive their share) is a rounding error against ₹49 crore of operating cash flow. The only technically "failing" test is single-year free cash flow, which is negative in FY26; but that is driven by capex, not by distress, and the payout is far too small to be affected. The real constraint on this dividend is policy, not affordability — management deliberately retains cash to reinvest, so the risk is not that the ₹2 becomes unaffordable, but that it stays flat while profits and the share price move around it.
Peer Comparison
Small-cap synthetic/blended-yarn spinners. Blank cells are left intentionally unpopulated where a figure could not be independently verified (marked NIV) rather than estimated.
| Company | Dividend Yield | Payout Ratio | ROE (3-yr) | Price / Book |
|---|---|---|---|---|
| Suryalata Spinning Mills | ~0.48% | ~0.7% (actual outflow) | ~9% | ~0.6x |
| Suryaamba Spinning Mills | ~0.79% | ~25% | ~3.2% | NIV |
| Shri Dinesh Mills | NIV | NIV | NIV | ~0.65x |
| Winsome Textile Industries | NIV | NIV | NIV | ~0.44x |
Against small-cap spinning peers, Suryalata's yield of about 0.48% is modest and roughly in line with the sector's typically low payouts — sister-style peer Suryaamba yields around 0.79% on a higher 25% payout. Where Suryalata stands out is capital efficiency and valuation: a stronger three-year ROE (~9%) than several peers and a price of about 0.6x book value. The trade-off is a deliberately thin payout ratio. Investors comparing purely on yield will find richer options; those looking at value plus a token, minority-friendly dividend will read Suryalata differently.
Promoter Impact Analysis
This is where Suryalata's dividend is genuinely unusual. Promoters — the Agarwal family, holding 70.36% (about 30.02 lakh of the ~42.67 lakh total shares) — receive nothing from this payout. The entire declared dividend flows to the 29.64% non-promoter (public) block.
Actual Company Cash Outflow
~₹0.25 Cr
₹2 × ~12.65 lakh non-promoter shares
Cost If Promoters Were Also Paid
~₹0.85 Cr
₹2 × ~42.67 lakh total shares
Dividend Promoters Forego
~₹0.60 Cr
₹2 × ~30.02 lakh promoter shares
Promoter Dividend Income
₹0
Voluntarily waived
How to read this. On the positive side, it is minority-friendly: the public shareholder captures 100% of the per-share dividend, and the cash the promoters give up (~₹0.60 crore) stays inside the company, strengthening reserves. On the sceptical side, the sums are small in absolute terms, and a recurring "promoters waive dividend" structure can also signal a broader policy of retaining cash within the family-controlled business rather than a large, growing cash return. Either way, the promoters are clearly not extracting cash through the dividend route — a governance point worth noting positively.
Taxation Analysis
Since the abolition of the Dividend Distribution Tax in FY 2020-21, dividends are taxed in the hands of the shareholder at their applicable income-tax slab rate and reported under "Income from Other Sources." There is no separate flat rate and no exemption specific to dividends.
TDS rule (current, FY 2025-26 onward): under Section 194, the company deducts TDS at 10% only if your total dividend from that single company in the financial year exceeds ₹10,000 (this threshold was raised from ₹5,000 in Budget 2025). Without a PAN, TDS is 20%. Most retail holders of Suryalata will stay below ₹10,000 and face no TDS — but the dividend is still fully taxable at your slab rate at return-filing time. (Source: Income Tax Act, Section 194; Budget 2025.)
Worked example — a retail investor with 1,000 shares
| Shares held (non-promoter) | 1,000 |
| Gross dividend (1,000 × ₹2) | ₹2,000 |
| TDS deducted (below ₹10,000 threshold) | ₹0 |
| Tax at 30% slab + 4% cess (31.2%) | ₹624 |
| Net dividend in hand after tax | ₹1,376 |
| Effective after-tax yield (at ₹418) | ~0.33% |
For a 30%-slab investor, a "20%" headline dividend translates into a real, post-tax income return of roughly one-third of one percent. Investors in lower slabs keep proportionately more.
Key Risks
- Margin cyclicality: profit swings sharply with polyester/viscose yarn spreads — consolidated net profit more than halved from ₹34 crore (FY23) to ₹15 crore (FY25) before recovering. Earnings, and therefore any future dividend growth, are inherently volatile.
- Flat top line: revenue has been stuck near ₹480–495 crore for four years. Without volume growth, dividend increases depend entirely on the margin cycle.
- One-time-item dependence in FY26: the strong FY26 headline profit leaned on a ~₹13 crore exceptional other-income item in the December-2025 quarter; underlying recurring earnings are meaningfully lower.
- Thin liquidity and negative single-year FCF: the company holds little cash and free cash flow was negative in FY26 owing to capex, leaving limited room for a step-up in cash returns.
- Low free float and volatility: with promoters at 70.36% and about 5,000 public shareholders, the stock is thinly traded and highly volatile (among the more volatile Indian small-caps), which amplifies price-driven swings in the yield.
- Concentrated, family-controlled ownership: capital-allocation and dividend policy are effectively set by the Agarwal promoter family; minority holders have limited influence over payout decisions.
What To Monitor
- Operating margin trend: whether OPM holds the recovered ~11% level or slips back toward the 8% FY25 trough — the single biggest driver of profit and future dividends.
- Recurring vs one-time profit: whether FY27 profit is sustained on core operations once the FY26 exceptional other income drops out of the base.
- Free cash flow and capex: whether the current capex cycle converts into higher revenue and positive, repeatable FCF, or continues to absorb operating cash.
- Dividend policy vs profit growth: whether the board ever lets the ₹2 per share scale with earnings, or continues to keep it flat regardless of profit.
- Solar subsidiary contribution: the earnings and cash contribution from Suntree Solar Energy, which explains much of the consolidated-vs-standalone profit gap.
- Continuation of the promoter waiver: whether promoters keep foregoing their dividend, and whether that reflects a durable minority-friendly stance.
Conclusion
Positives
- Unbroken 20-year dividend record (19 payouts since 2004).
- Dividend extraordinarily well covered by earnings and operating cash flow.
- Minority-friendly structure — promoters waive their share; public gets 100% of the per-share payout.
- De-levered balance sheet (D/E ~0.29x) and stock at ~0.6x book value.
Negatives / Watch-outs
- Real yield is just ~0.48% — the "20%" is a face-value illusion.
- Flat revenue; profit driven by a volatile margin cycle.
- FY26 profit flattered by a ~₹13 crore one-time item.
- Thin cash and negative single-year FCF; dividend kept deliberately small.
Suryalata's FY26 dividend is best understood as a small, symbolic, minority-friendly payout from a deep-value, cyclical spinner — not an income play. The interesting story here is structural (promoters routing the entire dividend to the public and retaining their share of the cash) and valuational (a profitable business trading below book), rather than the yield itself. We present the positives, negatives, risks and monitoring points above so you can weigh them against your own objectives.
Frequently Asked Questions
What dividend has Suryalata Spinning Mills announced for FY 2025-26?
What is the real dividend yield of Suryalata Spinning Mills?
Why is the dividend paid only to non-promoter shareholders?
What is the record date for the dividend?
What is the ex-dividend date?
When will the dividend be paid?
Who is eligible for this dividend?
How is the dividend taxed?
Is the dividend sustainable?
What is Suryalata's dividend history?
Why did FY26 profit jump so much?
What should investors monitor going forward?
What is the difference between the standalone and consolidated numbers?
Disclaimer
This article is for informational and educational purposes only and does not constitute investment advice, a research report, or any buy, sell or hold recommendation. ShareBazaar Online is not a SEBI-registered investment adviser or research analyst. Figures are drawn from publicly available sources including company exchange filings, Screener.in, Trendlyne, Groww and Simply Wall St, and from our own calculations; some data points are labelled as approximate, inferred or "Not Disclosed by Company" where they could not be independently verified. All yield and price-dependent figures are based on a market price of approximately ₹418 as of 10 September 2026 and will change as the price changes. Readers must verify all data against primary company filings and consult a qualified, registered financial adviser before making any investment decision. ShareBazaar Online accepts no liability for actions taken on the basis of this content.