
Dividend Snapshot
Mangalam Cement Limited (NSE: MANGLMCEM, BSE: 502157), a B.K. Birla Group cement maker selling under the Birla Uttam brand, has recommended a final dividend of ₹1.50 per equity share of face value ₹10 for the financial year ended 31 March 2026. The dividend was recommended by the Board on 16 May 2026 and approved by shareholders at the 50th Annual General Meeting held on 21 August 2026.
Dividend Per Share
₹1.50
15% on face value of ₹10
Real Dividend Yield (at CMP ₹1,050)
0.14%
Yield on market price, not on face value
Dividend Type
Final
One payout per year, post Q4 results
Total Dividend Outflow
₹4.12 Cr
Matches cash-flow "dividend paid" line
The headline you should not misread: A "15% dividend" sounds large, but that 15% is calculated on the ₹10 face value, not on the market price. Against a market price of around ₹1,050, the same ₹1.50 works out to a real cash yield of just 0.14%. Mangalam Cement is a capital-appreciation cement stock, not an income stock — a distinction we unpack throughout this analysis.
Dividend Announcement Summary
In its board meeting outcome dated 16 May 2026 (Reference MCL/SEC/2026-27), Mangalam Cement disclosed to the exchanges under SEBI (LODR) Regulation 30 that the Board of Directors, at its meeting held on 16 May 2026, recommended a final dividend of ₹1.50 (Rupee one and paisa fifty) per equity share of ₹10 each for FY2025-26, subject to shareholder approval at the ensuing AGM. The company reports on a standalone basis only — it has one reportable segment (cement) and no material subsidiaries requiring consolidation — so every figure in this analysis uses the audited standalone accounts.
What was announced
- Final dividend of ₹1.50 per share (FY26)
- Audited standalone results for the year ended 31 March 2026, with an unmodified audit opinion from Singhi & Co.
- Record date fixed at 14 August 2026
- 50th AGM scheduled for 21 August 2026 via video conferencing
Approval status
The dividend was recommended by the Board and became final upon approval by shareholders at the AGM held on 21 August 2026, where the ₹1.50 dividend was among the resolutions passed. The company separately raised its borrowing limit to ₹3,000 crore at the same meeting.
Key Dates Timeline
| Event | Date | Status / Basis |
|---|---|---|
| Board recommendation (announcement) | 16 May 2026 | Confirmed from filing |
| Ex-date | 14 August 2026 | Inferred (T+1 convention); not separately stated in the primary filing |
| Record date | 14 August 2026 | Confirmed from filing (Regulation 42) |
| Annual General Meeting (50th AGM) | 21 August 2026 | Confirmed — dividend approved |
| Payment date | Not disclosed by company | Statutory outer limit is within 30 days of AGM approval (i.e. on or before ~20 September 2026) |
Read the ex-date carefully. The company's filing fixes only the record date (14 August 2026). Under India's T+1 settlement, the ex-date typically falls on the record date. The exact payment date was not disclosed in the announcement; in prior years the company paid roughly a month after the AGM (for example, the FY25 dividend was paid on 21 September 2025).
Dividend Yield Analysis
Dividend yield is the single most misread number in retail dividend coverage. A yield is only meaningful when measured against the price you actually pay in the market — not against the accounting face value printed on the share certificate.
The face-value illusion
₹1.50 on a ₹10 face value = 15%. This is the "dividend percentage" the company declares. It does not represent your cash return.
The real yield
₹1.50 ÷ latest market price of ~₹1,050 = 0.14%. On the announcement-day price (~₹850, approximate — the exact 16 May 2026 close is not independently verified), the yield was roughly 0.18%.
To put the 0.14% real yield in context: a typical liquid savings account or short-term debt fund pays multiples of that. Mangalam Cement's yield sits well below the Indian market's median dividend yield and far below the broader materials-sector average. If you are buying MANGLMCEM, the investment case rests on cement-cycle earnings and stock appreciation — the dividend is a token, not a reason to own it for income.
Dividend History Analysis
| Financial Year | Dividend Per Share | Payout Ratio |
|---|---|---|
| FY26 | ₹1.50 | ~3% |
| FY25 | ₹1.50 | ~9% |
| FY24 | ₹1.50 | ~7% |
| FY23 | ₹1.50 | ~24% |
| FY22 | ₹1.50 | ~5% |
| FY21 | ₹1.50 | ~4% |
| FY20 | ₹1.00 | ~4% |
| FY19 | ₹0.50 | Loss year |
| FY18 | ₹0.50 | ~12% |
| FY17 | ₹0.75 | ~5% |
Dividend history compiled from public dividend-history records (TipRanks, INDmoney); payout ratios from Screener.in. Figures are per share and not restated, as no bonus or split has affected the recent period.
Classification: Consistent but frozen payer
The dividend has stayed flat at ₹1.50 for six consecutive years (FY21 to FY26). Before that it stepped up from ₹0.50 to ₹1.00 to ₹1.50. The company pays every year but has not raised the dividend even once during a period when revenue crossed ₹1,750 crore.
What the flat line signals
A dividend held constant while profits swing is a management choice to retain cash for capex and debt, not a progressive dividend policy. Note the loss years (FY16, FY19) where payout ratios turned negative — a reminder that this is a cyclical business whose profits, and therefore its capacity to pay, can compress sharply.
Financial Performance Analysis
The most important finding in this entire report: Mangalam Cement's FY26 net profit of ₹128.95 crore — up a dramatic 186% from ₹45.06 crore in FY25 — is heavily flattered by a one-time tax credit, not by an operating boom. Reading the headline PAT at face value would badly overstate the underlying earnings power that supports the dividend.
Reported profit and loss (FY26, standalone)
- Revenue from operations: ₹1,758.41 Cr (FY25: ₹1,680.99 Cr, +4.6%)
- Profit before exceptional items & tax: ₹115.95 Cr
- Exceptional items (charge): ₹21.76 Cr
- Profit before tax: ₹94.19 Cr
- Net tax line: a credit of ₹34.76 Cr
- Reported net profit: ₹128.95 Cr; EPS ₹46.90
The one-time items driving the jump
- Deferred-tax credit of ~₹54.08 Cr from remeasuring deferred tax on switching to the concessional Section 115BAA regime (25.168%). This turned the tax line into a net credit.
- Exceptional charge of ₹21.76 Cr: a ₹20.52 Cr provision (50% of an outstanding petcoke supplier advance where port delivery failed) plus ₹1.23 Cr from the new Labour Codes.
Normalised earnings: the number that matters for dividends
Strip out the one-time tax reversal and apply a normal 25.168% tax to the reported ₹94.19 Cr PBT, and normalised net profit is roughly ₹70.5 Cr, giving a normalised EPS of about ₹25.6 — not ₹46.90. In other words, reported EPS is roughly 83% higher than the underlying run-rate. On a like-for-like basis, underlying profit still grew (about +56% over FY25's ₹45 Cr, helped by lower power and fuel intensity and a better product mix), but nowhere near the 186% the headline suggests. Screener's own machine-generated note flags that the "tax rate seems low" for exactly this reason.
Cash Flow Analysis
Reported profit is an accounting opinion; cash is a fact. And on the cash statement, FY26 tells a very different story from the headline profit.
Operating cash flow collapsed
Net cash from operations fell to ₹93.97 Cr in FY26, roughly half of FY25's ₹187.63 Cr. Operating profit before working-capital changes was strong at ₹235 Cr, but a working-capital drain — inventories up ₹43 Cr and payables down ₹77 Cr — pulled cash conversion (CFO to operating profit) down to about 40%, from 125% a year earlier. Inventory days ballooned to 427 from 326.
Free cash flow turned deeply negative
Capex surged to about ₹348 Cr (versus ₹125 Cr in FY25), driving free cash flow to approximately ₹-224 Cr. The company is in a heavy investment phase — a solar plant, capacity and mining bids — and is funding it partly with debt.
How is the ₹4.12 Cr dividend being funded?
Because free cash flow is negative, the dividend is not covered by current-year free cash flow. It is instead paid out of the company's existing liquidity and, in a year of rising borrowings, effectively alongside fresh debt. The saving grace is scale: at ₹4.12 Cr, the payout is tiny relative to both operating cash flow (₹94 Cr) and the ₹228 Cr liquid pool, so affordability is not in question even though FCF does not cover it.
Balance Sheet Strength
Liquidity is comfortable
- Cash & cash equivalents: ₹8.3 Cr
- Other bank balances: ₹153.8 Cr
- Current investments: ₹66.4 Cr
- Liquid pool: ~₹228 Cr
- Net worth: ₹977 Cr; book value ~₹355/share
But debt has risen sharply
- Total borrowings + leases: ~₹888 Cr (FY25: ~₹627 Cr, up ~42%)
- Debt-to-equity: about 0.91x
- Finance cost: ₹64.04 Cr for the year
- AGM raised the borrowing ceiling to ₹3,000 Cr, signalling more capex-linked debt ahead
The balance sheet comfortably supports a ₹4.12 Cr dividend — that is not the concern. The point worth watching is the direction: borrowings jumped by roughly ₹261 Cr in a single year while the dividend stayed flat. Debt is being raised for growth capex, not to fund distributions, but the rising leverage and the higher borrowing ceiling are the reason management has kept the payout deliberately small.
Dividend Sustainability Analysis
We assess sustainability across four independent coverage tests, then give a composite verdict.
| Coverage Test | Result | Read |
|---|---|---|
| Earnings coverage (EPS ÷ DPS) | 31.3x reported / ~17x normalised | Very strong either way |
| Operating cash flow coverage | CFO ₹94 Cr vs ₹4.12 Cr outflow | Strong (~23x) |
| Free cash flow coverage | FCF ~₹-224 Cr | Not covered (negative FCF year) |
| Liquidity / cash coverage | ~55x (liquid pool ₹228 Cr) | Very strong |
Composite verdict: Sustainable
Three of the four tests pass comfortably; only the FCF test fails, and it fails because of a deliberate, growth-oriented capex surge, not because the dividend is unaffordable. At a payout of just 3% of reported profit (about 6% normalised), the ₹1.50 dividend is one of the most easily covered payouts you will find. The realistic risk is not a cut — it is that the dividend stays frozen at ₹1.50 while the company prioritises capex and debt reduction, exactly as it has for six years.
Peer Comparison
| Company | Dividend Yield | Payout | ROE | ROCE |
|---|---|---|---|---|
| Mangalam Cement | ~0.14% | ~3% | 16.3% | 11.0% |
| JK Lakshmi Cement | ~0.8–1.1% | ~29% | ~10.6% | — |
| HeidelbergCement India | ~3.8% | — | — | — |
| The Ramco Cements | ~0.42% | — | — | — |
| J.K. Cement | ~0.21% | — | — | — |
Peer yields sourced from public data providers (Screener.in, INDmoney, SimplyWall.st). Cells marked "—" are left intentionally blank rather than populated with unverified figures. Peer metrics are point-in-time and price-dependent.
The peer set makes the picture plain: Mangalam Cement sits at the low end of the sector on both yield and payout. Income-oriented cement peers such as HeidelbergCement India (a low-growth, high-payout name) yield an order of magnitude more. Mangalam pairs a low dividend with an above-peer reported ROE (16.3%) that itself benefits from the one-time tax credit — its three-year average ROE is a more modest ~10%.
Promoter Impact Analysis
Shareholding (June 2026)
- Promoters (B.K. Birla Group): 40.01%
- FIIs: 5.53%
- DIIs: 6.17%
- Public: 48.30%
Who gets the ₹4.12 Cr
- Promoter share of dividend: ~₹1.65 Cr
- Public + institutions: ~₹2.47 Cr
Promoter holding has climbed steadily — from about 32% in FY23 to 40% now — through creeping acquisition, so a rising slice of any future dividend flows to the promoter group. But the tiny absolute payout means dividends are not the mechanism by which value is being returned to the promoter; the value is in the equity stake itself. The flat, low dividend is consistent with a promoter group content to reinvest in the business rather than distribute cash.
Taxation Analysis
Since the abolition of the Dividend Distribution Tax in 2020, dividends in India are taxed in the hands of the shareholder. The dividend is added to your total income and taxed at your applicable income-tax slab rate under "Income from Other Sources". The company deducts TDS at 10% before payment only if your total dividend from that company in a financial year exceeds ₹10,000 (20% if you have not furnished a PAN).
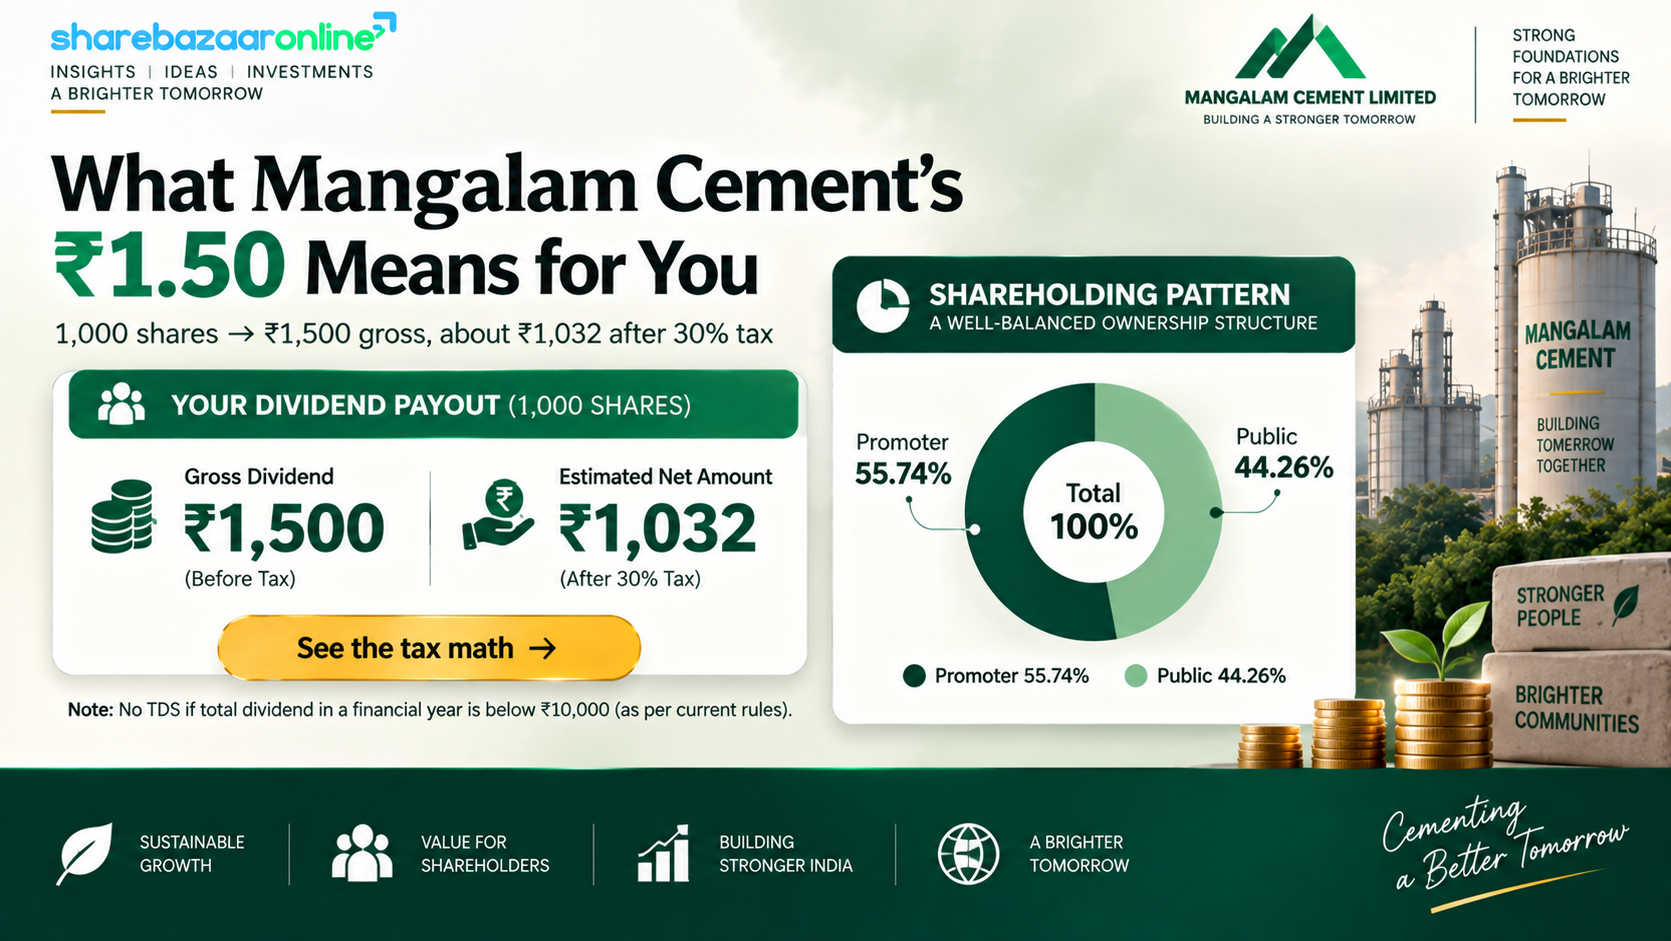
Worked example — retail investor holding 1,000 shares
- Gross dividend: 1,000 × ₹1.50 = ₹1,500
- TDS at 10%: ₹0 — not triggered, because ₹1,500 is below the ₹10,000 threshold
- Tax at a 30% slab (plus 4% cess): ₹468
- Net dividend in hand: ₹1,032
- Pre-tax yield on ₹10.5 lakh invested (at ~₹1,050): ~0.14%; post-tax yield: ~0.10%
The takeaway for a high-slab investor: after tax, the effective yield on this dividend is roughly one-tenth of one percent. The dividend is a rounding error in the total-return equation; the stock lives or dies on capital appreciation.
Key Risks
- Earnings quality risk: FY26 profit is inflated by a ~₹54 Cr one-time deferred-tax credit. From FY27, the tax line normalises to ~25%, so reported profit and EPS can look sharply lower year-on-year even if the operating business is stable. Early evidence: Q1 FY27 PAT fell about 44% year-on-year.
- Rising leverage: Borrowings jumped ~42% to ~₹888 Cr in one year and the board has lifted the borrowing ceiling to ₹3,000 Cr, pointing to a capex-and-debt-heavy phase that will keep finance costs elevated and cap free cash flow.
- Weak cash conversion: Operating cash flow halved and CFO/operating-profit fell to ~40%, driven by a working-capital build-up (inventory days at 427). Persistent working-capital drag would pressure funding of capex.
- Cyclicality and input costs: Cement demand, pricing, and power/fuel and freight costs (together the bulk of the cost base) are volatile. The company has already booked loss years (FY16, FY19), so profits — and dividend capacity — can compress.
- Regional and scale concentration: As a ~4 MTPA North/Central India player competing against far larger integrated majors, Mangalam has less pricing power and less diversification than sector leaders.
- Recovery risk on the petcoke advance: Only 50% of the disputed foreign-supplier advance was provided; the remainder depends on an overseas legal recovery that may or may not succeed.
What To Monitor
- Normalised (post-tax-normalisation) profit trajectory: Watch FY27 quarterly PAT excluding one-offs to see the true earnings run-rate now that the concessional tax regime applies fully.
- Operating cash flow and working capital: Track whether CFO recovers toward operating profit and whether inventory days fall back from 427 — the key to funding capex without ever-rising debt.
- Debt level and finance cost: Monitor whether borrowings continue climbing toward the new ₹3,000 Cr ceiling and how quickly capex converts into revenue and EBITDA.
- Capex payback: The solar plant (15.17 MW, live since August 2026), capacity additions and mining bids should show up as lower power costs and higher volumes; watch realisation of these benefits.
- Dividend policy: Any move above the six-year-frozen ₹1.50 would signal management confidence that the capex phase is winding down.
- Cement price and demand cycle: Realisations and volumes in North/Central India drive the whole model — the single biggest swing factor for future dividend capacity.
Conclusion
Mangalam Cement's FY26 final dividend of ₹1.50 per share is a small, dependable payout from a financially sound but capital-hungry cement company. Two facts should anchor any reader's understanding. First, the "15%" dividend is a face-value figure; the real cash yield is about 0.14%, and roughly 0.10% after tax for a high-slab investor. Second, the eye-catching 186% jump in reported profit is largely a one-time tax accounting event — normalised earnings are closer to ₹70 Cr, not ₹129 Cr.
Positives
- Dividend extremely well covered by earnings, cash flow and liquidity
- Consistent 10-year payer; never suspended in a profitable year
- Underlying (normalised) profit still grew in FY26
- ~₹228 Cr liquid pool; solar and capacity investments underway
Negatives / watch-items
- Real yield of ~0.14% — not an income stock
- Dividend frozen at ₹1.50 for six years
- Free cash flow negative; borrowings up ~42%
- Reported profit and ROE flattered by a one-time tax credit
We present the positives, negatives, risks and monitoring factors so you can weigh them against your own objectives. This analysis does not offer any buy, sell or hold recommendation.
Frequently Asked Questions
What dividend has Mangalam Cement announced for FY26?
What is the real dividend yield of Mangalam Cement?
What was the record date for the dividend?
What is the ex-date for MANGLMCEM dividend?
When will the dividend be paid?
Who is eligible to receive the dividend?
How is the Mangalam Cement dividend taxed?
Is the Mangalam Cement dividend sustainable?
Why did Mangalam Cement's profit jump 186% in FY26?
What is Mangalam Cement's dividend history?
How does Mangalam Cement's yield compare with peers?
What should investors monitor going forward?
How many shares does Mangalam Cement have and how large is the payout?
Disclaimer
This article is for informational and educational purposes only and does not constitute investment advice, a recommendation, or an offer or solicitation to buy or sell any security. ShareBazaar Online is not a SEBI-registered investment adviser or research analyst. Company-disclosed figures are taken from Mangalam Cement Limited's audited standalone financial results and board-meeting outcome dated 16 May 2026. Market prices, yields, shareholding and peer data are sourced from third-party providers (including Screener.in, TipRanks, INDmoney and exchange filings) and are point-in-time; the current market price and all price-dependent yields must be re-verified before any decision. Certain figures — including the exact announcement-day closing price and the precise payment date — are not independently verified and are labelled accordingly. Normalised earnings figures are our own estimates for analytical purposes and are not company-reported numbers. Investments in equity shares are subject to market risks. Please read all related documents carefully and consult a qualified financial adviser before investing. Past performance is not indicative of future results.