
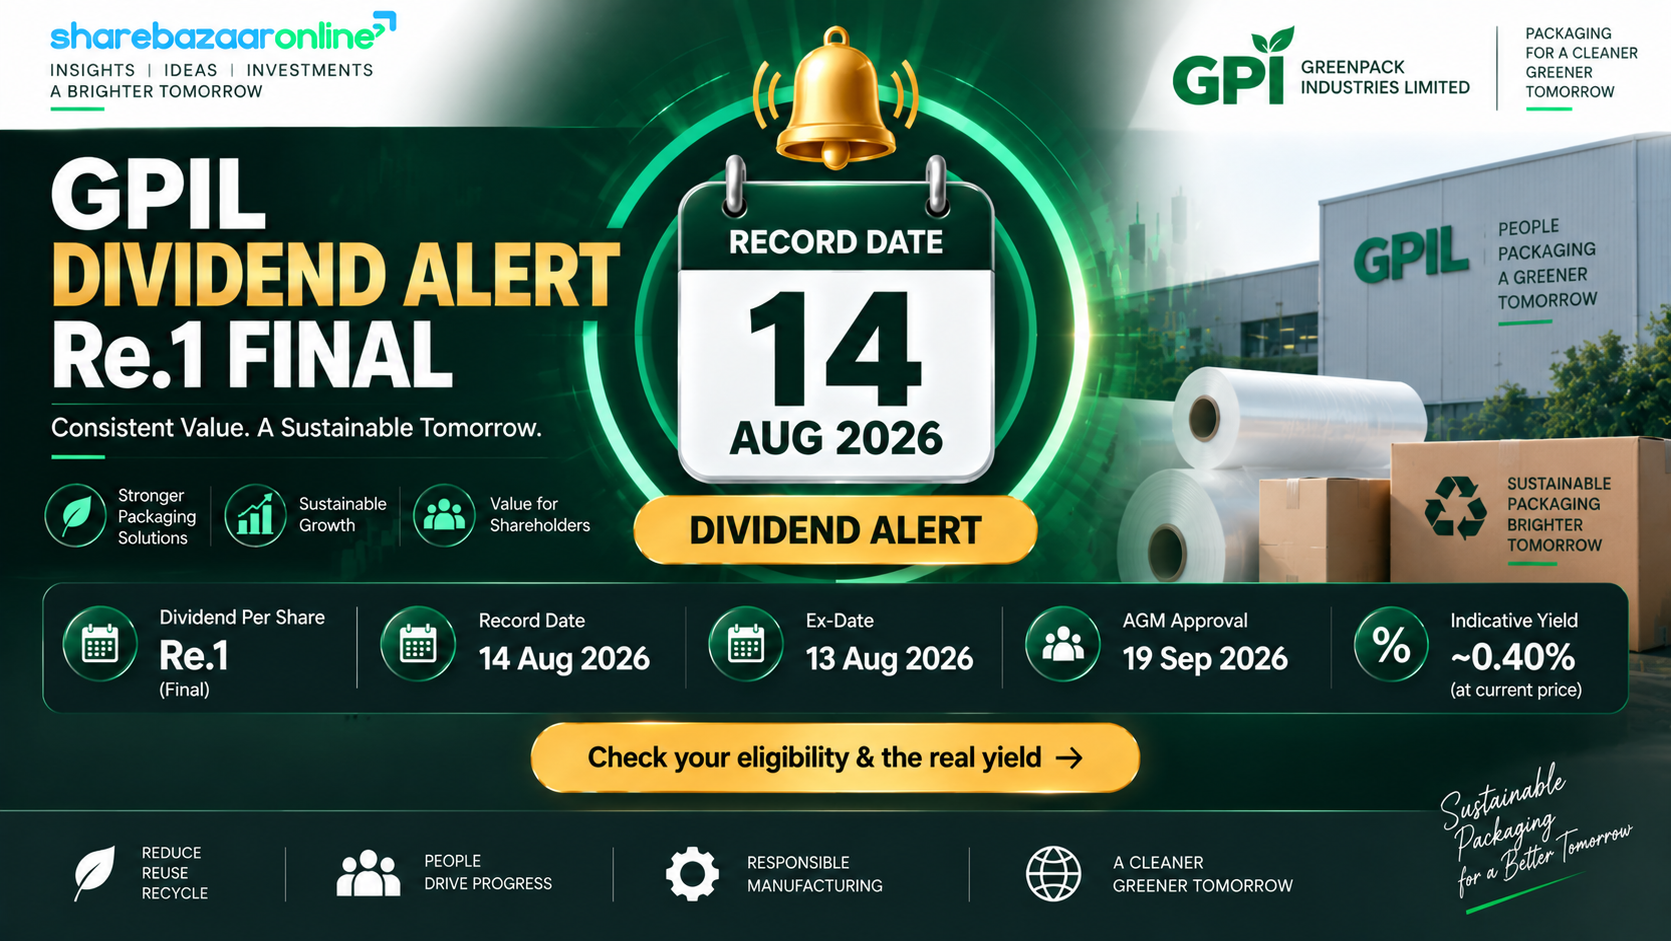
Dividend Snapshot
The one-line takeaway: GPIL's dividend is comfortably affordable — earnings cover it 13x, operating cash flow covers it ~18x, and the company sits on roughly ₹752 Cr net cash. But the yield is tiny because GPIL retains the vast majority of profits to fund a heavy capital-expenditure cycle (steel expansion, iron-ore pellets and a new battery-storage venture). Investors here are paid mainly through business growth and past capital appreciation, not dividend income.
Dividend Announcement Summary
At its Board Meeting held on 19 May 2026, the Board of Directors of Godawari Power and Ispat Limited recommended a final dividend of Re.1 per equity share (i.e. 100%) on shares of face value Re.1 each for the financial year ended 31 March 2026. The same Board meeting approved the audited standalone and consolidated results for Q4 and FY2025-26, with the statutory auditors (M/s Singhi & Co.) issuing unmodified opinions.
The dividend is "recommended" and remains subject to shareholder approval at the ensuing Annual General Meeting. Per the company's filing, once approved and declared at the AGM, payment (net of TDS) will be made within 30 days from the date of declaration.
The same meeting also cleared large capital-deployment decisions that matter for future payout capacity: an additional investment of up to ₹200 Crore in wholly-owned subsidiary Godawari New Energy Private Limited (GNEPL) for a Battery Energy Storage System (BESS) plant — taking the total commitment there toward ₹700 Crore — and a loan of up to ₹150 Crore to Godawari Education and Research Foundation.
Key Dates Timeline
| Event | Date | Status / Basis |
|---|---|---|
| Board Announcement | 19-May-2026 | Confirmed (filing) |
| Record Date | 14-Aug-2026 (Fri) | Confirmed (Regulation 42 filing) |
| Ex-Dividend Date | 14-Aug-2026 | Inferred (T+1 convention; verify vs NSE/BSE circular) |
| AGM (approval) | 19-Sep-2026 | Scheduled; dividend subject to approval |
| Payment | Within 30 days of AGM | Specific date not disclosed by company |
Note: The record date, ex-date and AGM date have already passed / are imminent relative to publication. The final dividend still requires ratification at the 19-Sep-2026 AGM before payment is released.
Dividend Yield Analysis
The face-value illusion
The company declared "100%" dividend. That 100% is measured against the Re.1 face value, not the market price. On a share you actually buy at around ₹253, Re.1 works out to a real cash yield of only ~0.40%. The headline percentage is a legal formality; the real yield is what lands in your bank account.
Yield across the price range
Why the yield is low — the real reason
A ~0.40% yield here is not a sign of a falling share price or weak business. It is a deliberate low-payout policy. GPIL pays out only about 8% of profit as dividend and reinvests the rest into capacity (steel, pellets, mining) and new bets (solar, battery storage). This is a growth-and-retention stock, not an income stock.
Dividend History Analysis
GPIL's per-share history must be read carefully because of two corporate actions: a face-value split from ₹10 to ₹5 with a 1:1 bonus (Oct 2021), and a later split from ₹5 to ₹1. Historic dividends are therefore restated to the current Re.1 face value below so the trend is comparable (Ind AS 33 basis).
| Financial Year | DPS (as declared) | Face Value then | DPS on ₹1 basis |
|---|---|---|---|
| FY2025-26 | ₹1.00 | ₹1 | ₹1.00 |
| FY2024-25 | ₹1.00 | ₹1 | ₹1.00 |
| FY2023-24 | ₹1.25 | ₹1 | ₹1.25 |
| FY2022-23 | ₹0.80 | ₹5* | ₹0.16* |
| FY2021-22 | ₹1.70 | ₹5* | ₹0.34* |
| FY2020-21 | ₹0.25 + ₹0.93 | ₹10* | Not fully verified |
*The exact effective date of the ₹5-to-₹1 split is being desk-verified; the restated figures for FY2022-23 and earlier are approximate and marked accordingly. Source for as-declared amounts: exchange dividend records.
Classification: Consistent Payer (recent), historically Cyclical
GPIL suspended dividends entirely in the FY2016–FY2020 period when it was carrying heavy debt. Since deleveraging around FY2021, it has paid an annual dividend every year (FY2021 through FY2026). On a Re.1 basis the recent cash dividend has been broadly stable at ₹1.00–₹1.25 per share. The company has also returned capital through share buybacks (a ₹250 Crore buyback with record date March 2023), which is a separate distribution channel not captured in the dividend line.
Financial Performance Analysis
Consolidated FY2025-26 vs FY2024-25
| Metric (₹ Cr) | FY26 | FY25 | Change |
|---|---|---|---|
| Revenue from operations | 5,380.65 | 5,375.73 | +0.1% |
| Operating profit (EBITDA) | ~1,263 | ~1,194 | +5.8% |
| Depreciation | 178.34 | 155.19 | +14.9% |
| Net Profit (owners) | 800.75 | 811.67 | −1.3% |
| EPS (basic, ₹) | 13.05 | 13.24 | −1.4% |
Operating leverage: margin up, profit slightly down
Here is the non-obvious part. Revenue was essentially flat (+0.1%), yet EBITDA rose ~5.8% as operating margin expanded from ~22% to ~23% (cost of materials consumed fell). Despite that operating strength, net profit slipped ~1.3%. The drag came from below-the-line items: depreciation jumped ~15% (as new capex was capitalised), and a consolidated exceptional loss of ₹18.29 Cr replaced a small prior-year gain. So the business earned more at the operating level but reported slightly less at the bottom line — a distortion driven by accounting depreciation and one-off items, not by demand.
Standalone caution: Standalone PAT of ₹919 Cr is flattered by ₹94.03 Cr of dividend income from joint ventures/associates and a ₹36.69 Cr exceptional gain on the Ardent Steel stake sale. Stripping these one-offs, indicative standalone operating profit is closer to ~₹789 Cr. For a holding-and-manufacturing group like GPIL, the consolidated numbers are the more reliable basis for judging dividend affordability.
Cash Flow Analysis
Cash quality is strong
Free cash flow is thin this year
How the dividend is funded: The dividend is funded comfortably out of current operating cash flow, not borrowings or asset sales. CFO of ₹1,157 Cr converts profit to cash at 1.44x — a healthy sign. However, free cash flow shrank to ~₹115 Cr because the company spent ~₹1,042 Cr on capex during the year. FCF still covers the ~₹65 Cr dividend about 1.8x, but the FCF cushion is much thinner than the earnings or cash cushion — a direct consequence of the current heavy investment phase.
Balance Sheet Strength
GPIL is effectively net-cash / almost debt-free. Total borrowings of ~₹427 Cr are dwarfed by ~₹1,179 Cr of liquid resources, leaving a net cash pile of roughly ₹752 Cr. Borrowings did rise modestly during the year (funding capex and the BESS venture), but this poses no threat to the dividend given the cash cushion. The balance sheet can absorb the ₹65 Cr payout many times over.
Dividend Sustainability Analysis
Four-test coverage scorecard (dividend outflow ~₹65 Cr)
| Test | Coverage | Verdict |
|---|---|---|
| Earnings coverage (EPS ÷ DPS) | 13.1x | Very strong |
| Operating cash flow coverage | ~17.8x | Very strong |
| Free cash flow coverage | ~1.8x | Adequate (capex year) |
| Liquidity / cash coverage | ~18.2x | Very strong |
Composite verdict: Sustainable. The payout is trivially small relative to earnings, operating cash and the cash pile. The only test that is merely "adequate" rather than "very strong" is free cash flow, which is compressed this year by ~₹1,042 Cr of capital spending — and even that still covers the dividend nearly 1.8x. The low ~8% payout ratio gives enormous headroom to maintain or grow the dividend even if profits dip in a cyclical steel downturn.
Peer Comparison
GPIL's ~0.40% yield is typical of the mid-cap ferrous pack — these are capital-appreciation stocks with low payout ratios, not income stocks. Cells left blank are not independently verified and should not be treated as confirmed.
| Company | DPS (latest) | Div Yield | P/E | ROE |
|---|---|---|---|---|
| Godawari Power & Ispat | ₹1.00 | ~0.40% | 20.8 | 15.3% |
| Sarda Energy & Minerals | ₹2.00 | ~0.39% | ~16.1 | — |
| Shyam Metalics & Energy | ₹2.25 | ~0.49% | — | — |
| Kirloskar Ferrous | ₹3.00 | ~1.6% | ~17.6 | — |
Peer figures are indicative, drawn from public market data on differing dates; verify before publication. GPIL row is derived from the audited filing and current market price.
Promoter Impact Analysis
Shareholding (Jun 2026)
Who gets the cash
Because the promoter group (the Agrawal family / Hira Group) owns ~63%, roughly ₹41 Cr of the ~₹65 Cr dividend flows to promoters. That is not unusual for a founder-led company, and the low overall payout means minority shareholders and promoters are treated identically per share — there is no preferential distribution. Note that promoter holding has drifted down modestly over the last three years (from ~67% to ~63%), partly reflecting stock splits, ESOP allotments and inter-se transmissions.
Taxation Analysis
How dividends are taxed in India
Since April 2020, dividends are taxed in the hands of the investor. The dividend is added to your total income and taxed at your applicable income-tax slab rate. The company deducts TDS at 10% under Section 194 if your total dividend from GPIL in a financial year exceeds ₹5,000 (10% TDS threshold; a PAN must be on record, else 20%). You can claim credit for TDS when filing your return.
Worked example — a 30% slab investor
| Holding | Gross dividend | TDS @10% | Tax @30% slab | Net in hand |
|---|---|---|---|---|
| 1,000 shares | ₹1,000 | Nil (< ₹5,000) | ₹300 | ₹700 |
| 10,000 shares | ₹10,000 | ₹1,000 | ₹3,000 | ₹7,000 |
Standard textbook example (Re.10 per share on 1,000 shares at 30% slab): gross ₹10,000, TDS ₹1,000, tax ₹3,000, net ₹7,000 — an effective post-tax yield of 70% of the gross dividend. For GPIL's actual Re.1 dividend, a 30%-slab investor keeps ₹0.70 per share after tax. TDS bites only once annual GPIL dividend crosses ₹5,000 (i.e. above ~5,000 shares).
Tax rules are general and not personalised advice; consult a tax professional for your situation.
Key Risks
- Commodity cyclicality: GPIL's profits swing with steel, iron-ore and pellet prices. Five-year sales growth has been weak (~6%), and a downcycle can compress the earnings that fund the dividend.
- Heavy capex phase compresses free cash: ~₹1,042 Cr of capex cut FY26 free cash flow to ~₹115 Cr. If capex stays elevated (steel expansion + ₹700 Cr BESS commitment), FCF cover for the dividend stays thin.
- Execution / diversification risk: The battery-energy-storage (BESS) and solar bets are new business lines outside GPIL's core steel competence, with uncertain returns.
- Operational disruptions: The 2.0 MTPA iron-ore pellet plant was suspended in mid-July 2026 and resumed only in late August 2026 — a reminder that plant availability directly affects volumes and cash.
- Low-yield, retention-led policy: The ~0.40% yield offers negligible income cushion. Total return depends almost entirely on capital appreciation, which is not guaranteed.
- Related-party fund deployment: Large flows to group entities (GNEPL for BESS, GERF education foundation loan) require shareholder approval and warrant monitoring for capital-allocation discipline.
What To Monitor
- Free cash flow trajectory: Watch whether FCF recovers as the current capex cycle matures — the key swing factor for future dividend growth.
- Steel and pellet realisations / spreads: Track quarterly EBITDA per tonne and OPM; margin is the real driver of payout capacity.
- Capex-to-cash-generation balance: Monitor the pace of the ₹700 Cr BESS commitment and steel expansion against operating cash generation.
- Payout ratio direction: A move above the historic ~8–17% band would signal a more shareholder-return-focused policy; a cut would signal caution.
- Net cash / borrowings: Watch whether the net-cash buffer erodes as capex is funded, and whether new debt is raised.
- Return ratios (ROE/ROCE): ROE has eased to ~15%; sustained decline would question the reinvestment-over-dividend strategy.
- AGM outcome (19-Sep-2026): Confirm the dividend is formally declared and note any change vs the recommended Re.1.
Conclusion
Positives
A rock-solid, easily affordable dividend: 13x earnings cover, ~18x operating-cash and cash cover, ~₹752 Cr net cash, ROCE of ~20%, and a consistent annual payout track record since FY2021. Cash conversion (CFO/PAT 1.44x) is high-quality.
Negatives
A near-negligible ~0.40% real yield, flat revenue, a slight dip in reported net profit, and free cash flow squeezed to ~₹115 Cr by a heavy capex cycle. The "100%" headline overstates what shareholders actually receive.
The balance
GPIL is a growth-and-retention business that pays a token, well-covered dividend while reinvesting almost everything into steel capacity, mining, pellets and new energy ventures. The dividend is safe; it is simply small by design. This report presents the positives, negatives, risks and monitoring points so you can decide what fits your objectives — it does not offer any buy, sell or hold recommendation.
Frequently Asked Questions
What dividend has Godawari Power & Ispat announced for FY2025-26?
What is the real dividend yield of GPIL?
What is the record date for the GPIL dividend?
What is the ex-dividend date?
When will the GPIL dividend be paid?
Who is eligible for the dividend?
How is the GPIL dividend taxed?
Is the GPIL dividend sustainable?
What is GPIL's dividend history?
How much of the dividend goes to promoters?
Why is GPIL's dividend yield so low if profits are high?
Should investors read the standalone or consolidated numbers?
What should investors monitor going forward?
Disclaimer
This article is for informational and educational purposes only and does not constitute investment, financial, legal or tax advice, nor any buy, sell or hold recommendation. ShareBazaar Online is not a SEBI-registered investment adviser or research analyst. Figures are drawn from the company's exchange filing dated 19 May 2026 and publicly available data; some data points (including current market price, exact ex-date, peer figures and pre-FY2024 restated dividends) are time-sensitive or independently unverified and are labelled accordingly — they must be re-verified before acting. Market prices and yields change continuously. Securities markets are subject to risk; please consult a SEBI-registered adviser and read all offer documents before investing. The author and publisher accept no liability for decisions taken based on this content.