
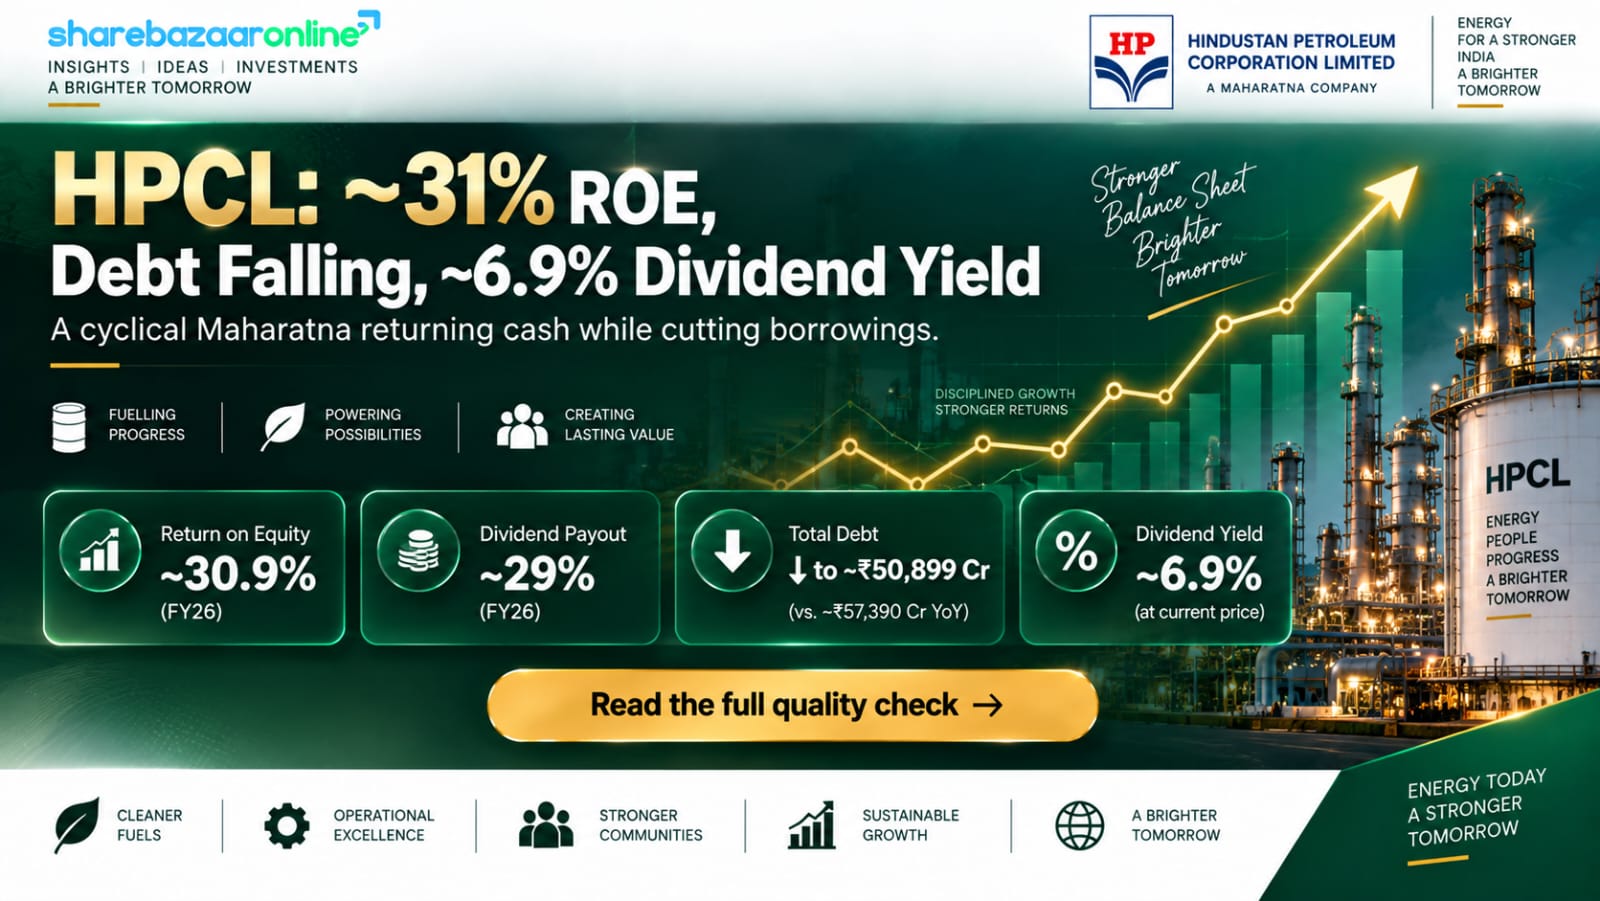
Dividend Snapshot
Hindustan Petroleum Corporation Limited (HPCL) has recommended a final dividend of ₹19.25 per equity share (face value ₹10) for the financial year 2025-26. Including the ₹5.00 interim dividend already paid during the year, the total FY26 dividend works out to ₹24.25 per share. The headline "192.5%" figure quoted in some coverage is calculated on the ₹10 face value — the real, market-price dividend yield on the final leg is about 5.47%, and roughly 6.90% on the full-year payout.
Final Dividend Per Share
₹19.25
192.5% on ₹10 face value
Total FY26 Dividend
₹24.25
₹5.00 interim + ₹19.25 final
Real Yield (Final, on CMP)
5.47%
On CMP ₹351.60 (NSE, 8 Sep 2026)
Record Date
14 Aug 2026
Fixed by Board on 13 May 2026
One-line takeaway: The dividend is comfortably funded — covered 3.50 times by consolidated earnings and 7.00 times by operating cash flow — but it is paid out of cash flow, not out of a cash pile: HPCL's net liquid position after cash credits is actually negative. A Maharatna oil marketer with a 54.90% government promoter, HPCL passes roughly ₹2,833 crore of the full-year payout straight to ONGC and the Government of India.
Dividend Announcement Summary
At its Board Meeting held on 13 May 2026 (commenced 10:00 a.m., concluded 11:45 a.m.), the Board of Directors of HPCL considered the audited standalone and consolidated results for FY2025-26 and recommended a final equity dividend of ₹19.25 per share on a face value of ₹10 each, under Regulation 42 of SEBI LODR. The dividend is subject to shareholder approval at the ensuing Annual General Meeting (AGM) and, once declared, will be paid within 30 days.
Key filing facts
- Company: Hindustan Petroleum Corporation Ltd
- NSE: HINDPETRO | BSE: 500104
- ISIN: INE094A01015
- CIN: L23201MH1952GOI008858
- Dividend type: Final Equity Dividend
- Financial year: 2025-26
Context
- Final dividend: ₹19.25 per share
- Interim (already paid, Nov 2025): ₹5.00 per share
- Total FY26 shareholder payout: ₹24.25 per share
- Auditors: unmodified (clean) opinion
- Standalone net profit FY26: ₹17,175.23 crore
- Consolidated net profit FY26: ₹18,046.89 crore
Note on approval language: The final dividend is a recommendation and remains "subject to approval by the members" until the AGM outcome is confirmed. The interim ₹5.00 was already paid during FY26 and does not require further approval.
Key Dates Timeline
| Event | Date | Basis |
|---|---|---|
| Board Meeting / Announcement | 13 May 2026 | Confirmed in filing |
| Ex-Date | 14 Aug 2026 | Inferred under T+1 (verify vs NSE/BSE circular) |
| Record Date | 14 Aug 2026 | Confirmed in filing |
| AGM (approval) | Not Disclosed by Company | Ensuing AGM |
| Payment Date | Within 30 days of AGM declaration | Statutory outer limit; exact date Not Disclosed by Company |
Under the T+1 settlement cycle in India, the ex-date and record date typically fall on the same day. To be eligible for this dividend, an investor had to hold HINDPETRO shares as of the record date, 14 August 2026. Buying on the ex-date itself does not confer eligibility.
Dividend Yield Analysis
This is where headline numbers can mislead retail investors. A "192.5% dividend" sounds enormous, but that percentage is calculated on the ₹10 face value, not on the price you actually pay in the market. The number that matters for your pocket is the yield on the current market price (CMP).
The "face-value illusion"
- Headline (final, on ₹10 FV): 192.5%
- Real yield (final, on CMP ₹351.60): 5.47%
- Real yield (total FY26 ₹24.25, on CMP): 6.90%
Yield at announcement vs now
- Final yield on announce-day price (₹377.30): 5.10%
- Final yield on CMP (₹351.60): 5.47%
- The yield has risen because the share price fell ~7% since announcement, not because the dividend grew.
Yield reality check: HPCL's ~6.9% full-year yield is genuinely high for a large-cap, but part of the recent optical boost comes from a falling share price (down ~11% over one year; 52-week range ₹316.20–₹508.45). A high yield driven partly by price weakness is different from one driven by a rising dividend — both are true here, and both should be weighed.
CMP ₹351.60 sourced from NSE close, 8 Sep 2026 (Screener shows ₹349 on 9 Sep 2026). All yields are price-dependent and must be re-verified against the live CMP before publishing.
Dividend History Analysis
HPCL is a consistent dividend payer that pays in two legs each year (an interim during the year and a final after results). The one clear break was FY2022-23, when the company posted a loss and the dividend payout dropped to zero. Because HPCL has issued bonus shares (a 1:2 bonus in FY2024-25) and split/bonus events in earlier years, per-share dividends from before FY25 must be restated under Ind AS 33 before any like-for-like comparison — so the cleanest, verified lens is the dividend payout ratio.
| Financial Year | Consolidated EPS (₹) | Dividend Payout % | Note |
|---|---|---|---|
| FY2025-26 | 84.81 | ~29% | DPS ₹24.25 (₹5 interim + ₹19.25 final) |
| FY2024-25 | 31.66 | 33% | Recovery year |
| FY2023-24 | 75.26 | 28% | Strong profit year |
| FY2022-23 | -32.80 | 0% | Loss year — dividend suspended |
| FY2021-22 | 34.28 | 27% | — |
| FY2020-21 | 48.83 | 31% | — |
Classification: Cyclical Payer. HPCL rewards shareholders generously in good years and has maintained a fairly steady payout band of roughly 27–33% of profit — but the FY23 zero-dividend year shows the payout tracks the refining/marketing cycle. Absolute per-share dividends swing with crude prices and marketing margins rather than following a fixed, always-rising path. Payout ratios above are verified from consolidated results; older per-share amounts are omitted here rather than shown un-restated.
Financial Performance Analysis
FY2025-26 was a strong rebound year. On a consolidated basis, net profit jumped ~168% to ₹18,046.89 crore (FY25: ₹6,735.70 crore), driven by a sharp recovery in refining and marketing margins. The gross refining margin (GRM) improved to US$8.79 per barrel from US$5.74 the prior year.
Consolidated FY26 vs FY25
- Revenue: ₹4,81,122 cr vs ₹4,68,812 cr (+2.6%)
- Operating profit: ₹30,645 cr vs ₹16,448 cr (+86.3%)
- Net profit: ₹18,047 cr vs ₹6,736 cr (+167.9%)
- Consolidated EPS: ₹84.81 vs ₹31.66
Return & quality ratios (FY26)
- ROE: ~30.9%
- ROCE: ~22.2%
- Book value: ~₹308 per share
- Net worth: ₹65,556 crore
Operating-leverage insight: Revenue barely moved (+2.6%), yet operating profit rose +86% and net profit +168%. This is classic margin-driven operating leverage — the profit surge came from a wider refining/marketing spread, not from selling more volume. That is a double-edged sword: the same leverage that magnified FY26 profits can magnify a downturn, which is exactly what showed up in the June 2026 quarter (see "What To Monitor").
Cash Flow Analysis
Reported profit is an accounting opinion; cash is fact. Here the two line up well. HPCL generated ₹36,110.68 crore of operating cash flow (OCF) in FY26 — actually more than its consolidated PAT of ₹18,047 crore — helped by a large release of working capital (trade receivables fell and payables rose). Cash conversion (OCF as a share of operating profit) was a healthy ~131%.
Cash generation (consolidated FY26)
- Operating cash flow: ₹36,110.68 cr
- Capex (PP&E + CWIP): ₹8,331.49 cr
- Free cash flow: ~₹27,779 cr
- Dividend paid in FY26 (cash-flow line): ₹3,298.36 cr
How the dividend is funded
- OCF covers total FY26 dividend 7.00x
- FCF covers total FY26 dividend ~5.4x
- Verdict: funded by current operating cash flow, not by borrowing or asset sales
Integrity gate: The ₹3,298.36 crore "dividend paid" in the FY26 cash-flow statement is not the same as the ₹24.25 declared for FY26. By timing, it captures the FY25 final dividend (paid in FY26) plus the FY26 interim. The FY26 final dividend of ~₹4,096 crore will appear in the FY27 cash-flow statement once paid after the AGM. We flag this so the outflow figures are not double-counted.
Balance Sheet Strength
HPCL reduced its total debt in FY26. Consolidated borrowings fell to about ₹50,899 crore (SEBI outstanding-debt disclosure) from roughly ₹70,558 crore a year earlier, and the debt-to-equity ratio eased to a comfortable 0.78x. Net worth grew to ₹65,556 crore.
Leverage (consolidated FY26)
- Total borrowings: ₹50,899 cr
- Debt / Equity: 0.78x
- Net worth: ₹65,556 cr
- Debt trend: reducing
Liquidity — the honest caveat
- Cash & equivalents + current investments: ₹3,231 cr
- Less cash credits: ₹4,873 cr
- Net liquid position: –₹1,642 cr
- Gross liquid vs total dividend: 0.63x (thin)
Key nuance: HPCL does not sit on a cash mountain. On a net basis (after cash credits) its short-term cash position is negative — entirely normal for a high-throughput oil marketer that runs on working-capital finance. The dividend is therefore serviced out of strong recurring cash flow, not out of accumulated cash reserves. That distinction matters: it means dividend safety depends on margins staying healthy, quarter after quarter.
Dividend Sustainability Analysis
We test dividend sustainability across four independent coverage lenses and then give a composite verdict.
| Coverage Test | Figure | Read |
|---|---|---|
| 1. Earnings coverage | 3.50x | Strong — PAT ₹18,047 cr vs outflow ₹5,160 cr |
| 2. OCF coverage | 7.00x | Very strong |
| 3. FCF coverage | ~5.4x | Strong, even after ₹8,331 cr capex |
| 4. Liquidity / cash coverage | 0.63x | Thin — funded from flow, not stock of cash |
Composite verdict: Sustainable (flow-funded). Three of four tests are comfortably strong; the only soft test is the balance-sheet cash cushion, which is structurally thin for this business model. The payout ratio of ~29% leaves ample retained profit for capex and debt reduction. The dividend looks well-supported as long as refining and marketing margins hold up — a real caveat given the loss-making June 2026 quarter.
Peer Comparison
| Company | FY26 DPS (₹) | Approx. Yield | Payout | ROE |
|---|---|---|---|---|
| HPCL | 24.25 | ~6.9% | ~29% | ~30.9% |
| BPCL | ~17.50 | ~5.5% | ~26% | Verify |
| IOC (Indian Oil) | Multiple interims | ~5.9% | Verify | Verify |
Among the three listed oil marketers, HPCL screens as the highest-yielding and highest-ROE of the group on FY26 numbers, while keeping a conservative payout ratio. All three are cyclical and government-controlled, so their dividends move together with refining and marketing margins. Peer yields, payouts and ROE marked "Verify" are drawn from secondary sources that vary by date and are intentionally left for desk re-verification rather than stated as confirmed.
Peer figures are indicative (BPCL ~₹7.50 + ~₹10 interims FY26; IOC multiple small interims). Yields depend on live prices and must be re-checked at publish time.
Promoter Impact Analysis
HPCL's promoter is Oil and Natural Gas Corporation (ONGC), which holds 54.90% on behalf of the Government of India. Because the government owns the majority, a majority of every rupee of dividend flows straight back to the promoter/exchequer.
Promoter (ONGC/GoI) pass-through
- Promoter holding: 54.90%
- Promoter share of final dividend: ~₹2,249 cr
- Promoter share of total FY26 dividend: ~₹2,833 cr
Minority / public shareholders
- FII holding (Mar 2026): ~17.26%
- DII holding (Mar 2026): ~19.58%
- Public / retail: ~8.24%
- Non-promoter share of total FY26 dividend: ~₹2,327 cr
Distribution impact: The dividend is proportional — every shareholder is paid the same ₹19.25 per share regardless of size, so there is no structural transfer of value away from minority holders. The practical point for retail investors is that HPCL's generous payout policy is partly a function of the government's own need for steady dividend income from its PSUs.
Taxation Analysis
Since April 2020, dividends in India are taxed in the hands of the investor at their applicable income-tax slab rate (the earlier Dividend Distribution Tax was abolished). The company also deducts TDS at 10% under Section 194 if your total dividend from a company exceeds ₹10,000 in a financial year (20% or the DTAA rate for NRIs; no TDS below the ₹10,000 threshold, or with a valid Form 15G/15H).
Worked example — retail investor holding 1,000 shares (final ₹19.25)
| Gross dividend (1,000 × ₹19.25) | ₹19,250 |
| TDS @10% (deducted, as > ₹10,000) | ₹1,925 |
| Credited to bank after TDS | ₹17,325 |
| Total tax if in 30% slab | ₹5,775 |
| Net dividend in hand (after full tax) | ₹13,475 |
| Effective post-tax yield on CMP | ~3.83% |
The TDS of ₹1,925 is not an extra cost — it is an advance against your final tax, adjustable when you file your return. A 30%-slab investor keeps about ₹13,475 of the ₹19,250 gross. A 0%/5%-slab investor keeps far more and can reclaim the TDS as a refund. This illustration is general and not personal tax advice; consult a tax professional for your situation.
Key Risks
- Margin cyclicality (the big one). HPCL's profits swing with gross refining margins and marketing spreads. The very next quarter after this dividend — June 2026 (Q1 FY27) — swung to a consolidated net loss of about ₹12,265 crore with a negative operating margin, wiping out trailing-twelve-month profit. Dividend capacity is only as steady as the margin cycle.
- Marketing under-recovery / LPG buffer. The filing notes a cumulative unrecognised negative LPG buffer of ₹12,798.67 crore as of 31 March 2026. Compensation from the government is being recognised in instalments, but the receivable/timing risk is real.
- Crude price & forex. FY26 "other expenses" already include ₹2,491 crore of foreign-exchange transaction/translation losses. A weaker rupee or a crude spike compresses margins and cash flow.
- Thin cash cushion. With a net-negative short-term liquid position, HPCL relies on continuous operating cash flow; a sustained margin downturn would pressure both capex and dividends.
- Heavy capex cycle. Large refinery-modernisation and expansion projects (e.g., Visakh Refinery upgrade) keep capital demands high, competing with dividends for cash.
- Governance flag. Auditors noted HPCL did not have the required number of independent directors on its Board for the full FY26 period — a compliance point worth tracking.
What To Monitor
- Quarterly GRM and marketing margins — the single biggest driver of dividend capacity. Watch whether the June 2026 loss was a one-off inventory/margin hit or the start of a weaker cycle.
- Recovery of the LPG buffer receivable — how quickly the ₹12,799 crore unrecognised buffer converts into recognised revenue and cash.
- Debt trajectory — whether HPCL keeps reducing borrowings (down to ~₹50,899 cr) while funding capex.
- Capex intensity vs free cash flow — refinery-upgrade spending against the ~₹27,779 cr FCF base.
- Payout-ratio discipline — whether the ~29% payout band holds if a weak year returns (as it did in FY23).
- AGM approval & payment date — confirmation of the final ₹19.25 at the AGM and the actual credit date (not disclosed yet).
Conclusion
HPCL's FY2025-26 final dividend of ₹19.25 (taking the full year to ₹24.25) delivers a real, market-price yield of roughly 5.5% on the final leg and ~6.9% for the year — not the eye-catching "192.5%" that the face-value convention produces. The payout is well covered by earnings (3.5x) and cash flow (OCF 7.0x, FCF ~5.4x), sits at a conservative ~29% payout ratio, and comes alongside real debt reduction and a ~31% ROE.
The balancing facts: HPCL funds this dividend from cash flow rather than a cash reserve (its net short-term liquidity is negative), its earnings are highly cyclical, and the June 2026 quarter already swung to a heavy loss. The positives (high yield, strong coverage, falling debt) and the negatives (margin cyclicality, thin cash cushion, LPG-buffer receivable, a governance flag) are laid out above so you can weigh them yourself.
Frequently Asked Questions
What dividend has HPCL announced for FY2025-26?
What is the HPCL dividend yield?
What is the record date for the HPCL dividend?
What is the ex-date for the HPCL dividend?
When will the HPCL dividend be paid?
Who is eligible for the HPCL dividend?
How is the HPCL dividend taxed?
Is the HPCL dividend sustainable?
What is HPCL's dividend history?
How much of the dividend goes to the government promoter?
Why is HPCL's dividend yield so high compared with other large caps?
What should investors monitor after this dividend?
Is standalone or consolidated the right basis to judge this dividend?
Disclaimer
ShareBazaar Online is a financial-content platform and is not registered with SEBI as an investment adviser or research analyst. This article is for information and educational purposes only and does not constitute investment, financial, legal or tax advice, nor a recommendation to buy, sell or hold any security. Dividend amounts, dates, prices and yields are based on the company's board-meeting filing dated 13 May 2026 and third-party data as of early September 2026; all price-dependent figures (especially yields) must be re-verified against the live market price before you act. The ex-date is inferred under the T+1 convention and should be confirmed against the official NSE/BSE corporate-action circular. Figures not independently verified are labelled accordingly. Securities markets are subject to risks, including loss of capital. Please consult a SEBI-registered adviser and your tax professional before making any investment decision.