
Dividend Snapshot
Usha Martin Limited (NSE: USHAMART, BSE: 517146, ISIN: INE228A01035) has recommended a final dividend of ₹3.75 per equity share of face value Re 1 for the financial year ended 31 March 2026. On face value this is described as a 375% dividend, but on the live market price the real cash yield works out to only about 0.75%.
Dividend Per Share
₹3.75
Final dividend, FY2025-26
Real Dividend Yield (on CMP ₹499)
~0.75%
Not the headline 375% figure
Estimated Dividend Outflow
~₹114 Cr
On ~30.46 crore eligible shares
Payout Ratio (Consolidated)
~24.5%
~32% on standalone profit
Why this matters: Usha Martin resumed dividends only in FY2022 after a multi-year gap during its heavily indebted steel era. The ₹3.75 payout is the company's highest ever and marks the fifth straight annual increase — a steady rebuild funded by strong cash generation and a near debt-free balance sheet.
Dividend Announcement Summary
At its board meeting on 30 April 2026, the Board of Directors of Usha Martin Limited recommended a final dividend of ₹3.75 per fully paid-up ordinary share of Re 1 each (375% on face value) for the year ended 31 March 2026. The recommendation was made subject to shareholder approval at the Annual General Meeting. The statutory auditors, S R Batliboi & Co. LLP, issued an unmodified (clean) opinion on both standalone and consolidated results.
Dividend type: Final dividend (not interim, not special).
Financial year: FY2025-26 (year ended 31 March 2026).
Approval status: Approved by shareholders at the 40th AGM held on 20 August 2026.
The company also appointed M/s Mani & Co. as Cost Auditor and Deloitte Touche Tohmatsu India LLP as Internal Auditor for FY2026-27. The board meeting ran from 12:00 noon to 1:15 pm IST.
Key Dates Timeline
| Event | Date | Note |
|---|---|---|
| Board recommendation / announcement | 30 April 2026 | Confirmed in filing |
| Record date | 13 August 2026 | Fixed by company (Thursday) |
| Ex-dividend date | 13 August 2026 | Aligned with record date under T+1; verify on NSE/BSE circular |
| 40th AGM (approval) | 20 August 2026 | Via video conferencing |
| Payment date | On or after 24 August 2026 | Within 30 days of AGM declaration |
To be eligible for this dividend, an investor needed to hold shares as on the record date of 13 August 2026. Because the record date and AGM have already passed, this is a settled, post-event payout rather than an upcoming one.
Dividend Yield Analysis
This is the single most misunderstood number in the announcement. A "375% dividend" sounds enormous, but that percentage is calculated on the Re 1 face value — it simply means ₹3.75 per share. What actually lands in an investor's pocket depends on the price paid for the share, not its face value.
Headline yield (on face value)
375%
₹3.75 ÷ ₹1 face value — accounting label, not investor return
Real yield (on market price)
~0.75%
₹3.75 ÷ ~₹499 current market price
At a current market price of about ₹499 (as of 9 September 2026), the real dividend yield is roughly 0.75%. This is below the broad market average and reflects Usha Martin's profile as a growth-and-reinvestment company, not a high-yield income stock. The low yield is a function of a strongly appreciating share price (up about 37% over the trailing year) rather than a stingy dividend — the dividend itself has grown every year.
Announcement-date yield: The exact NSE closing price on 30 April 2026 is Not Independently Verified in this analysis. Because the stock traded materially lower in spring 2026 (it was near ₹430 in mid-January 2026 before rallying), the yield at announcement would have been modestly higher than the ~0.75% seen today. All yield figures are price-dependent and should be re-checked against the live price before acting.
Dividend History Analysis
| Financial Year | Dividend / Share | Approx. Payout |
|---|---|---|
| FY2015 to FY2021 | NIL | 0% (dividends suspended) |
| FY2022 | ₹2.00 | ~21% |
| FY2023 | ₹2.50 | ~22% |
| FY2024 | ₹2.75 | ~20% |
| FY2025 | ₹3.00 | ~22% |
| FY2026 | ₹3.75 | ~25% |
The dividend restart is the story. Usha Martin paid nothing from FY2015 to FY2021 — the years when it carried billions in debt against a struggling integrated steel business. Dividends resumed only after it sold its steel business to Tata Steel in 2019 and de-levered dramatically.
Since the restart, the dividend has grown every single year: ₹2.00 → ₹2.50 → ₹2.75 → ₹3.00 → ₹3.75, a compound growth of about 17% a year over four years. The FY2026 hike of 25% is the largest of the sequence.
Classification: A consistent and rising payer since FY2022, but with a clear historical scar — the long suspension means its uninterrupted track record is only five years old, and the payout policy is relatively young.
Financial Performance Analysis
Revenue (Consolidated, FY26)
₹3,691 Cr
Up ~6.2% from ₹3,474 Cr in FY25
Net Profit (Consolidated, FY26)
₹466 Cr
Up ~14.8% from ₹406 Cr in FY25
Profit grew more than twice as fast as revenue — positive operating leverage. Revenue rose only ~6%, but operating profit expanded to about ₹705 Cr with the operating margin improving to roughly 19% (from ~17% in FY25). Q4 FY26 was especially strong, with the operating margin touching ~22%. Lower finance costs (down to about ₹20 Cr from ₹30 Cr) and a much lighter debt load amplified the flow-through to the bottom line.
Watch the one-off boosts. FY26 other income of ~₹46 Cr included about ₹19.6 Cr of interest on an income-tax refund and a ₹15.4 Cr gain on the sale of Chennai land — roughly ₹35 Cr of non-recurring items, or about 5.5% of pre-tax profit. Reported profit was also reduced by a ₹24.9 Cr loss from discontinued operations (residual costs tied to the earlier steel-business transfer to Tata Steel) and a ₹16.9 Cr exceptional charge for the new Labour Codes. Continuing-operations profit was actually higher at about ₹491 Cr. Return ratios remain healthy: ROCE ~19.5% and ROE ~15.1% (Screener, consolidated).
Cash Flow Analysis
Reported profit is an opinion; cash is a fact — and here the cash backs up the profit. Consolidated operating cash flow (OCF) for FY26 was about ₹655 Cr, comfortably higher than net profit of ~₹466 Cr. A cash-flow-to-operating-profit ratio above 100% signals that reported earnings are being converted into real cash, not stuck in receivables or inventory.
Operating Cash Flow (FY26)
~₹655 Cr
Up sharply from ~₹422 Cr in FY25
Free Cash Flow (FY26)
~₹457–489 Cr
After capex of ~₹198 Cr (gross)
How the dividend is funded: The ~₹114 Cr dividend is paid comfortably out of current-year free cash flow (~₹457–489 Cr), not from cash reserves, asset sales or borrowings. Even after spending ~₹198 Cr on capital expenditure and paying the dividend, the company still generated surplus cash. One watch-point: trade receivables rose during the year (a ~₹113 Cr working-capital drag in the consolidated cash flow), so receivables growth outpaced the modest revenue growth — worth monitoring but not yet alarming given the cash surplus.
Balance Sheet Strength
Cash & Bank Balances (Consolidated)
~₹478 Cr
Cash + other bank balances
Net Cash Position
~+₹332 Cr
Cash exceeds borrowings of ~₹146 Cr
Usha Martin is effectively net-cash and almost debt-free. Consolidated borrowings fell to about ₹146 Cr (roughly ₹229 Cr including lease liabilities) against cash and bank balances of about ₹478 Cr — a net cash surplus of roughly ₹332 Cr (about ₹249 Cr even after counting all lease liabilities). Total equity stands at about ₹3,302 Cr. This is a dramatic turnaround from FY2015-FY2018, when the company carried ₹4,000 Cr+ of debt. A near debt-free balance sheet is the foundation that makes the current dividend affordable and repeatable.
Dividend Sustainability Analysis
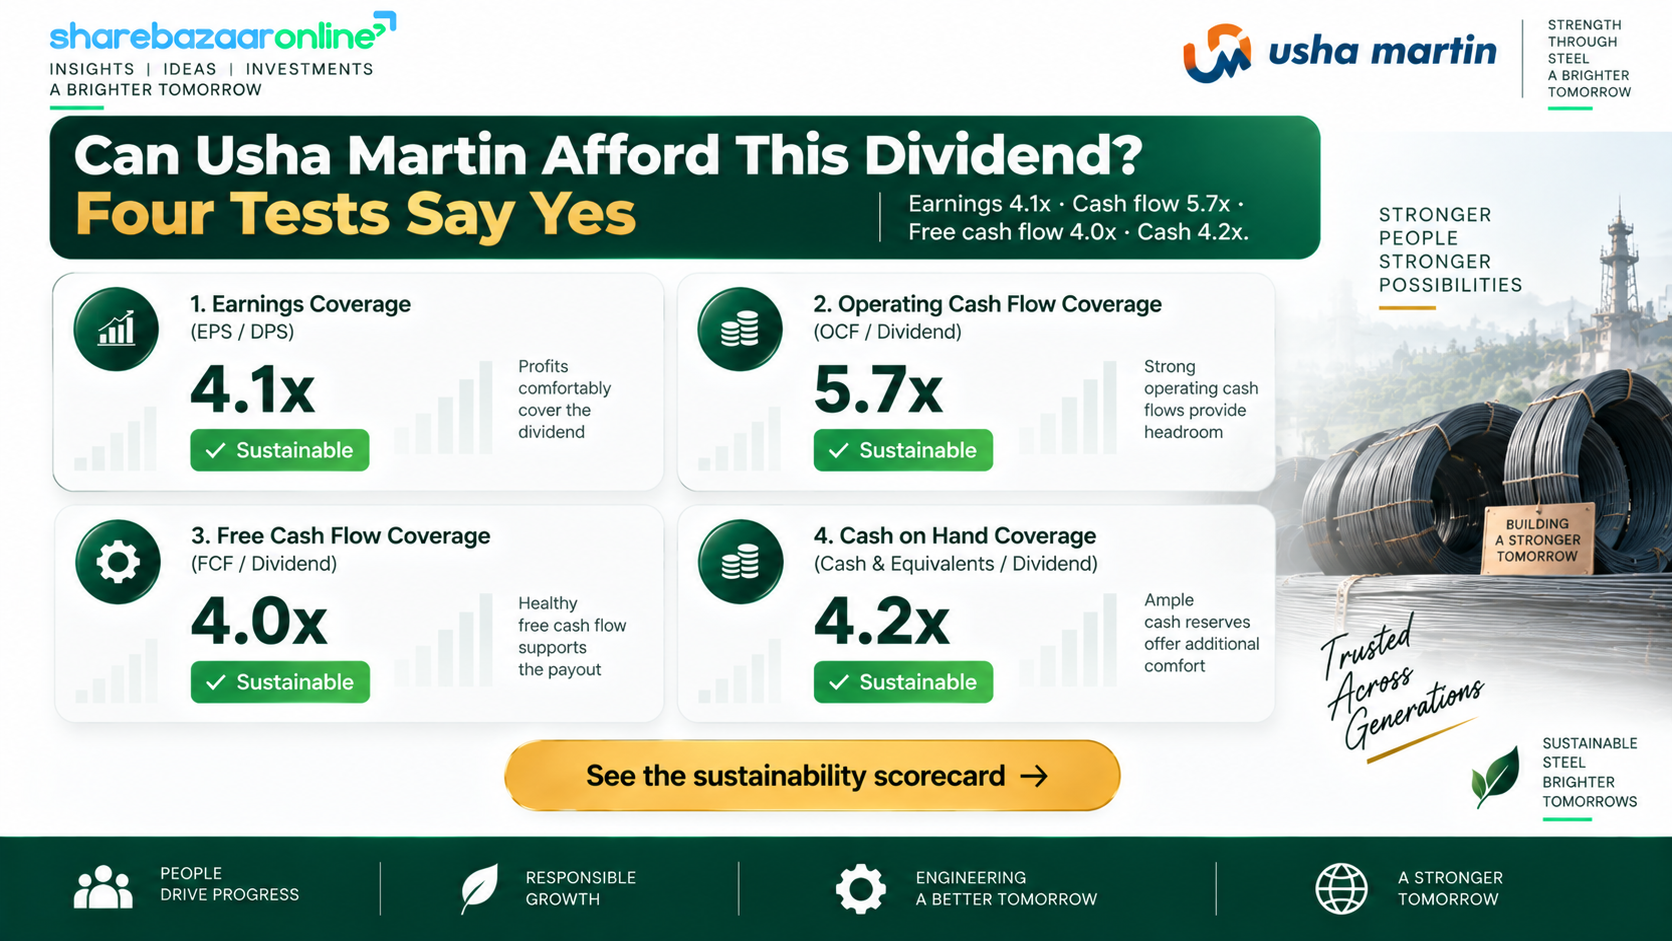
| Coverage Test | Result | Read |
|---|---|---|
| Earnings coverage (EPS ÷ DPS) | ~4.1x (consol) / ~3.1x (standalone) | Strong |
| Operating cash flow coverage | ~5.7x | Very strong |
| Free cash flow coverage | ~4.0–4.3x | Strong |
| Cash & liquidity coverage | ~4.2x (consol) | Strong |
All four independent tests point the same way. Earnings cover the dividend about four times, operating cash flow covers it nearly six times, free cash flow about four times, and existing cash on the balance sheet could fund the payout more than four years over even with zero fresh earnings.
The payout ratio of ~24.5% (consolidated) is conservative, leaving ample room to keep raising the dividend or to fund growth capex. Debt is falling, not rising, while dividends are being paid — the healthiest possible combination.
Composite verdict: Sustainable. On every coverage measure the dividend is well supported, and the company retains three-quarters of profit for reinvestment. The main caveats are cyclicality of the steel/wire-rope business and the young age of the current dividend policy — not affordability.
Peer Comparison
| Metric | Usha Martin (FY26) | Iron & Steel Products peers |
|---|---|---|
| Dividend yield | ~0.75% | Not independently verified |
| Dividend payout | ~24.5% | Not independently verified |
| ROCE | ~19.5% | Not independently verified |
| ROE | ~15.1% | Not independently verified |
| Net cash / (net debt) | Net cash ~+₹332 Cr | Not independently verified |
Usha Martin is classified under Iron & Steel Products / Industrial Products. Rather than populate peer cells with unverified numbers, they are left marked Not Independently Verified pending a like-for-like data pull. In context, Usha Martin's ~0.75% yield sits below the basic-materials sector average (roughly 1.7%), consistent with it being a growth-and-reinvestment name; its ROCE of ~19.5% and a net-cash balance sheet are, however, above the typical steel-products peer.
Promoter Impact Analysis
Promoter Holding (Jun 2026)
40.28%
Down from ~51% in 2017
Estimated Promoter Dividend
~₹46 Cr
40.28% of ~₹114 Cr outflow
Of the ~₹114 Cr total dividend, the promoter group receives roughly ₹46 Cr at its 40.28% stake. The remaining ~₹68 Cr flows to public shareholders, with foreign institutions (FII ~15.1%) taking ~₹17 Cr, domestic institutions (DII ~15.3%) ~₹17 Cr, and retail/other public (~29.2%) ~₹33 Cr.
Notable trend: Promoter holding has steadily declined from ~51% in 2017 to 40.28%, a fall of about 7.6 percentage points over the last three years alone. Meanwhile institutional ownership has risen sharply — DII holding jumped from under 1% in FY2021 to over 15%. The dividend is not disproportionately skewed toward promoters; the majority flows to a broadening institutional and public base.
Taxation Analysis
Since April 2020, dividends in India are taxed in the hands of the investor at their applicable income-tax slab rate (the company no longer pays Dividend Distribution Tax). If total dividend from a company in a financial year exceeds ₹5,000, the company deducts TDS at 10% under Section 194 (20% without a valid PAN). This TDS is adjustable against the investor's final tax liability.
Worked example — investor holding 1,000 shares at ₹3.75/share, 30% tax slab:
| Gross dividend (1,000 × ₹3.75) | ₹3,750 |
| TDS @10% (only if > ₹5,000; not triggered here) | ₹0 |
| Tax at 30% slab | ₹1,125 |
| Net dividend in hand | ₹2,625 |
| Effective post-tax yield (on ₹499) | ~0.53% |
For this 1,000-share holding the gross dividend (₹3,750) is below the ₹5,000 TDS threshold, so no TDS applies — but the investor still owes tax at their slab. A 30%-slab investor keeps about ₹2,625, cutting the pre-tax ~0.75% yield to roughly 0.53% after tax. Investors in lower slabs keep more. This is general information, not tax advice.
Key Risks
- ED / CBI / PMLA legal overhang. The auditor's Emphasis of Matter flags ongoing Enforcement Directorate and CBI proceedings tied to iron-ore-fines sales of ₹190.4 Cr (₹19,037 lakh) in prior years, involving the company and its Managing Director. Management believes it has a strong case and made no financial adjustment, but an adverse outcome is a real tail risk.
- Steel-cycle and commodity dependence. As a wire-and-wire-rope maker, earnings are exposed to steel input prices, global demand cycles and currency swings on a large export/subsidiary base — margins can compress quickly in a downturn.
- Modest revenue growth. Sales grew only ~6% in FY26 and ~12% CAGR over five years; much of FY26 profit growth came from margin expansion and lower interest, which are harder to repeat indefinitely.
- Receivables build-up. Trade receivables and the cash-conversion cycle lengthened during FY26, a working-capital drag that could pressure future cash flow if it continues.
- One-time earnings support and young dividend policy. FY26 profit was flattered by ~₹35 Cr of non-recurring other income, and the current dividend track record is only five years old after a long suspension — the policy is not yet battle-tested through a full down-cycle.
What To Monitor
- Progress of the ED/CBI/PMLA cases — hearing outcomes and any change in the auditor's Emphasis of Matter.
- Operating margin trajectory — whether the ~19% (and Q4's ~22%) margin holds or reverts as steel prices move.
- Volume growth in wire ropes and value-added segments — the real driver of durable revenue growth beyond price effects.
- Working-capital discipline — whether receivable days and the cash-conversion cycle normalise back down.
- Payout-ratio trend and dividend policy — whether management continues raising the dividend while keeping payout conservative, and whether it stays net-cash.
Conclusion
Usha Martin's FY2026 final dividend of ₹3.75 is best read as a quality signal rather than an income opportunity. The headline "375%" is a face-value artefact; the real yield is a modest ~0.75%. What stands out is the underlying financial health: a near debt-free, net-cash balance sheet, operating cash flow of ~₹655 Cr covering the payout nearly six times, a conservative ~24.5% payout ratio, and a dividend that has risen for five consecutive years since its FY2022 restart.
Positives
Net-cash balance sheet; strong four-test dividend coverage; five straight years of dividend growth; healthy ROCE ~19.5%; positive operating leverage in FY26.
Negatives / Watch-points
Very low real yield; unresolved ED/CBI legal overhang; steel-cycle sensitivity; modest top-line growth; one-off items in FY26 profit; young dividend policy.
The positives, negatives, risks and monitoring factors are laid out above so that readers can weigh them for themselves. This article does not offer any buy, sell or hold recommendation.
Frequently Asked Questions
What dividend has Usha Martin announced for FY2026?
What is the real dividend yield on Usha Martin shares?
What was the record date for the Usha Martin dividend?
What was the ex-dividend date?
When was the dividend paid?
Who was eligible to receive the dividend?
How is this dividend taxed?
Is the Usha Martin dividend sustainable?
What is Usha Martin's dividend history?
How much of the dividend goes to promoters?
What is the total dividend outflow?
Why is the yield so low if the dividend keeps rising?
What legal issue is flagged in the results?
Should investors buy Usha Martin for the dividend?
Disclaimer
This article is for informational and educational purposes only and is not investment, financial, legal or tax advice. ShareBazaar Online is not a SEBI-registered investment adviser or research analyst, and nothing here constitutes a recommendation to buy, sell or hold any security. Figures are drawn from Usha Martin Limited's audited board filing dated 30 April 2026 and third-party sources including Screener.in; market prices, yields and dividend dates are time-sensitive and must be independently re-verified before any decision. Computed figures (dividend outflow, yields, coverage ratios, promoter dividend) are ShareBazaar Online estimates based on disclosed data and stated assumptions. Items that could not be independently verified are marked accordingly. Investments in securities are subject to market risks; please read all related documents carefully and consult a qualified, registered financial adviser. The author and publisher accept no liability for any loss arising from the use of this information.