
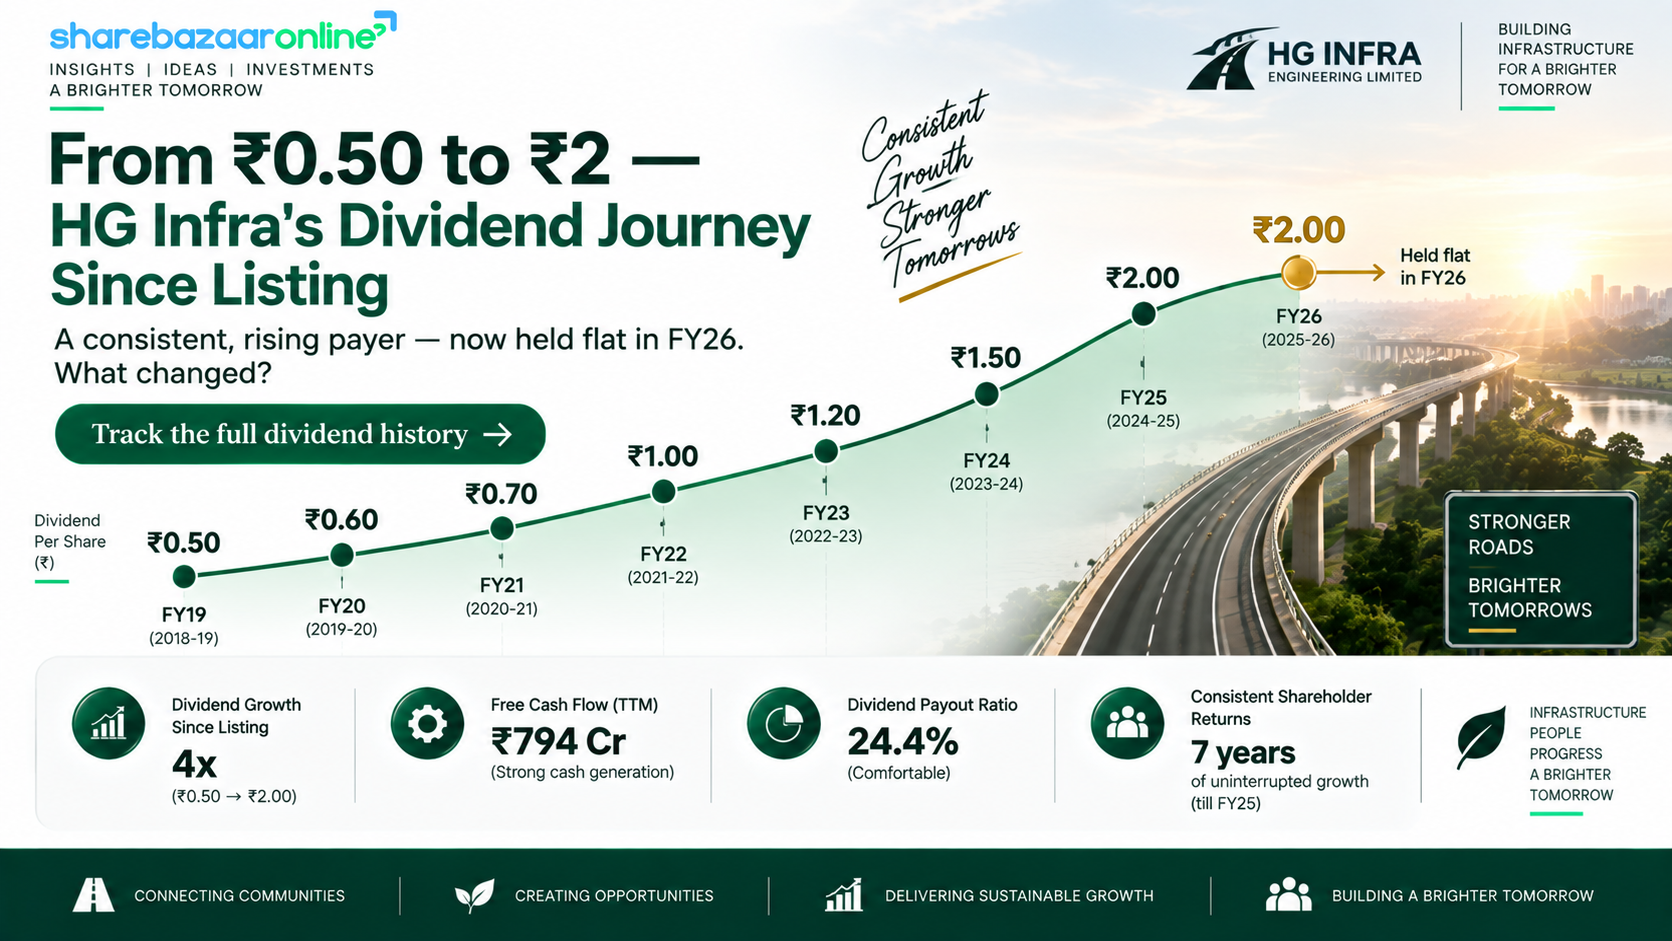
Dividend Snapshot
H.G. Infra Engineering Limited (NSE: HGINFRA | BSE: 541019) has recommended a final dividend of ₹2.00 per equity share for the financial year ended 31 March 2026 — a payout described in the headline as a “20% dividend”. That 20% figure sounds large, but it is simply the dividend expressed as a percentage of the ₹10 face value. Against the actual market price, the real dividend yield is far smaller.
Headline Numbers
- Dividend per share₹2.00
- Dividend rate (on face value)20%
- Face value₹10
- Dividend typeFinal Dividend
- Financial yearFY2025–26
The Yield Reality
- Real yield at CMP (₹484.55)~0.41%
- Yield at announcement price (₹605.55)~0.33%
- Total dividend outflow~₹13.03 cr
- Consolidated payout ratio~3.95%
- Dividend cover (EPS ÷ DPS)~25x
The one-line takeaway: a “20% dividend” that translates to a real cash yield of roughly 0.4%, paid in a year when consolidated net profit fell almost 35%. The dividend itself is tiny relative to profits and is comfortably affordable in absolute terms — but the profit slide, a near-doubling of finance costs, negative group-level free cash flow and an ongoing investigation disclosed by the auditors make this a payout worth reading carefully rather than at face value. CMP as on NSE close, 08 September 2026.
Dividend Announcement Summary
At its board meeting held on Thursday, 28 May 2026, the Board of Directors of H.G. Infra Engineering recommended a final dividend of ₹2.00 per equity share (20% of the ₹10 face value) for FY2025–26. The recommendation is subject to shareholder approval at the company’s 24th Annual General Meeting and, if approved, is to be paid within thirty days from the conclusion of the AGM. The meeting began at 2:30 p.m. and concluded at 5:15 p.m. IST.
What Else the Board Cleared
- Audited standalone and consolidated financial results for Q4 and FY ended 31 March 2026.
- Appointment of Mr. Vikas Jain as Chief Financial Officer (KMP) with effect from 13 July 2026; Mr. Rajeev Mishra moves to Head – Investor Relations & Corporate Affairs.
- Appointment of Mr. Janesh Kumar as Chief Human Resource Officer from 29 May 2026.
- Re-appointment of internal, cost and tax auditors for FY2026–27.
Why This Matters
The dividend is flat versus last year’s ₹2.00 (FY2024–25), even though consolidated profit dropped sharply. Holding the dividend steady in a weaker profit year is a management signal — it can reflect confidence, or simply the fact that a ₹13 crore payout is trivial next to a ₹300 crore-plus profit base and does not stress the balance sheet either way.
Key Dates Timeline
| Event | Date | Source / Status |
|---|---|---|
| Board meeting & announcement | Thu, 28 May 2026 | Company filing |
| Record date | Wed, 12 Aug 2026 | Company filing (Reg 42) |
| Ex-dividend date | Wed, 12 Aug 2026 | Under India’s T+1 settlement, ex-date aligns with record date; corroborated by exchange data |
| 24th AGM | Wed, 19 Aug 2026 | Company filing |
| Payment date | Within 30 days of AGM (statutory outer limit) | No fixed calendar date disclosed by company; law caps at 30 days from AGM conclusion |
Because the record date of 12 August 2026 has already passed, eligibility for this dividend was fixed on that date — investors who held HGINFRA shares as on the record date were entitled to the ₹2.00 payout. The specific credit date is bounded by the statutory limit of 30 days from the AGM held on 19 August 2026; a precise payment date was not disclosed in the board outcome filing.
Dividend Yield Analysis
This is the single most misunderstood number in any Indian dividend headline. A “20% dividend” does not mean you earn 20% on your investment. The 20% is calculated on the ₹10 face value — that is ₹2 per share. What matters to an investor is the yield on the market price you actually pay.
The Two Yields That Matter
- Face-value “rate”20%
- Yield at CMP ₹484.550.41%
- Yield at announcement-day close ₹605.550.33%
Yield = ₹2 ÷ market price × 100. CMP = NSE close, 08 Sep 2026 (external market data).
Reading the Reality Check
At roughly 0.41%, HGINFRA’s yield is a fraction of a typical bank savings account and well below a large-cap dividend stock. Interestingly, the yield has risen from 0.33% at announcement to 0.41% now — but not because the dividend grew. It rose because the share price fell (from ~₹606 to ~₹485). A higher yield driven by a falling price is not a reward; it is a warning to check why the market is repricing the stock.
Dividend History Analysis
| Financial Year | Dividend / Share | Rate on Face Value |
|---|---|---|
| FY2018–19 | ₹0.50 | 5% |
| FY2019–20 / FY2020–21 | Not independently verified | NIV |
| FY2021–22 | ₹1.00 | 10% |
| FY2022–23 | ~₹1.25 (inferred from aggregator totals; NIV) | ~12.5% |
| FY2023–24 | ₹1.50 | 15% |
| FY2024–25 | ₹2.00 | 20% |
| FY2025–26 (this dividend) | ₹2.00 | 20% |
Classification: Consistent, Rising Payer — Now Plateaued
Since its 2018 listing, H.G. Infra has been a consistent annual final-dividend payer with a rising trend — from ₹0.50 to ₹2.00 over roughly seven years. FY26, however, marks the first year the dividend has been held flat rather than raised, coinciding with a sharp profit decline. Confirmed data points are cited from company announcements; intervening years marked NIV should be verified against the annual report.
No Cuts, No Suspensions, No Specials
There is no record of a dividend cut, suspension or one-off special dividend in the verified history. The FY26 payout is an ordinary final dividend, not a special. The steadiness is real, but a flat dividend in a down-profit year is a change in trajectory worth monitoring.
Financial Performance Analysis
H.G. Infra reports under two lenses. The consolidated accounts fold in dozens of road (HAM/BOT) and solar-energy subsidiaries that carry heavy project debt; the standalone accounts reflect the core EPC contracting business. Both fell in FY26, but for different reasons, and the gap between them is itself the story.
Consolidated (FY26 vs FY25)
- Revenue₹5,234.67 cr (+3.5%)
- EBITDA (operating profit)₹1,011.73 cr (−4.5%)
- PBT before exceptional₹403.64 cr (−39.2%)
- Net profit (PAT)₹329.81 cr (−34.7%)
- EPS₹50.61 (−34.7%)
Standalone (FY26 vs FY25)
- Revenue₹5,666.68 cr (−6.4%)
- EBITDA (operating profit)₹733.42 cr (−22.9%)
- Net profit (PAT)₹389.14 cr (−32.6%)
- EPS₹59.71
The Non-Obvious Findings
- Standalone profit is higher than consolidated (₹389 cr vs ₹330 cr). That is unusual and important: the group’s subsidiaries were a net drag. Per the auditors, ten subsidiaries posted a combined net loss of about ₹26.7 crore, and the renewable/HAM SPV build-out carries steep finance costs that pull consolidated profit below the core business.
- Exceptional gains flattered the headline. Consolidated PBT of ₹454.68 cr includes ₹51.04 cr of one-time gains from selling stakes in subsidiaries. Stripping those out, the underlying PBT before exceptional fell ~39% — a steeper decline than the reported PAT drop suggests.
- Finance costs nearly doubled at the consolidated level, up ~77% to ₹468.60 cr, the biggest single reason group profit sank even as revenue nudged higher.
Cash Flow Analysis
Reported profit is an accounting opinion; cash is a fact. For an EPC and infrastructure developer with long working-capital cycles, cash flow tells the truer story — and here it is a tale of two balance sheets.
Operating Cash Flow (OCF)
- Consolidated OCF FY26₹249.71 cr
- Consolidated OCF FY25−₹877.67 cr
- Standalone OCF FY26₹253.18 cr
- Standalone OCF FY25₹119.56 cr
The consolidated OCF swung from deeply negative to positive — a genuine improvement, but off a very weak base.
Free Cash Flow (OCF − Capex)
- Consolidated capex FY26₹954.05 cr
- Consolidated FCF FY26−₹704.34 cr
- Standalone capex FY26₹92.33 cr
- Standalone FCF FY26₹160.85 cr
How Is the Dividend Actually Funded?
At the group level, free cash flow is deeply negative (−₹704 cr) because H.G. Infra is pouring roughly ₹954 crore into building solar, HAM and transmission assets. On a consolidated basis, then, the dividend is not covered by free cash flow — the group is investing far more than it generates and funding growth with debt. At the standalone level, however, the core EPC business threw off positive FCF of ~₹161 crore, which covers the ₹13 crore dividend about 12 times over. The dividend is small enough that the parent’s operating cash easily pays it; the caution is that the consolidated picture shows a group consuming cash to grow, not returning it.
Balance Sheet Strength
Consolidated (FY26)
- Net worth₹3,265.01 cr
- Total borrowings (approx)~₹4,897 cr
- Debt-to-equity1.50x
- Cash & equivalents₹95.29 cr
- Total assets₹10,901.02 cr
Standalone (FY26)
- Net worth₹3,258.89 cr
- Debt-to-equity0.50x
- Current ratio1.20x
- Interest service cover4.06x
The leverage contrast is the headline. The core (standalone) business is conservatively geared at 0.50x debt-to-equity. But the consolidated group runs at 1.50x — three times higher — because each HAM road and solar SPV carries its own project loan. Consolidated debt-service cover for FY26 was a thin 0.74x and interest cover just 1.97x, versus a far healthier 4.06x interest cover standalone. This is normal for an asset-building infra group, but it means group-level debt is rising while the (small) dividend is paid — the classic tension the sector faces.
Dividend Sustainability Analysis
| Coverage Test | Result | Verdict |
|---|---|---|
| Earnings cover (EPS ÷ DPS) | 25.3x (cons) / 29.9x (std) | Very strong |
| Payout ratio | 3.95% (cons) / 3.35% (std) | Very low, easily funded |
| Cash cover (cash ÷ outflow) | 7.3x (19.5x incl. bank balances) | Comfortable |
| FCF cover — standalone | 12.3x | Covered |
| FCF cover — consolidated | Negative (group FCF −₹704 cr) | Not covered at group level |
Overall Rating: Sustainable (Affordability), Conditional (Growth)
In pure affordability terms the ₹13 crore dividend is Sustainable — it is a rounding error against ₹300 crore-plus of profit and is fully covered by the parent’s cash generation. The conditional caveat is the group’s negative free cash flow and rising leverage: the payout survives comfortably today, but any escalation in interest costs, a stalled asset-monetisation pipeline or a further profit slide would test management’s appetite to keep raising it.
The Honest Framing
The right way to read this dividend is not as an income play — a 0.4% yield never will be. It is a small, symbolic capital-return gesture from a company whose real priority is deploying cash into new roads, solar and transmission assets. Sustainability of the token dividend is not in doubt; the question investors should track is whether that capital deployment eventually converts into higher, self-funded returns.
Peer Comparison
| Company | Approx. Dividend Yield | ROE (approx) | Debt/Equity |
|---|---|---|---|
| H.G. Infra Engineering | ~0.41% | ~10% (cons) / ~12% (std) | 1.50x (cons) / 0.50x (std) |
| KNR Constructions | Negligible (token) | ~16.4% | ~0.08x |
| PNC Infratech | Low | ~12.6% | ~0.15x |
| Ashoka Buildcon | Little / none | Not independently verified | Not independently verified |
Peer metrics compiled from external market data and are approximate; blank/NIV cells are intentionally left unpopulated pending confirmation.
The sector context matters. Almost every listed road-EPC contractor — KNR, PNC, Ashoka, IRB — pays a negligible-to-zero dividend, choosing instead to reinvest cash into order books and working capital. H.G. Infra’s ₹2 payout is therefore in line with the sector norm of a token gesture, not an outlier. On the balance sheet, however, H.G. Infra’s consolidated leverage (1.50x) is notably higher than the near-debt-free KNR (0.08x), reflecting its more aggressive asset-development strategy.
Promoter Impact Analysis
Who Gets the ₹13 Crore?
- Promoter holding71.78%
- Promoter dividend income~₹9.36 cr
- Public / institutions~28.22%
- Non-promoter dividend income~₹3.68 cr
Shareholding as per latest available pattern (approx.): FII ~1.4%, DII ~10.1%, public ~16.7%.
What It Means
With promoters holding a hefty 71.78%, roughly ₹9.4 crore of the ₹13 crore dividend flows to the promoter group. That said, the sums are modest — this is not a case of a promoter extracting an outsized cash payout at the cost of the balance sheet. There are no reported promoter share pledges. Minority shareholders receive their proportional ₹2 per share on identical terms.
Taxation Analysis
How Dividends Are Taxed in India (Post-2020 Rules)
- Dividends are fully taxable in the hands of the investor at their applicable income-tax slab rate. There is no separate Dividend Distribution Tax and no exemption.
- The company must deduct TDS at 10% if total dividend paid to a resident shareholder exceeds ₹5,000 in a financial year (20% if PAN is not furnished).
- The dividend is added to “Income from Other Sources” and taxed at 5% / 20% / 30% depending on the investor’s slab.
Worked Example — Investor Holding 1,000 Shares
- Gross dividend (1,000 × ₹2)₹2,000
- TDS applicable? (₹2,000 < ₹5,000 threshold)No TDS on this holding
- Tax at 30% slab₹600
- Net dividend in hand₹1,400
- Net effective yield (on ~₹4.85 lakh invested at CMP)~0.29%
If the same investor’s total HGINFRA dividend for the year exceeded ₹5,000, a 10% TDS would apply and be adjustable against final tax. This is a general illustration, not tax advice; consult a qualified professional for your own situation.
Key Risks
- Ongoing investigation flagged by auditors (governance risk). Both the standalone and consolidated audit reports carry an Emphasis of Matter on a CBI / Anti-Corruption Bureau (Patna) search. An FIR dated 21 January 2026 under the Prevention of Corruption Act named the company; four employees were taken into custody and later granted bail, and cash was confiscated. No charge sheet has been filed and management states there is no impact on the financials, but the outcome is sub-judice and an external firm is reviewing the matter.
- Sharp profit decline. Consolidated PAT fell ~34.7% and standalone PAT ~32.6% in FY26; underlying PBT before exceptional items dropped ~39%. Momentum matters for a stock down heavily over the past year.
- Rising leverage and finance cost. Consolidated debt-to-equity is 1.50x and finance costs jumped ~77% to ₹468.60 cr, compressing profit even as revenue grew.
- Negative group free cash flow. Heavy capex (~₹954 cr) into solar/HAM/transmission assets means the group consumes cash; execution or monetisation delays would strain the balance sheet.
- Client and sector concentration. As an EPC contractor heavily reliant on government road ordering (NHAI/HAM), the business is exposed to award-pace slowdowns, payment cycles and commodity (steel, bitumen) price swings.
- Working-capital intensity. Large contract-asset and receivable balances are inherent to the model and can tie up cash for extended periods.
What To Monitor
- Resolution of the CBI/ACB matter — any charge sheet, regulatory action, or the external firm’s findings, and whether they alter the “no impact” conclusion.
- Order-book inflows and execution pace — new NHAI/HAM, renewable, transmission and water-sector wins, and the revenue-conversion trend that has slipped in FY26.
- Trajectory of consolidated finance costs and debt-to-equity — whether leverage stabilises as SPV assets reach completion (COD) and start generating annuity cash.
- Asset-monetisation pipeline — the pace and pricing of subsidiary/SPV divestments (several HAM road SPVs are being sold), which drive both cash inflow and exceptional gains.
- Margin recovery — standalone operating margin fell to 12.94% from 15.71%; watch for stabilisation.
- Future dividend trajectory — whether the payout resumes its rising path or stays flat, signalling how management weighs capital return against growth capex.
Conclusion
H.G. Infra Engineering’s FY26 final dividend of ₹2.00 per share (20% on face value) is best understood as a modest, symbolic capital return — a ~0.41% real yield — rather than an income opportunity. The payout is comfortably affordable: it consumes under 4% of consolidated profit and is covered many times over by the parent’s cash generation.
The Positives
- Consistent, historically rising dividend record since listing.
- Very low payout ratio — the dividend is never at risk on affordability grounds.
- Operating cash flow turned positive at both levels; standalone FCF is healthy.
- Conservatively geared core (standalone) business at 0.50x D/E.
The Negatives
- Consolidated profit fell ~35%; underlying profit fell ~39%.
- One-time gains flattered the reported number.
- Group leverage 1.50x and finance costs up ~77%.
- Negative group free cash flow; auditor Emphasis of Matter on an ongoing investigation.
The balance of evidence points to a dividend that is safe but small, attached to a business in an investment-heavy, profit-pressured phase with a governance overhang to watch. We present the facts and let you weigh them — this article carries no buy, sell or hold recommendation.
Frequently Asked Questions
What dividend has H.G. Infra Engineering announced for FY2025–26?
What is the actual dividend yield on HGINFRA?
What was the record date for the dividend?
What was the ex-dividend date?
When will the dividend be paid?
Who was eligible to receive this dividend?
How is this dividend taxed?
Is the dividend sustainable?
What is H.G. Infra’s dividend history?
Why did the dividend yield rise if the dividend did not?
Why is consolidated profit lower than standalone profit?
What is the CBI/ACB matter the auditors flagged?
How much of the dividend goes to promoters?
What should investors monitor going forward?
Disclaimer
This article is for informational and educational purposes only and does not constitute investment advice or any buy, sell or hold recommendation. ShareBazaar Online is not a SEBI-registered investment adviser. Dividend, price and yield figures are price-dependent and were computed from the company’s board-meeting outcome and audited FY2025–26 results filing dated 28 May 2026; market prices, shareholding and peer data are sourced from external market data providers and are indicative. All yield figures depend on the live market price and will change. Items marked “Not Independently Verified (NIV)” or “Not Disclosed by Company” should be confirmed against primary sources before use. Investments in securities are subject to market risks; please read all related documents carefully and consult a qualified, registered financial adviser and tax professional before making any decision.