
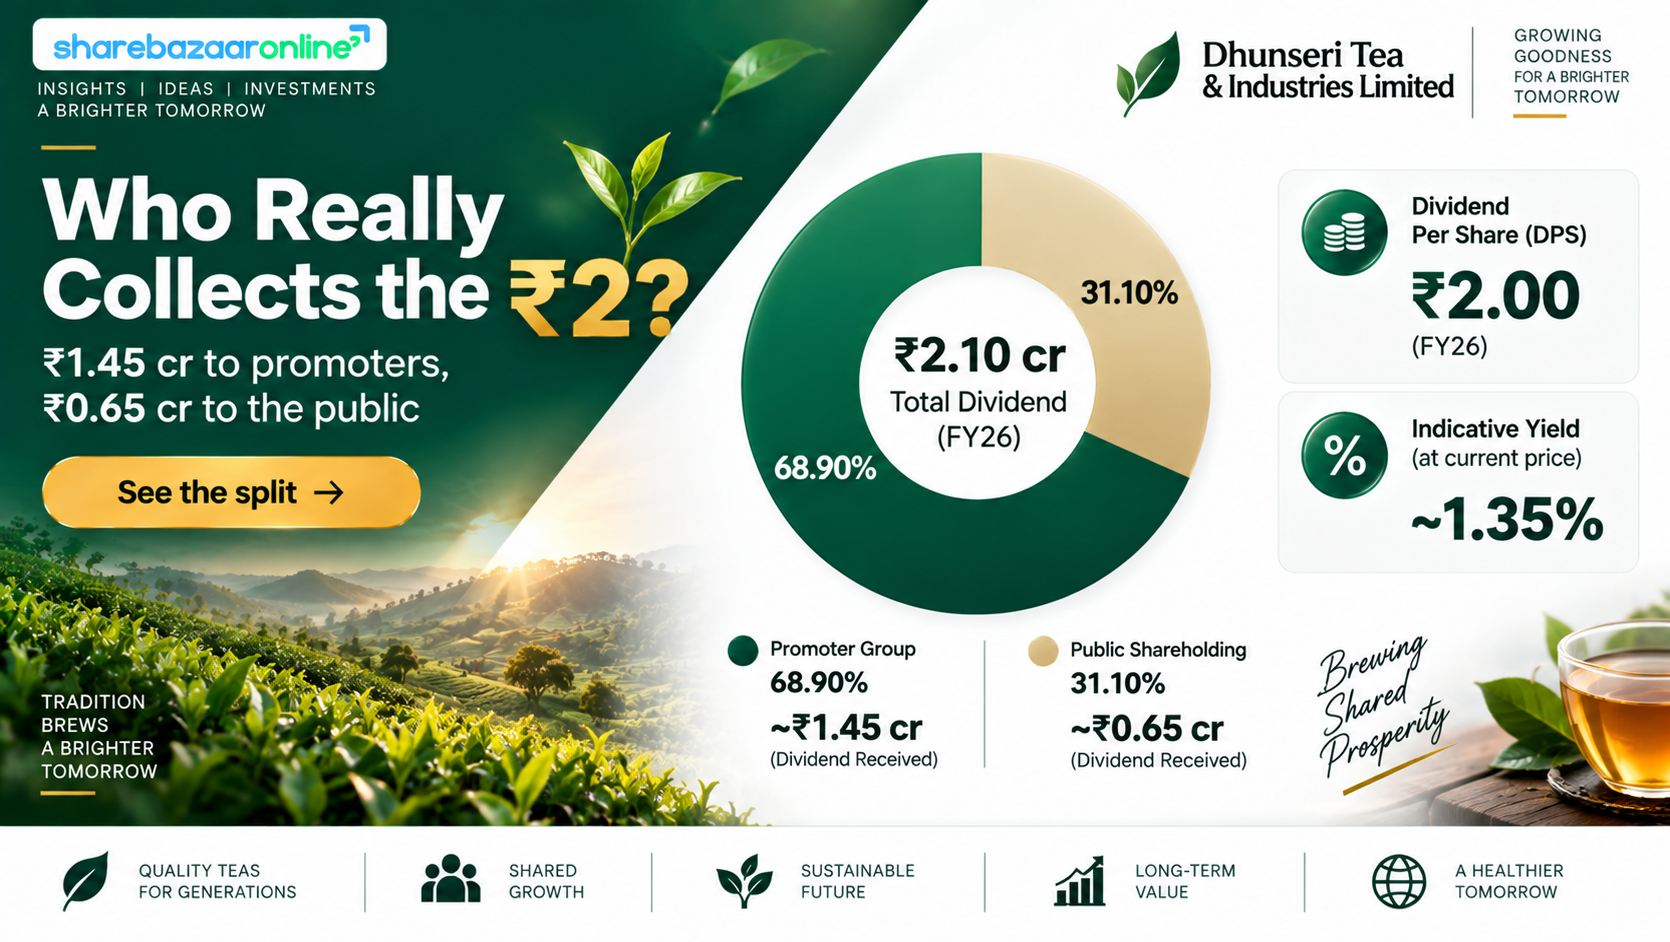
Dividend Snapshot
Dhunseri Tea & Industries Limited (NSE: DTIL, BSE: 538902) declared a final dividend of ₹2.00 per equity share for FY 2025-26 — a headline rate of 20% on the ₹10 face value. The board recommended the payout on 25 May 2026, and shareholders approved it at the 29th Annual General Meeting held on 19 August 2026. At the current market price of about ₹144, the real Dhunseri Tea dividend yield works out to roughly 1.39% — a useful reminder that a big-sounding "20% dividend" is measured against face value, not the price investors actually pay.
The number that matters
Dividend per share: ₹2.00. Face value: ₹10. Total cash outflow across roughly 1.05 crore shares is about ₹2.10 crore — a small distribution relative to the company's balance sheet.
The catch most reports miss
The standalone entity reported a profit of ₹5.90 crore, but the consolidated group posted a net loss of ₹2.50 crore. On a group basis, the dividend is not covered by earnings. The standalone "profit" itself leans heavily on one-time asset-sale gains.
Dividend Announcement Summary
At its board meeting on 25 May 2026, the Board of Directors of Dhunseri Tea & Industries recommended a final dividend of ₹2 per equity share (20%) for the financial year ended 31 March 2026, subject to shareholder approval. That approval was granted at the 29th AGM on 19 August 2026 (conducted via video conference), where members approved the dividend and all other resolutions. The company's statutory auditor, S.R. Batliboi & Co. LLP, issued an unmodified opinion on both the standalone and consolidated FY26 results.
Key facts
Dividend type: Final Dividend
Rate: 20% (₹2.00 per share)
Face value: ₹10
Financial year: FY 2025-26
Sector: Tea / plantations
Year-on-year change
The payout has doubled from ₹1.00 in FY25 to ₹2.00 in FY26. However, it remains well below the ₹3.00–₹5.33 dividends the company paid between 2015 and 2023, keeping DTIL firmly in "irregular payer" territory.
Key Dates Timeline
| Event | Date | Notes |
|---|---|---|
| Board recommendation | 25 May 2026 | Announced with FY26 audited results |
| Record date | 12 August 2026 | Shareholders on record were eligible |
| Ex-date | 12 August 2026 | Inferred under T+1 (same-day convention); confirm against exchange circular |
| AGM (approval) | 19 August 2026 | Dividend approved by shareholders |
| Payment date | Not disclosed by company | Statutory outer limit is within 30 days of AGM approval (on or before 18 September 2026) |
Note: The record date has already passed. Eligibility for this dividend was determined as of 12 August 2026.
Dividend Yield Analysis
The face-value illusion
"20% dividend" sounds generous, but the 20% is calculated on the ₹10 face value, not the traded price. In cash terms it is simply ₹2 per share. The real return an investor earns depends entirely on the price paid.
Yield at current price
At a market price of about ₹144, the yield is ₹2 ÷ ₹144 = ~1.39%. Modest, and below what most fixed-income or higher-yielding equities offer.
Yield on the announcement day
Around the 25 May 2026 announcement the stock traded near ₹192 (approximate), implying a yield of about 1.04%. The higher yield today reflects a falling share price, not a richer dividend.
Yield reality check
The improvement in yield from ~1.04% to ~1.39% over the period is driven mainly by a share-price decline of roughly a quarter over the past year. A higher yield here is a symptom of price weakness plus a doubled payout — not evidence of a high-income stock.
Dividend History Analysis
| Declared | Dividend per share | Type |
|---|---|---|
| FY 2025-26 | ₹2.00 | Final |
| FY 2024-25 | ₹1.00 | Final |
| FY 2023-24 | No dividend traced (NIV) | Apparent omission |
| FY 2022-23 | ₹3.00 | Final |
| FY 2021-22 | ₹4.00 | Final |
| FY 2020-21 | ₹3.33 | Final |
| FY 2019-20 | ₹1.67 | Final |
| FY 2018-19 | ₹3.33 | Final |
| 2018 (approx) | ₹5.33 | Final |
| 2015–2017 (approx) | ₹5.00–₹5.33 | Final |
Source: exchange filings and public dividend-history aggregators (TipRanks/Trendlyne). Historical per-share figures are not adjusted for any corporate actions; verify against official records before publication.
Pattern classification: Irregular / cyclical payer
DTIL's record shows a clear long-term downward drift: dividends near ₹5 in 2015–2018, then a volatile ₹1.67–₹4.00 band through 2019–2023, an apparent omission around FY24, a low of ₹1.00 in FY25 and a recovery to ₹2.00 in FY26. This is not a steady compounder's dividend track; it moves with the tea cycle and asset-sale gains. The right label is irregular payer with a cyclical, declining long-term profile.
Financial Performance Analysis
Where the standalone profit really came from
On paper, standalone profit after tax jumped ~154%, from ₹2.32 crore in FY25 to ₹5.90 crore in FY26. That growth looks impressive until you trace the build-up. Standalone revenue was essentially flat (₹326.24 crore, down 0.24%), and the core tea operations were loss-making.
| Standalone FY26 build-up | ₹ crore |
|---|---|
| Operating result excluding other income | –14.42 (loss) |
| Add: other income | +10.43 |
| Profit before exceptional items & tax | –3.99 (loss) |
| Add: exceptional gains (tea-estate asset sales) | +6.39 |
| Profit before tax | +2.41 |
| Add: net tax credit | +3.49 |
| Profit after tax (standalone) | +5.90 |
The reported profit rests on other income, one-time asset-sale gains and a tax credit — not on the underlying tea business, which lost money at the operating level.
Exceptional items in detail
FY26 exceptional gains of ₹6.39 crore came from selling specified assets of the Balijan Tea Estate (₹4.35 crore) and the Deohall Tea Estate (₹2.05 crore). These are non-recurring and reduce the productive asset base.
Consolidated: still a loss
Consolidated revenue rose 3.24% to ₹471.16 crore, and the net loss narrowed sharply to ₹2.50 crore (from a ₹20.05 crore loss in FY25) — an 87.5% improvement. Consolidated EPS remains negative at ₹–2.38.
Cash Flow Analysis
Reported profits are opinions; cash is fact. On the cash-flow statement, DTIL looks healthier than its income statement. Standalone operating cash flow (OCF) was ₹21.74 crore — comfortably positive and far larger than the tiny ₹2.10 crore dividend — helped by non-cash add-backs and a release of working capital.
Standalone free cash flow
OCF of ₹21.74 crore less capex of ₹13.85 crore leaves free cash flow of ~₹7.88 crore — enough to cover the dividend 3.75 times at the standalone level.
Consolidated free cash flow is negative
At group level, OCF of ₹27.67 crore was outweighed by capex of ₹42.70 crore, leaving consolidated free cash flow of about –₹15.03 crore. The group is still investing more than it generates.
OCF vs profit — the divergence
The standalone entity converted a modest reported profit into strong OCF, which is positive for dividend affordability. But the quality of the underlying profit is weak, and the group's overall cash position is being consumed by heavy plantation capex. In short: the dividend is funded from standalone cash flows and the company's large investment buffer, not from group-wide profitability.
Balance Sheet Strength
Trading well below book value
Standalone book value per share is about ₹519 and consolidated book value about ₹504. At a market price near ₹144, the stock trades at roughly 0.28 times book — a deep discount, reflecting weak returns on that asset base.
Cash, investments and debt
Standalone cash and bank balances are thin at about ₹2.56 crore, but non-current investments of ₹156.61 crore (largely in group entities) provide a large cushion. Standalone borrowings total about ₹84.91 crore; consolidated borrowings are about ₹248.95 crore.
Net debt picture
Excluding the strategic investment book, standalone net debt is roughly ₹82.35 crore and consolidated net debt about ₹222.56 crore. The company noted a low interest-coverage ratio, so debt servicing against thin operating profits is a genuine watch-point even as a small dividend is paid.
Dividend Sustainability Analysis
| Sustainability test | Result | Read |
|---|---|---|
| Earnings coverage (standalone EPS ÷ DPS) | 2.81x | Covered, but profit quality is weak |
| Earnings coverage (consolidated) | –1.19x | Not covered — group is loss-making |
| Payout ratio (standalone) | 35.6% | Moderate on standalone PAT |
| OCF coverage (standalone) | 10.34x | Strong |
| FCF coverage (standalone) | 3.75x | Comfortable |
| Cash + investments coverage (standalone) | ~75.7x | Very large liquidity buffer |
Verdict: Conditionally Sustainable
In pure cash terms the ₹2.10 crore dividend is easily affordable — standalone OCF, FCF and the investment buffer all cover it many times over. But three flags keep this out of the "clearly sustainable" bucket: the standalone profit is built on asset sales, other income and a tax credit rather than core tea earnings; the consolidated group is still loss-making; and part of the recent cash has come from selling tea estates. The dividend is Conditionally Sustainable — safe for now given liquidity, but dependent on the tea business turning around rather than continued asset monetisation.
Peer Comparison
| Company | DPS (FY26) | Approx. yield | Notes |
|---|---|---|---|
| Dhunseri Tea & Industries | ₹2.00 | ~1.39% | Trades ~0.28x book; consolidated loss |
| Jay Shree Tea & Industries | NIV | NIV | Listed tea peer |
| Goodricke Group | NIV | NIV | Listed tea peer |
| McLeod Russel India | NIV | NIV | Loss-making, low price |
| United Nilgiri Tea Estates | NIV | NIV | Listed tea peer |
Peer per-share dividend, yield, ROE and ROCE cells are left as NIV (Not Independently Verified) pending desk confirmation, rather than populated with unconfirmed figures. Sector context: Indian listed tea companies broadly carry sub-2% yields and cyclical earnings, so DTIL's ~1.39% is typical rather than an outlier.
Promoter Impact Analysis
Who collects the cash
The promoter group holds 68.90% (as of March 2026), with Naga Dhunseri Group Limited alone owning 54.56%. Of the total ₹2.10 crore payout, the promoter group receives about ₹1.45 crore, of which Naga Dhunseri Group takes roughly ₹1.15 crore.
What minority holders get
Public shareholders (about 31.1%, including DIIs at 1.99% and no FII holding) share the remaining ~₹0.65 crore. Because promoters own the large majority, most of the distribution flows back to the founding group.
Capital-allocation lens
With the stock at ~0.28x book and the group loss-making, management faced a choice between paying this small dividend and using the cash to reduce debt, fund capex, or buy back deeply discounted shares. The ₹2.10 crore payout is minor relative to ₹84.91 crore of standalone borrowings, so it does not materially weaken the balance sheet — but it also does little to address the low interest-coverage flag.
Taxation Analysis
How dividends are taxed in India
Since April 2020, dividends are taxed in the hands of the shareholder at their applicable income-tax slab rate. Companies deduct TDS at 10% under Section 194 if a resident individual's total dividend from that company in a financial year exceeds ₹5,000. TDS is adjustable against final tax liability.
Worked example
An investor owns 1,000 shares and receives ₹2 per share in the 30% tax slab:
| Gross dividend (1,000 × ₹2) | ₹2,000 |
| TDS under Section 194 | ₹0 (below the ₹5,000 threshold) |
| Tax at 30% slab | ₹600 |
| Net dividend in hand | ₹1,400 |
| Effective post-tax yield (at ₹144) | ~0.97% |
Applicable surcharge and cess are not shown; actual tax varies with each investor's total income and slab. This is general information, not tax advice.
Key Risks
1. Loss-making core operations. The standalone tea business lost about ₹14.42 crore at the operating level (excluding other income) in FY26; reported profit depended on asset sales and a tax credit.
2. Consolidated losses. The group posted a ₹2.50 crore net loss in FY26 and a ₹20.05 crore loss the year before; the African (Malawi) plantation operations add currency and hyperinflation-accounting complexity.
3. Commodity and weather cyclicality. Tea prices, monsoon-dependent yields and seasonal production make earnings volatile from quarter to quarter, as the company itself notes.
4. Debt and low interest coverage. Consolidated borrowings of about ₹248.95 crore against thin operating profits leave a low interest-coverage ratio and limited room for error if rates or losses rise.
5. Shrinking asset base and cost pressure. Selling tea estates (Balijan, Deohall) supports near-term cash and profit but reduces the productive base; new labour codes effective November 2025 also add to employee-cost obligations.
What To Monitor
1. Core operating profitability. Watch whether the tea business can generate profit without exceptional asset-sale gains and other income in coming quarters.
2. Return to consolidated profit. Track whether the narrowing group loss turns into a genuine consolidated profit, especially from the Malawi operations.
3. Debt trajectory and interest coverage. Monitor whether borrowings fall and interest coverage improves alongside dividend payments.
4. Capex versus cash generation. Consolidated free cash flow was negative in FY26; watch whether plantation capex normalises so the group self-funds.
5. Dividend consistency. After an apparent FY24 gap and a ₹1–₹2 range, watch whether the payout stabilises or resumes its long-term decline.
Conclusion
Dhunseri Tea & Industries' FY26 final dividend of ₹2 per share (20%) doubles last year's payout, but the headline flatters the substance. The real yield is about 1.39%, the standalone profit that backs the dividend is built almost entirely on asset sales, other income and a tax credit, and the consolidated group remains loss-making. In cash terms the small ₹2.10 crore distribution is easily covered by standalone operating cash flow and a large investment buffer, which is why we classify it as Conditionally Sustainable rather than clearly sustainable.
The more interesting story sits beneath the dividend: a stock trading at roughly 0.28x book value, a promoter group collecting most of the payout, and a core tea business that still needs to prove it can earn money without selling estates. Income-focused readers should weigh the modest yield against a cyclical, irregular payout history; value-focused readers will note the steep discount to book alongside the underlying operating losses. This article presents the positives, negatives, risks and monitoring factors; the decision rests with you.
Frequently Asked Questions
What dividend has Dhunseri Tea & Industries announced for FY 2025-26?
What is the Dhunseri Tea dividend yield?
What was the record date for the DTIL dividend?
What was the ex-date?
When will the dividend be paid?
Who was eligible for the dividend?
How is this dividend taxed?
Is the DTIL dividend sustainable?
Why did the standalone company report a profit while the group reported a loss?
What is the dividend history of Dhunseri Tea?
How much of the dividend goes to promoters?
Why does the stock trade so far below book value?
What should investors monitor from here?
Disclaimer
This article is for informational and educational purposes only and does not constitute investment, financial, legal or tax advice, nor a recommendation to buy, sell or hold any security. ShareBazaar Online is not a SEBI-registered investment adviser or research analyst. Figures are drawn from the company's audited FY26 results and publicly available sources; market-price-dependent metrics (yields, P/B) change continuously and were computed at an assumed market price of about ₹144. Items that could not be independently verified are marked "Not Disclosed by Company" or NIV. Readers must verify all figures against official exchange filings and consult a qualified professional before making any investment decision. Investments in securities are subject to market risks.