
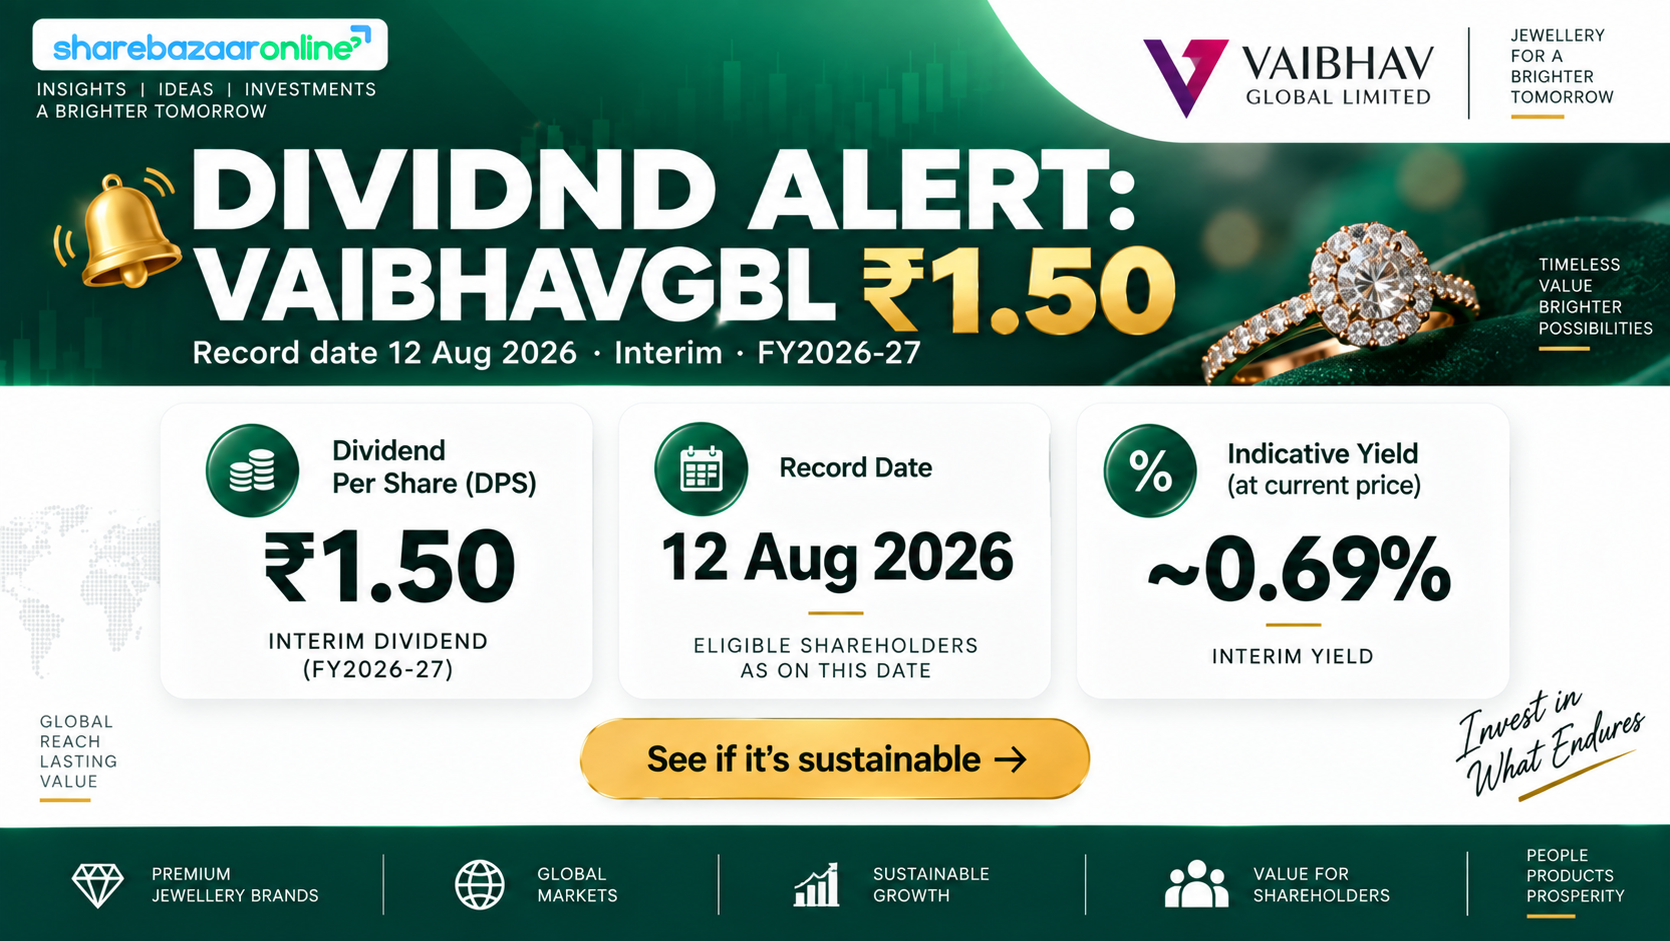
Dividend Snapshot
Vaibhav Global Limited (NSE: VAIBHAVGBL, BSE: 532156) declared an interim dividend of ₹1.50 per equity share on a face value of ₹2 — a headline payout of 75% of face value — for the financial year 2026-27, alongside its unaudited Q1 FY27 results on 4 August 2026. The eye-catching “75% dividend” figure is a percentage of face value, not a return on your investment. At the current market price of about ₹218, this single interim payout works out to a real yield of only about 0.69%, and the company’s full-year run-rate of ₹6 per share translates to roughly 2.75%.
Payout & Yield
- Dividend Type: Interim Dividend (FY2026-27)
- Dividend Per Share: ₹1.50
- Face Value: ₹2.00 (75% of face value)
- Interim Yield @ ₹218: ~0.69%
- Annualised Yield (₹6 run-rate): ~2.75%
Scale & Coverage
- Shares Outstanding: ~16.73 crore
- Interim Dividend Outflow: ~₹25.10 crore
- Annual Outflow (₹6): ~₹100.38 crore
- FY26 Payout Ratio: ~37.7%
- Sustainability View: Sustainable (with a leverage caveat)
The one-line takeaway: A financially comfortable, consistent quarterly payer — but the “75%” label flatters a modest cash return, and the elevated headline yield owes as much to a ~24% one-year fall in the share price as to the dividend itself.
Dividend Announcement Summary
At its board meeting held on Tuesday, 4 August 2026 (commenced 15:30 IST, concluded 20:00 IST), the Board of Directors of Vaibhav Global Limited declared an interim dividend of ₹1.50 per fully paid-up equity share (face value ₹2 each) for FY2026-27. The company fixed Wednesday, 12 August 2026 as the record date, and stated the dividend would be credited or dispatched within 30 days of declaration.
What the Board Approved
- Unaudited Q1 FY27 results (consolidated & standalone)
- Interim dividend of ₹1.50/share (FY2026-27)
- Grant of Stock Options & Restricted Stock Units under employee benefit plans
- Appointment of Ernst & Young LLP as internal auditors for FY2026-27 and FY2027-28
Why It Matters
This is the first interim dividend of FY2026-27 and continues an established pattern — VGL has paid ₹1.50 per quarter (₹6 per year) for the past three financial years. Unlike a one-off special dividend, this is part of a steady, recurring distribution policy funded from operating cash flow.
Note on classification: Some aggregators tagged this as a “final dividend for FY2025-26.” The company’s own exchange filing is explicit: it is an interim dividend for FY2026-27. We follow the company disclosure.
Key Dates Timeline
Announcement Date
4 August 2026 (Board Meeting)
Record Date
12 August 2026 (Wednesday)
Ex-Date
Effectively 12 August 2026 under the T+1 settlement cycle (ex-date typically coincides with, or falls one trading day before, the record date). Inferred — to be confirmed against the official NSE/BSE corporate-action circular.
Payment Date
Not disclosed as a specific date by the company. Statutory outer limit: within 30 days of declaration, i.e. on or before ~3 September 2026.
Shareholders whose names appeared in the register on the record date (12 August 2026) were entitled to this interim dividend. As the record date has passed, eligibility for this particular payout is now closed.
Dividend Yield Analysis
This is the section where the “75% dividend” headline meets reality. The 75% figure is simply ₹1.50 expressed as a percentage of the ₹2 face value — a bookkeeping convention that has nothing to do with what a shareholder actually earns.
The Real Yield Maths
- Face-value dividend: 75% (₹1.50 ÷ ₹2)
- This interim payout @ ₹218: ~0.69% (₹1.50 ÷ ₹218)
- Full-year ₹6 run-rate @ ₹218: ~2.75%
- Yield on ~₹265 announcement-day price: ~0.57% (approx; exact 4-Aug-2026 close not independently verified — NIV)
Yield Reality Check
VGL’s ~2.75% annualised yield is high for the gems and jewellery space (where majors typically yield well under 1%). But the dividend has been flat at ₹6 for three years — the yield rose mainly because the share price fell ~24% over the last year and roughly halved over three years. A rising yield here signals price de-rating as much as shareholder generosity.
Dividend History Analysis
| Ex-Date (approx) | Dividend/Share | Type / Frequency |
|---|---|---|
| Aug 2026 (record 12-Aug) | ₹1.50 | Interim (FY27) |
| Aug 2025 / Jun 2025 | ₹1.50 | Interim / Final |
| Feb 2025 | ₹1.50 | Quarterly |
| Nov 2024 | ₹1.50 | Quarterly |
| Aug 2024 | ₹1.50 | Quarterly |
| Feb 2024 / Nov 2023 / Aug 2023 | ₹1.50 each | Quarterly |
Source: exchange filings and dividend aggregators (TipRanks/INDmoney). VGL has paid four dividends of ₹1.50 each (₹6 total) in each of the last three financial years.
Classification: Consistent Payer
On a recent-history basis VGL is a Consistent (quarterly) Payer, reliably distributing ₹6 per year. The dividend has strong earnings and cash backing every quarter.
The Nuance Aggregators Miss
The per-share dividend has been frozen at ₹6 for three years even as consolidated EPS more than doubled (from ~₹6.4 in FY23 to ~₹15.9 in FY26). The five-year dividend-growth rate is therefore slightly negative in real terms, and the company has cut its dividend at least once in its longer history. This is income stability, not income growth.
Financial Performance Analysis
All figures below are consolidated (VGL is a global group with 13 subsidiaries across the USA, UK, Germany, Netherlands and Asia). For a business that earns the vast majority of its revenue abroad, the consolidated view is the only meaningful one.
Q1 FY27 (Quarter to 30 Jun 2026)
- Revenue: ₹917.07 cr (+12.7% YoY)
- Operating Profit: ~₹97 cr (+56% YoY), OPM ~11%
- EBITDA (as reported by company): ~₹102 cr (+37% YoY)
- PAT: ₹56.38 cr (+49.8% YoY)
- Basic EPS: ₹3.37 (vs ₹2.26)
Full-Year Trend (Consolidated)
- FY26 Revenue: ₹3,692 cr; PAT ₹266 cr; EPS ~₹15.9
- FY25 Revenue: ₹3,380 cr; PAT ₹153 cr; EPS ~₹9.2
- 5-yr sales CAGR: ~8% (company-flagged as modest)
- ROE: ~17.9%; ROCE: ~16.4%
The Non-Obvious Finding: A One-Time Tariff Refund Flattered Q1
VGL’s US subsidiaries received a refund of import tariffs earlier paid under US trade measures. In Q1 FY27 the company recorded ₹25.6 crore (USD 2.69 mn) as other operating revenue plus ~₹1.5 crore of interest income tied to this refund. That means a meaningful slice of the headline profit jump is non-recurring. Strip it out and the underlying operating improvement, while still positive, is more modest than the ~50% PAT growth suggests. Separately, the company also paid ~₹14.3 crore of Section 122 tariffs whose refund is not yet considered probable.
Operating Leverage & Segment Divergence
Growth in Q1 was US-led: the USA segment result rose to ~₹58.3 cr from ~₹33.7 cr. The UK segment slipped to a small loss (about ₹-0.5 cr, from a ~₹9.8 cr profit a year earlier), and Europe (ex-UK) also turned loss-making. Revenue rose faster than the reported employee and content/broadcasting costs, so operating leverage was positive at group level — but the geographic mix is increasingly dependent on the US.
Cash Flow Analysis
Reported profit is an opinion; cash is a fact. Here VGL screens well: its earnings are genuinely cash-backed, which is the single most important test for a dividend’s durability.
Operating Cash Flow vs Profit (FY26)
- Cash from Operations: ₹310 cr
- Net Profit: ₹266 cr
- OCF / PAT: ~116% (profits fully backed by cash)
- Free Cash Flow: ~₹290 cr
How the Dividend Is Funded
The full-year dividend (~₹100 cr) is comfortably covered by FY26 free cash flow (~₹290 cr) — a coverage of ~2.9x. This interim payout of ~₹25 cr is covered ~11.6x. The dividend is paid out of current operating cash flow, not from reserves, asset sales or fresh borrowing.
The Working-Capital Watch-Point
Cash generation improved in FY26 (FCF ~₹290 cr vs ~₹135 cr in FY25), but VGL runs a long cash-conversion cycle of ~189 days, driven by inventory of ~232 days — typical for a jewellery inventory model, yet a permanent drag on cash. Any deterioration in inventory or receivables (debtor days ~34) would quickly tighten the cash available for distribution.
Balance Sheet Strength
Capital Structure (Mar 2026)
- Equity Capital: ~₹33 cr
- Reserves: ~₹1,615 cr
- Book Value: ~₹98.6/share
- Borrowings: ~₹416 cr
- Debt-to-Equity: ~0.25x (comfortable)
The Non-Obvious Finding: Borrowings Nearly Doubled
Total borrowings rose ~82%, from ~₹228 cr (Mar 2025) to ~₹416 cr (Mar 2026). On a ₹1,648 cr equity base the leverage is still low, and finance costs are small (~₹15 cr/yr). But it is worth asking why debt is rising while the company pays out ~₹100 cr a year — the extra borrowing appears linked to working capital, capex and acquisitions rather than to funding the dividend.
Net-debt note: The exact consolidated cash-and-equivalents balance is not separately broken out on the summary financials we reviewed — marked NIV (Not Independently Verified). Given ~₹290 cr of FY26 free cash flow and a credit-rating upgrade (CARE A+ / A1+), balance-sheet stress is not a near-term concern.
Dividend Sustainability Analysis
| Test | Metric | Verdict |
|---|---|---|
| Earnings Coverage | EPS ₹15.97 ÷ ₹6 = 2.66x | Strong |
| OCF Coverage | OCF/PAT ~116% | Strong |
| FCF Coverage | ₹290 cr ÷ ₹100 cr = 2.89x | Strong |
| Liquidity / Leverage | D/E ~0.25x; reserves ~₹1,615 cr | Adequate (borrowings rising) |
Overall: Sustainable
On all four tests VGL’s current ₹6-per-year dividend is Sustainable. Earnings cover it 2.7x, cash flow covers it comfortably, and the payout ratio has actually fallen to ~38% (from 94% in FY23) as profits recovered while the dividend stayed flat — leaving ample headroom. The only caveat is the rising borrowing trend, which bears watching but does not currently threaten the payout.
Peer Comparison
| Company | Annualised Yield | Payout | ROE | ROCE |
|---|---|---|---|---|
| Vaibhav Global | ~2.75% | ~38% | ~17.9% | ~16.4% |
| Gems/jewellery major (e.g. Titan) | NIV | NIV | NIV | NIV |
| Peer 2 | NIV | NIV | NIV | NIV |
Peer-specific cells are intentionally marked NIV (Not Independently Verified) pending a live desk re-run against confirmed same-date data, rather than populated with unconfirmed figures.
In directional terms, VGL’s ~2.75% annualised yield is unusually high for the listed gems and jewellery space, where large peers typically distribute a much smaller share of profits and yield well under 1%. VGL’s stand-out yield reflects both its higher payout discipline and, importantly, a de-rated share price. Its ROE (~18%) and ROCE (~16%) are respectable but not sector-leading. Exact peer figures should be confirmed on the same date before publication.
Promoter Impact Analysis
Who Receives the Dividend
- Promoters: 57.33%
- FIIs: 16.66%
- DIIs: 2.22%
- Public & Others: ~23.79%
Rupee Split of the Payout
- Promoter share (this interim): ~₹14.39 cr
- Promoter share (full-year ₹6): ~₹57.55 cr
- Non-promoter share (this interim): ~₹10.70 cr
The Shareholding Trend Worth Noting
Promoter holding is stable at ~57%, so more than half of every rupee distributed flows to the promoter group — a common alignment feature, since promoters benefit only alongside minority holders on a strict per-share basis. More striking is the steady FII exit: foreign holding has fallen from ~22.7% (Mar 2024) to ~16.7% (Jun 2026), partly offset by a rising public/retail base. This selling pressure has contributed to the share-price weakness that, in turn, lifted the dividend yield.
Taxation Analysis
Since the abolition of the Dividend Distribution Tax (April 2020), dividends are taxed in the hands of the investor at their applicable income-tax slab rate. The company deducts TDS under Section 194 at 10% if the aggregate dividend paid to a resident shareholder in a financial year exceeds ₹10,000 (the threshold was raised from ₹5,000 with effect from FY2025-26). TDS is 20% if PAN is not furnished. Any TDS is adjustable against the investor’s final tax liability.
Worked Example — This Interim Dividend
- Holding: 1,000 shares
- Dividend @ ₹1.50: ₹1,500 gross
- TDS: ₹0 (below the ₹10,000 threshold)
- Tax @ 30% slab: ₹450
- Net in hand: ₹1,050
- Post-tax yield @ ₹218: ~0.48%
Worked Example — When TDS Applies
- Holding: 10,000 shares, full-year ₹6
- Gross dividend: ₹60,000
- TDS @ 10% (> ₹10,000): ₹6,000
- Tax @ 30% slab: ₹18,000
- Net after full tax: ₹42,000
For an investor in the 30% bracket, the effective post-tax return on this interim payout is roughly 0.48% — underlining why the “75%” face-value figure should never be read as a return. Tax outcomes depend on individual circumstances; investors should confirm current rules with a qualified tax adviser.
Key Risks
- Currency & geographic concentration: The overwhelming majority of revenue comes from the USA and UK, so USD-INR and GBP-INR swings materially affect reported earnings — and therefore the pool from which dividends are paid.
- US tariff / trade-policy risk: The Q1 profit benefited from a ~₹25.6 cr tariff refund, but the company has also paid ~₹14.3 cr of Section 122 tariffs whose refund is not yet considered probable, and the matter remains before US courts.
- Weak overseas segments: The UK business turned to a small operating loss in Q1 FY27 and Europe (ex-UK) also lost money — growth is now heavily dependent on the USA.
- Rising leverage & long working-capital cycle: Borrowings jumped ~82% YoY and the cash-conversion cycle is ~189 days; any inventory build-up or margin slip would pressure free cash flow.
- Sustained FII selling: Foreign holding has fallen from ~22.7% to ~16.7% over two years, adding to share-price weakness and reducing float liquidity.
- Structural TV-shopping headwinds & flat dividend: The core electronic-retail model faces cord-cutting pressures, and the per-share dividend has not grown in three years despite higher profits.
What To Monitor
- USD-INR / GBP-INR and hedging cover — the biggest single swing factor for group earnings.
- US tariff litigation outcome — whether the Section 122 tariffs are refunded, and how the contingent asset is ultimately treated.
- UK & Europe segment margins — a return to profitability, or a deepening loss, will drive the next leg of consolidated earnings.
- Borrowings and working-capital days — watch whether debt keeps rising and whether the ~189-day cash-conversion cycle lengthens.
- Dividend trajectory — whether management finally lifts the payout above ₹6 now that the payout ratio has fallen to ~38%.
- FII holding and customer KPIs — a reversal of foreign selling and improving retention/repeat-purchase metrics would signal renewed confidence.
Conclusion
Vaibhav Global’s ₹1.50 interim dividend is a well-covered, cash-backed continuation of a reliable quarterly habit — on our four-test scorecard it reads as Sustainable. Earnings cover it 2.7x, free cash flow covers the full-year payout ~2.9x, and the payout ratio has fallen to a comfortable ~38%.
But the details matter. The “75% dividend” is a face-value label worth only about 0.69% at today’s price; the full-year run-rate yields ~2.75%, and much of that headline yield exists because the share price has fallen ~24% in a year. Q1’s profit surge was flattered by a one-time tariff refund, overseas segments outside the US are wobbling, borrowings have nearly doubled, and foreign investors have been steadily exiting. This is a stable income stock with genuine cash strength — not an income-growth story — and the positives and negatives are laid out here so readers can weigh them for themselves.
Frequently Asked Questions
What dividend has Vaibhav Global announced?
What is the Vaibhav Global dividend yield?
What was the record date for the dividend?
What is the ex-date?
When will the dividend be paid?
Who was eligible for the dividend?
How is the Vaibhav Global dividend taxed?
Is the Vaibhav Global dividend sustainable?
What is Vaibhav Global’s dividend history?
Why is the “75% dividend” figure misleading?
How much of the dividend goes to promoters?
What should investors monitor going forward?
Disclaimer
This article is for informational and educational purposes only and does not constitute investment, financial, legal or tax advice, nor any buy, sell or hold recommendation. ShareBazaar Online is not a SEBI-registered investment adviser. All figures are drawn from Vaibhav Global Limited’s exchange filings and publicly available third-party sources and may contain errors or become outdated; several items (including the exact announcement-day price, precise net-debt, and peer-specific metrics) are marked NIV (Not Independently Verified) and require confirmation. Dividend yields are price-dependent and change with the live market price. Taxation depends on individual circumstances and prevailing law. Readers must conduct their own due diligence and consult a qualified, SEBI-registered financial adviser and tax professional before making any investment decision. Investments in securities are subject to market risks.