
Dividend Snapshot
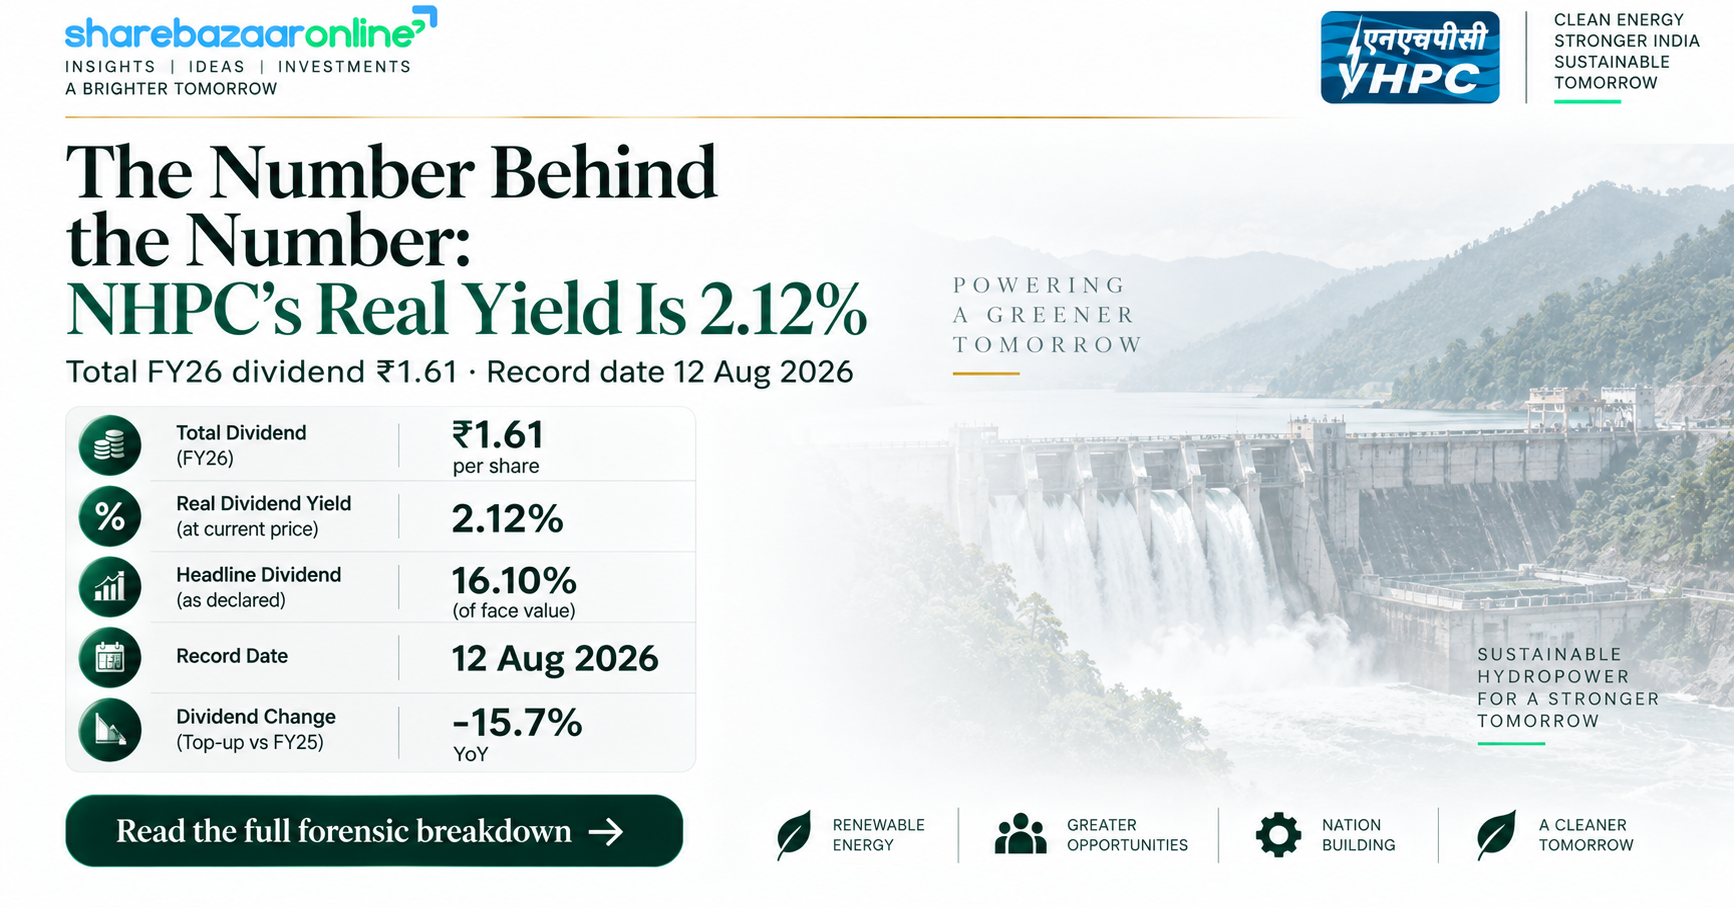
NHPC Limited (NSE: NHPC | BSE: 533098), India's largest hydropower producer and a Government of India Navratna, has declared a final dividend of ₹0.21 per share for FY2025-26. Headlined as a 2.10% dividend on the ₹10 face value, it sits on top of an interim dividend of ₹1.40 per share already paid in February 2026, taking the total FY26 dividend to ₹1.61 per share (16.10% of face value).
Here is the honest headline our desk wants you to see first: a "16.10% dividend" translates into a real dividend yield of just 2.12% at the current market price of ₹75.90 (NSE, 8 September 2026). And unusually, the total payout is down 15.7% from FY25's ₹1.91 even though NHPC reported a record profit — a divergence we unpack below.
| Company | NHPC Limited |
| NSE / BSE | NHPC / 533098 |
| ISIN | INE848E01016 |
| Dividend Type | Final Dividend |
| Final Dividend | ₹0.21 (2.10%) |
| Face Value | ₹10 |
| Total FY26 Dividend | ₹1.61 (16.10%) |
| Announcement Date | 15 May 2026 |
| Record Date (Final) | 12 Aug 2026 |
| Real Yield (on CMP) | 2.12% |
| Total Payout (FY26) | ₹1,617 cr |
| Financial Year | FY2025-26 |
Dividend Announcement Summary
At its board meeting on Friday, 15 May 2026 (held 6:25 PM to 7:25 PM), the NHPC board approved the audited standalone and consolidated results for the quarter and year ended 31 March 2026 and recommended a final dividend of ₹0.21 per equity share — 2.10% of the ₹10 face value — on the paid-up equity share capital of ₹10,045.03 crore.
Per the exchange filing, this final dividend is "in addition to the interim dividend of ₹1.40 per equity share for FY2025-26 paid in February 2026." That takes the total dividend to ₹1.61 per share (16.10%) for the year. The company confirmed the final dividend was subject to shareholder approval at the ensuing Annual General Meeting and would be paid within the statutory period under the Companies Act, 2013.
What the wire coverage missed: the same ₹0.21 final dividend is a sharp 58.8% cut from the ₹0.51 final paid for FY25. The interim leg (₹1.40) was held flat, so the entire reduction sits in the final. This is the first year-on-year fall in NHPC's total annual dividend in at least six years — and it lands in the same year the company posted its highest-ever reported profit. That contradiction is the real story, and it is driven by cash, not accounting profit.
Key Dates Timeline
| Event | Date | Source / Status |
|---|---|---|
| Board Meeting / Announcement | 15 May 2026 | Exchange filing NH/CS/199 |
| Record Date (Final Dividend) | 12 Aug 2026 | Exchange corporate action |
| Ex-Dividend Date | 12 Aug 2026 | Aggregator data (T+1 settlement) |
| Book Closure | 13 Aug – 28 Aug 2026 | Exchange filing |
| 50th AGM (Approval) | 28 Aug 2026 | Approved via VC/OAVM |
| Payment Date | Within 30 days of AGM | Statutory limit; exact date Not Disclosed by Company in filing |
The record date of 12 August 2026 has already passed. Shareholders whose names appeared in the register of members on that date were eligible for the final dividend, which the AGM approved on 28 August 2026. The company did not disclose an exact payment date in the results filing; under the Companies Act, 2013 the final dividend must be paid within 30 days of AGM approval, i.e. on or before roughly late September 2026.
Dividend Yield Analysis
Dividend yield is simply the annual dividend divided by the share price. It is the number that matters to an investor buying today — not the face-value percentage. NHPC's headline "16.10%" is calculated on the ₹10 face value, not on what you actually pay for the share.
Yield on Current Price
Total dividend ₹1.61 ÷ CMP ₹75.90 = 2.12%.
Final-only ₹0.21 ÷ ₹75.90 = 0.28%.
CMP: NSE, 8 September 2026.
Yield on Announcement Day
Total dividend ₹1.61 ÷ close ₹76.81 = 2.10%.
NHPC closed at ₹76.81 on 15 May 2026, down ~2% on the day (market data).
The face-value illusion: "16.10% dividend" sounds enormous, but the real cash return to a buyer at today's price is about 2.12% — roughly one-eighth of the headline number. For context, a bank fixed deposit currently offers well above this, though the dividend comes with equity upside and downside. NHPC's real yield sits broadly in line with hydro-PSU peer SJVN (~2.3%) but well below transmission utility Power Grid (~6–7%).
Dividend History Analysis
| Financial Year | Interim | Final | Total | YoY |
|---|---|---|---|---|
| FY21 | ₹1.25 | ₹0.35 | ₹1.60 | — |
| FY22 | ₹1.31 | ₹0.50 | ₹1.81 | +13.1% |
| FY23 | ₹1.40 | ₹0.45 | ₹1.85 | +2.2% |
| FY24 | ₹1.40 | ₹0.50 | ₹1.90 | +2.7% |
| FY25 | ₹1.40 | ₹0.51 | ₹1.91 | +0.5% |
| FY26 | ₹1.40 | ₹0.21 | ₹1.61 | -15.7% |
History compiled from dividend aggregator records (TipRanks, INDmoney) and exchange filings; NHPC pays twice a year (interim + final).
Classification: Consistent Payer that has just delivered its first dividend cut in years. NHPC had raised its total payout every year from FY21 to FY25, from ₹1.60 to ₹1.91. FY26 breaks that streak with a 15.7% reduction to ₹1.61. The interim (₹1.40) has been steady, so the volatility lives entirely in the final leg — which the board flexes each year based on cash and capex commitments. This is the behaviour of a company preserving cash for a heavy build-out phase, discussed next.
Financial Performance Analysis
All figures below are consolidated FY26 vs FY25 from the audited results. This is where the dividend cut starts to make sense.
| Metric (₹ cr) | FY26 | FY25 | Change |
|---|---|---|---|
| Revenue from operations | 11,615 | 10,380 | +11.9% |
| Depreciation | 1,976 | 1,193 | +65.6% |
| Other expenses | 4,060 | 2,122 | +91.3% |
| Finance costs | 1,423 | 1,189 | +19.7% |
| Pre-tax profit (before RDA & tax) | 2,910 | 4,490 | -35.2% |
| Reported PAT (to owners) | 3,766 | 3,007 | +25.2% |
The earnings-quality catch (this is the differentiator)
Revenue rose 11.9%, yet pre-tax profit before regulatory items and tax fell 35.2%. So how did reported PAT climb 25.2% to a record ₹3,766 cr? Two non-operating tailwinds:
- A net tax credit of ₹327 cr (including a ₹1,165 cr deferred-tax credit) after NHPC opted for the concessional tax regime from FY27, remeasuring deferred tax liabilities.
- A favourable ₹983 cr movement in Regulatory Deferral Account balances (net of tax) — a regulated-utility accounting item, not fresh cash.
Together these two items added roughly ₹1,310 cr of the reported bottom line. Strip them out and the underlying operating trend was one of margin compression: depreciation jumped 65.6% and other expenses 91.3% as newly commissioned projects (Parbati-II 800 MW, Subansiri Lower units, Karnisar solar) began charging depreciation and Associated Transmission System (ATS) charges of ₹822 cr hit the P&L. NHPC's own management reportedly asked analysts to adjust reported PAT downward by roughly ₹900 cr for the deferred-tax remeasurement (market coverage).
Cash Flow Analysis
Reported profit is an opinion; cash is a fact. On a consolidated basis for FY26:
| Operating cash flow (OCF) | ₹3,294 cr |
| Reported PAT (period) | ₹4,220 cr |
| Capex (PPE + CWIP) | (₹11,572 cr) |
| Free cash flow (OCF − capex) | (₹8,279 cr) |
| Long-term borrowings raised | ₹15,072 cr |
| Dividend paid (incl. minority) | ₹2,355 cr |
Two red flags worth naming clearly. First, OCF of ₹3,294 cr is well below reported PAT of ₹4,220 cr — a gap of about ₹927 cr — confirming that a large chunk of the "profit" is non-cash (deferred tax and RDA accruals). Second, because NHPC is in an aggressive construction phase, capex of ₹11,572 cr dwarfs operating cash, leaving free cash flow deeply negative at about −₹8,279 cr.
This tells you plainly how the dividend is funded: not from free cash flow. NHPC raised ₹15,072 cr of fresh long-term debt during the year. In practical terms, the ₹1,617 cr dividend is being sustained on the strength of the balance sheet and regulated cash inflows while the company borrows to build — a legitimate model for a regulated utility, but one that explains why the board trimmed the final dividend rather than raising it.
Balance Sheet Strength
Liquidity
Cash & equivalents ₹1,961 cr + other bank balances ₹1,690 cr + current investments ₹11 cr = ₹3,662 cr of liquid resources. That covers the total FY26 dividend of ₹1,617 cr about 2.26 times — comfortable near-term cover.
Leverage
Total consolidated borrowings ₹52,134 cr against total equity of ₹48,405 cr. The reported debt-to-equity ratio rose to 1.31 (from 1.05 a year earlier) as project debt scaled up. Interest service coverage remained healthy at about 4.7x.
The balance sheet is solid but tightening. Net worth attributable to owners stands at ₹41,437 cr and the asset base is heavily backed by operating hydro stations. However, debt is climbing to fund the capex programme, and external commentary flags a debt-to-EBITDA of roughly 5.6x — on the higher side for the sector. Adequate liquidity keeps the dividend affordable today; rising leverage is the reason it is not growing.
Dividend Sustainability Analysis
| Test | Reading | Verdict |
|---|---|---|
| Earnings coverage | EPS ₹3.75 ÷ DPS ₹1.61 = 2.33x (1.72x on ex-RDA EPS of ₹2.77) | Pass |
| OCF coverage | OCF ₹3,294 cr vs dividend ₹1,617 cr = 2.0x | Pass |
| FCF coverage | FCF −₹8,279 cr — dividend not covered | Fail |
| Liquidity coverage | Liquid assets ₹3,662 cr = 2.26x the payout | Pass |
Overall classification: Conditionally Sustainable. The dividend clears three of the four tests — it is covered by earnings, operating cash and liquidity. It fails the free-cash-flow test because NHPC is spending far more on new projects than it generates, and is funding the shortfall (and the dividend) with debt. The payout ratio of ~43% of consolidated PAT keeps NHPC above the DIPAM norm for PSUs (minimum 30% of net profit or 5% of net worth, whichever is higher). The board's own decision to cut the final dividend by 58.8% is the clearest signal that management is prioritising the balance sheet during the build phase. The dividend looks safe in the near term but has little room to grow until projects start generating cash.
Peer Comparison
| Company | Approx. Yield | P/E | Payout | Note |
|---|---|---|---|---|
| NHPC | 2.12% | ~20.8 | ~43% | Hydro PSU |
| SJVN | ~2.3% | ~40 | ~70% | Hydro PSU |
| NTPC | ~3% | — | — | Thermal + RE |
| Power Grid | ~6–7% | — | — | Transmission |
Peer yields, P/E and payout are indicative external market figures (aggregator data, 2026); blank cells left intentionally where a confirmed figure was not verified. ROE/ROCE columns omitted pending confirmed peer-level data.
Among power PSUs, NHPC's ~2.12% yield is middle-of-the-pack for hydro (comparable to SJVN) but far below transmission utility Power Grid, whose regulated, low-capex model throws off 6–7%. NHPC's return profile — ROE around 9% and ROCE around 6.6% (external estimates) — reflects the reality that a company still building giant hydro projects earns modest returns and pays a modest, capex-constrained dividend. Investors chasing yield alone tend to prefer Power Grid; NHPC is a capacity-growth story with a supporting dividend.
Promoter Impact Analysis
The Government of India is NHPC's promoter. Its holding fell from 67.40% (31 March 2026) to 61.39% (30 June 2026) after an Offer for Sale in June 2026. That shift matters for who collects the dividend across the year.
| Interim to Govt (@67.40%) | ~₹948 cr |
| Final to Govt (@61.39%) | ~₹130 cr |
| Total FY26 to Govt (est.) | ~₹1,077 cr |
Promoter vs minority shareholders: Of the total ₹1,617 cr payout, roughly two-thirds flows to the government exchequer, with the balance shared among FIIs (~12.3%), DIIs (~15.7%) and public shareholders (~10.6%) as per the June 2026 shareholding pattern. Because the dividend is a flat per-share amount, minority holders receive the identical ₹1.61 per share the government does. The June OFS also improved free float, modestly increasing the share of the dividend accruing to non-government investors versus a year earlier.
Taxation Analysis
Since April 2020, dividends in India are taxed in the hands of the shareholder at their applicable income-tax slab rate. The company no longer pays Dividend Distribution Tax. Key rules:
- Dividend income is added to "Income from Other Sources" and taxed at your slab rate.
- TDS at 10% applies if total dividend from a company exceeds ₹5,000 in a financial year (Section 194); no TDS below that.
- For those with no taxable income, Form 15G/15H can be filed to avoid TDS.
Worked example — 1,000 shares, 30% slab
| Gross dividend (1,000 × ₹1.61) | ₹1,610 |
| TDS @10% (only if > ₹5,000) | ₹0 (below threshold) |
| Tax @30% slab | ₹483 |
| Net dividend in hand | ₹1,127 |
| Post-tax yield on CMP ₹75.90 | ~1.48% |
So a top-slab investor keeps roughly ₹1,127 of every ₹1,610 gross — and the effective post-tax yield falls to about 1.48%. The lower your slab, the more you keep.
Key Risks
- Negative free cash flow and rising debt: FCF was about −₹8,279 cr in FY26 and debt-to-equity climbed to 1.31. Sustained heavy capex funded by borrowing limits room to raise the dividend.
- Earnings quality: A large slice of FY26's record PAT came from a ₹1,165 cr deferred-tax credit and ₹983 cr of regulatory-deferral movement — non-cash, non-recurring items that will not repeat every year.
- Project execution and tariff risk: Big projects such as Subansiri Lower and Parbati are recognising revenue provisionally pending final CERC tariff approval; adverse orders could pressure earnings.
- Regulatory/governance overhang: A parliamentary panel reportedly flagged governance matters amid NHPC's large investment plan; PSUs also face DIPAM dividend mandates that can override capital-allocation preferences.
- Yield and price risk: The stock trades near the lower half of its 52-week range (₹71.62–₹89.22); a modest ₹1.61 dividend offers limited downside cushion if the price falls further.
What To Monitor
- Free cash flow turning point: Watch for capex peaking and FCF moving toward positive as Subansiri (2,000 MW), Parbati and Dibang units commission — the trigger for any dividend growth.
- CERC tariff orders: Final tariff approvals for provisionally-billed projects will confirm how much of the recognised revenue is real and durable.
- Debt trajectory: Track debt-to-equity and debt-to-EBITDA; further increases would tighten dividend headroom.
- Operating margin recovery: Monitor whether newly capitalised projects lift generation revenue faster than their depreciation and finance costs.
- Dividend policy signals: The size of the next interim/final split will show whether the FY26 cut was a one-off or the start of a lower payout phase.
Conclusion
NHPC's FY26 dividend story is a case study in reading past the headline. The "16.10%" face-value figure is really a 2.12% cash yield, and the total payout has been cut 15.7% to ₹1.61 even as reported profit hit a record ₹3,766 cr. That record profit, however, leaned heavily on a deferred-tax credit and regulatory accounting rather than operating strength — underlying pre-tax profit actually fell 35.2%.
The dividend is comfortably covered by earnings, operating cash and a ₹3,662 cr liquidity cushion, but not by free cash flow, which is deeply negative because NHPC is in a ₹11,572-crore-a-year construction phase funded by debt. We classify the dividend as Conditionally Sustainable: safe in the near term, capped in the medium term until new hydro capacity starts throwing off cash. The positives are clear (regulated model, DIPAM backing, large capacity pipeline, strong liquidity); so are the negatives (negative FCF, rising leverage, low-quality earnings this year). We present both and leave the decision to you.
Frequently Asked Questions
What dividend has NHPC announced for FY2025-26?
What is the NHPC dividend yield?
What was the record date for the NHPC final dividend?
What was the ex-dividend date?
When will the NHPC dividend be paid?
Who was eligible for the dividend?
How is the NHPC dividend taxed?
Is the NHPC dividend sustainable?
Why did NHPC cut its dividend in FY26?
What is NHPC's dividend history?
How much dividend did the Government of India receive?
Was NHPC's record FY26 profit real?
What should investors monitor going forward?
Disclaimer
This article is for informational and educational purposes only and does not constitute investment, financial, legal or tax advice, nor any buy, sell or hold recommendation. ShareBazaar Online is not a SEBI-registered investment adviser. Dividend figures, dates and face-value percentages are taken from NHPC Limited's exchange filing dated 15 May 2026; market prices, dividend history, shareholding, ROE/ROCE and peer figures are drawn from public sources (NSE/BSE, aggregators and market coverage) and are subject to change. Yield figures depend on the live market price and will vary. Items not independently verified are flagged as such. Please verify all figures against official NHPC and exchange disclosures and consult a qualified, registered financial adviser before making any investment decision. Investments in securities are subject to market risks; read all related documents carefully.