
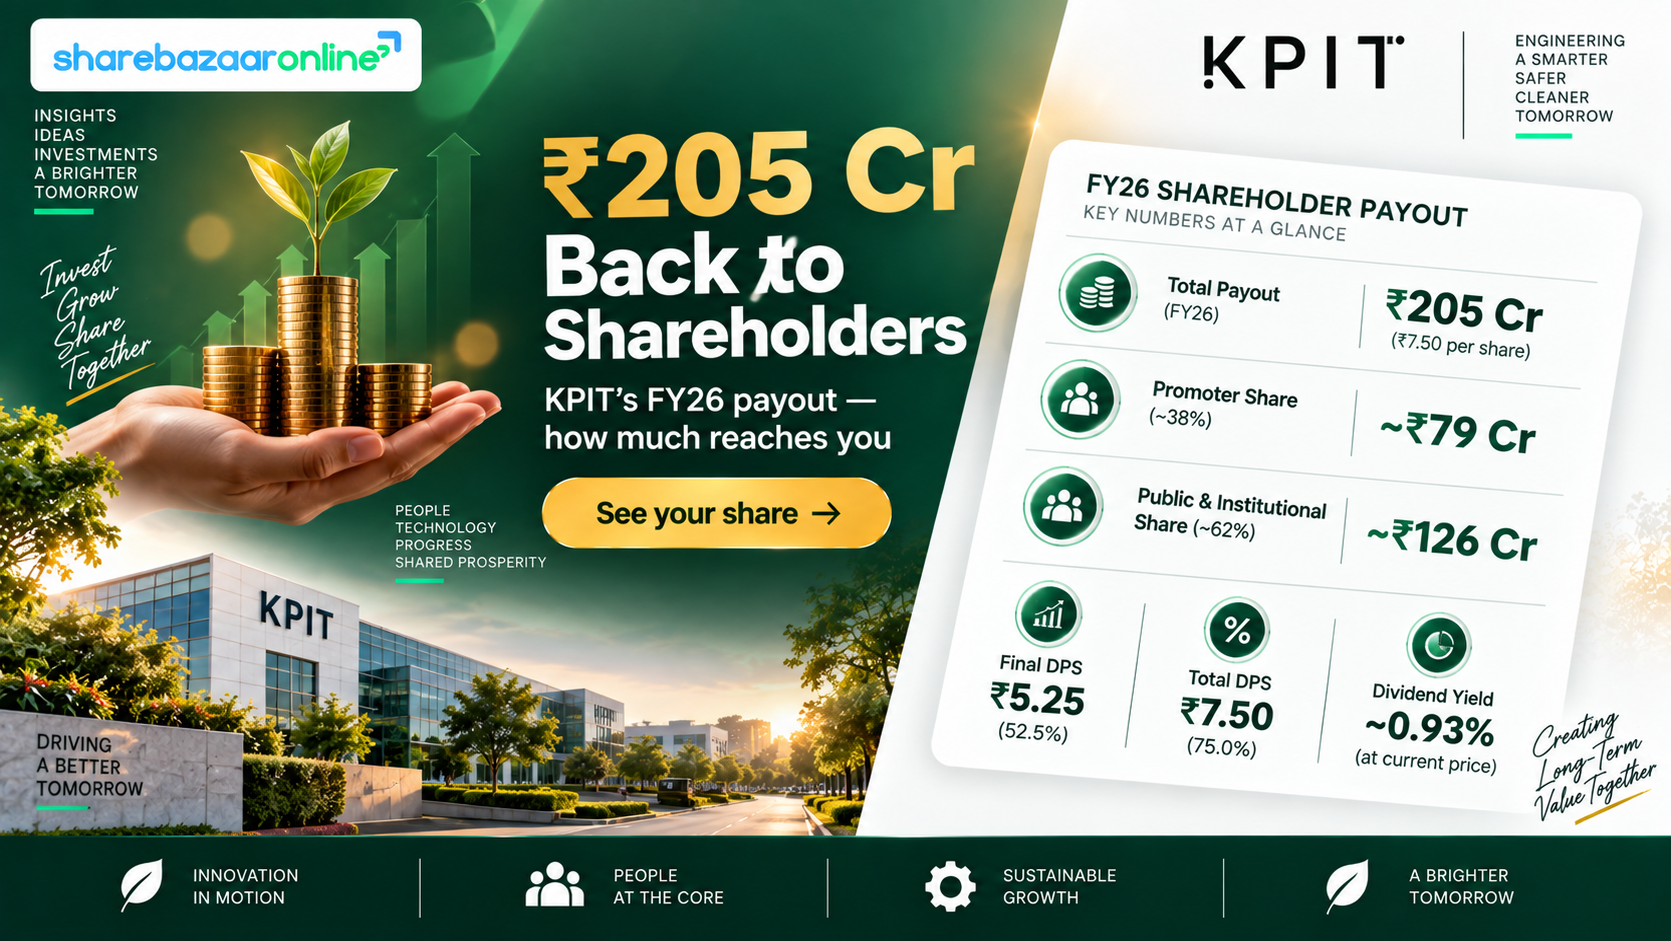
Dividend Snapshot
KPIT Technologies Limited (NSE: KPITTECH | BSE: 542651) has recommended a final dividend of ₹5.25 per equity share of face value ₹10 for FY2025–26. In percentage terms the company describes this as a 52.5% dividend — but that figure is calculated on the ₹10 face value, not on the market price. On the actual traded price the real cash return is far smaller, which is the single most important thing a retail investor should understand before reading the headline.
Final Dividend Per Share
₹5.25
Face value ₹10 (i.e. 52.5%)
Real Yield on Market Price
~0.93%
Final dividend ÷ CMP ₹562*
Dividend Type
Final
Subject to AGM approval (obtained 31 Aug 2026)
Record Date
12 Aug 2026
Announced 6 May 2026
The one-line takeaway: KPIT's final dividend looks generous as a percentage of face value, but adding the ₹2.25 interim already paid, the total FY26 payout of ₹7.50 is actually 11.8% lower than the ₹8.50 paid in FY25 — the first annual reduction after years of steady increases. This came in the same year that consolidated net profit fell 24%. The dividend remains comfortably affordable from cash flow; the story is about the direction of earnings, not the ability to pay.
*CMP ₹562 as per Screener close on 8 September 2026. All yield figures are price-dependent and must be re-verified against the live market price on the date of reading.
Dividend Announcement Summary
At its board meeting held on 6 May 2026 (09:15 a.m. to 12:35 p.m. IST), the Board of Directors of KPIT Technologies approved audited standalone and consolidated results for the quarter and year ended 31 March 2026 and recommended a final dividend of ₹5.25 per equity share of ₹10 each (52.5%) for FY2025–26. The recommendation was made subject to approval by members at the ensuing Annual General Meeting, and the company stated it would be paid within the statutory timelines under the Companies Act, 2013.
What was declared
A single final dividend of ₹5.25/share for FY26. Combined with the ₹2.25 interim dividend (record date 4 February 2026), the total FY26 dividend is ₹7.50 per share. The 9th AGM held on 31 August 2026 approved the final dividend along with director re-appointments and remuneration resolutions.
The context on the same day
The board simultaneously approved a strategic stake acquisition in Cymotive Technologies, an Israel-based automotive cybersecurity firm, starting at USD 10 million and potentially rising to USD 60–120 million for a 100% stake by mid-2029. The results showed strong revenue but a sharp profit decline, and the stock fell about 5% on the day.
A detail most wire reports skipped
Cymotive's disclosed turnover is falling — USD 42.4M (CY2023), USD 32.7M (CY2024), USD 19.2M (CY2025). KPIT is buying a shrinking-revenue asset for its strategic capability, not its current cash generation, and the deal will add near-term cost. This is relevant to dividend watchers because it is one more claim on future cash alongside the payout.
Key Dates Timeline
Announcement Date
6 May 2026
Board meeting outcome (Company disclosed)
Record Date
12 Aug 2026
Fixed via exchange corporate action
Ex-Date
12 Aug 2026 (inferred)
Aligned with record date under T+1 settlement
AGM Approval
31 Aug 2026
9th AGM (via video conferencing)
Payment Date
Not Disclosed by Company
Statutory outer limit: within 30 days of AGM declaration (on or before ~30 Sep 2026)
Financial Year
FY2025–26
Year ended 31 March 2026
Because the record date (12 August 2026) has already passed, eligibility is now settled: investors who held KPIT shares as of that date were entitled to the ₹5.25 final dividend, subject to the AGM approval that was obtained on 31 August 2026. The ex-date is shown as inferred because India moved to T+1 settlement, under which the ex-date and record date usually fall on the same trading day; investors should confirm against the official NSE/BSE corporate-action circular.
Dividend Yield Analysis
Dividend yield is simply the cash dividend divided by the price you pay for the share, expressed as a percentage. It is the number that actually matters to your wallet — not the “52.5%” figure quoted on face value.
The face-value illusion
A “52.5% dividend” sounds enormous. But it means ₹5.25 on a ₹10 face value. At the market price of about ₹562, that ₹5.25 is a final-dividend yield of only ~0.93%. Face value is an accounting label; it is not what you pay to own the share.
Real cash yields
Final dividend yield: ~0.93% (₹5.25 ÷ ₹562). Total FY26 yield including the interim: ~1.33% (₹7.50 ÷ ₹562). On the announcement-day close of ₹748.45 (6 May 2026), the same dividends yielded ~0.70% and ~1.00% respectively.
Yield reality check — why the yield “rose”
The trailing yield has drifted up since the announcement, but not because KPIT increased the payout. The dividend actually fell year-on-year. The yield rose because the share price dropped roughly 25% between the 6 May announcement (₹748) and early September (₹562), against a 52-week range of about ₹543 to ₹1,328. A higher yield driven by a falling price is a very different signal from a higher yield driven by a rising dividend — here it reflects weak share-price performance and an earnings decline, not enhanced generosity.
Dividend History Analysis
KPIT typically pays twice a year — an interim (around February) and a final (post year-end, approved at the AGM). The table below reconstructs the per-share history. Note the break in the trend in FY26.
| Financial Year | Interim | Final | Total DPS | Payout % |
|---|---|---|---|---|
| FY2021–22 | ₹1.25 | ₹1.85 | ₹3.10 | 31% |
| FY2022–23 | ₹1.45 | ₹2.65 | ₹4.10 | 29% |
| FY2023–24 | ₹2.10 | ₹4.60 | ₹6.70 | 31% |
| FY2024–25 | ₹2.50 | ₹6.00 | ₹8.50 | 28% |
| FY2025–26 | ₹2.25 | ₹5.25 | ₹7.50 | 32% |
Per-share and payout data compiled from exchange corporate-action records and Screener (consolidated). Earlier years (FY20 ₹0.45; FY21 ₹1.50) had a different structure and are noted for context only.
The trend that broke
From FY22 to FY25 the total dividend rose every single year (₹3.10 → ₹4.10 → ₹6.70 → ₹8.50). FY26 is the first reduction: total DPS fell to ₹7.50, down 11.8%, and the final component fell from ₹6.00 to ₹5.25, down 12.5%.
Classification: Consistent Payer, first cut
KPIT has paid every year for over a decade with a stable ~28–32% payout ratio, so it remains a Consistent Payer. But the FY26 dip breaks a multi-year growth streak and tracks the fall in earnings — the payout ratio held steady while the profit it is calculated on shrank.
Financial Performance Analysis
This is where KPIT's FY26 story gets interesting — and where it diverges from the “record revenue” headlines. On a consolidated basis, revenue grew but profit fell sharply. Understanding why matters more than the dividend itself.
| Metric (Consolidated, ₹ Cr) | FY25 | FY26 | Change |
|---|---|---|---|
| Revenue | 5,842 | 6,455 | +10.5% |
| Operating Profit | 1,230 | 1,220 | −0.8% |
| Operating Margin (OPM) | 21% | 19% | −2 pts |
| Other Income | 170 | 26 | −84.7% |
| Interest Cost | 42 | 74 | +76.2% |
| Depreciation | 225 | 301 | +33.8% |
| Profit Before Tax | 1,133 | 872 | −23.0% |
| Net Profit (PAT) | 840 | 637 | −24.1% |
| EPS (₹) | 30.63 | 23.25 | −24.1% |
Source: Screener (consolidated), Q4/FY26 results announced 6 May 2026.
Operating leverage went the wrong way
Operating leverage means profits should grow faster than revenue as fixed costs get spread over a larger base. KPIT delivered the opposite in FY26. Revenue rose 10.5% but operating profit was essentially flat (−0.8%), so the operating margin compressed from 21% to 19%. In Q4 FY26 the effect was starker: revenue grew ~12% while total expenses rose ~17%, and quarterly net margin collapsed to about 9.5% from 16% a year earlier. Employee costs were the main culprit — a classic services-business margin squeeze.
Three forces below the operating line amplified the fall
The 24% profit drop was not only about margins. A large part is a base effect and non-operating swing: (1) other income collapsed from ₹170 Cr to ₹26 Cr (−85%), which had flattered FY25; (2) interest cost jumped 76% as borrowings rose; and (3) depreciation rose 34% on a much larger asset base. Stripping out the other-income swing, the underlying operating deterioration is real but less dramatic than the headline −24% suggests. Both facts are true at once: earnings quality weakened, and FY25 was an unusually high base.
Cash Flow Analysis
Reported profit is an accounting opinion; cash is fact. For a dividend, the question is whether the business actually generates the cash to pay it. Here KPIT looks much healthier than its profit line implies.
Operating Cash Flow (FY26)
₹1,195 Cr
vs PAT of ₹637 Cr — cash conversion ~115%
Free Cash Flow (FY26)
₹1,056 Cr
Covers total dividend outflow ~5.1x
Cash conversion is a genuine strength
KPIT converted more than 100% of its operating profit into operating cash flow (OCF/OP ~115%), and its OCF of ₹1,195 Cr exceeded its reported PAT of ₹637 Cr by nearly 2x. This is the reassuring part of the story: even with profits down, the company collected cash well. Debtor days were 61 (up modestly from 56), and working-capital days remained negative, meaning KPIT is partly funded by its own operating cycle rather than tying up cash. The dividend is being paid from real cash generation, not accounting profit.
Where the cash went: investing outflow surged
The catch is on the investing line. Cash used in investing activities jumped to −₹1,188 Cr in FY26 (from −₹567 Cr), reflecting acquisitions and a much larger fixed-asset base. Financing cash flow turned positive (+₹89 Cr) because increased borrowing offset dividend payouts. In plain terms: strong operating cash was largely redeployed into growth/M&A and part-funded by new debt, while the dividend continued to be paid. The dividend is funded from current cash earnings, not from asset sales — but the company is simultaneously leaning more on borrowings to fund expansion.
Balance Sheet Strength
Net Worth (FY26)
~₹3,541 Cr
Equity ₹272 Cr + Reserves ₹3,269 Cr; Book value ~₹129
Borrowings (FY26)
₹838 Cr
Up 143% from ₹345 Cr in FY25
Cash & Investments
~₹1,140 Cr*
Exceeds borrowings — net cash positive
Return Ratios (FY26)
ROE 20.9% · ROCE 26.3%
Down from ROCE ~40% in FY25
Still net cash, but the cushion is thinner
KPIT remains net-cash — cash and short-term investments of roughly ₹1,140 Cr comfortably exceed borrowings of ₹838 Cr, and net-debt-to-EBITDA is negative. Interest cover remains high. However, borrowings more than doubled in FY26 and the fixed-asset base roughly doubled (to ~₹3,985 Cr), consistent with acquisition activity. Return on capital employed (ROCE) fell from ~40% to ~26% — a large drop that signals the freshly deployed capital is not yet earning at the prior rate. The balance sheet still easily supports the dividend; the trend to watch is rising leverage against falling incremental returns.
*Cash & investments figure is aggregator-reported (Simply Wall St) as the condensed public balance sheet does not separately split cash from other current assets; treat as approximate pending the FY26 annual report.
Dividend Sustainability Analysis
We run four independent coverage tests. A dividend can be “covered” on one measure and stretched on another, so all four together give the real picture.
1. Earnings coverage
EPS ₹23.25 against total DPS ₹7.50 = 3.1x cover (payout ~32%). Comfortable, and consistent with the company's decade-long ~30% payout discipline.
2. Operating cash flow coverage
OCF ₹1,195 Cr against total dividend outflow of ~₹206 Cr = ~5.8x cover. Very strong — the payout is a small fraction of cash generated.
3. Free cash flow coverage
FCF ₹1,056 Cr against ~₹206 Cr outflow = ~5.1x cover. Even after capex, free cash easily funds the dividend several times over.
4. Liquidity / cash coverage
Cash & investments ~₹1,140 Cr against ~₹206 Cr outflow = ~5.5x cover. The company could fund several years of dividends from the balance sheet alone.
Verdict: Sustainable — on affordability. Watch the earnings trend.
On all four tests the dividend is clearly Sustainable in terms of the company's ability to pay: earnings cover it 3x, cash flows cover it more than 5x, and the balance sheet is net-cash. The qualifier is directional, not affordability-based — the payout was reduced in FY26 alongside a 24% profit fall, and rising borrowings plus a sharp ROCE decline are early caution signs. If earnings keep sliding into FY27, future dividend growth (not the dividend itself) is what would be at risk.
Peer Comparison
KPIT competes with India's engineering R&D (ER&D) and automotive-software specialists. Against them, KPIT is a low-payout, low-yield name — it retains more of its earnings for growth.
| Company | FY26 Total DPS | Div Yield* | Payout | ROE | ROCE |
|---|---|---|---|---|---|
| KPIT Technologies | ₹7.50 | ~1.33% | ~32% | 20.9% | 26.3% |
| Tata Elxsi | ₹75.00 | ~1.8% | ~63% | ~28.6% | — |
| L&T Technology Services | ₹58.00 | ~1.6% | ~48% | ~19.5% | — |
| Tata Technologies | ₹8.35 (final) | ~1.5% | ~50% | — | — |
| Cyient | ₹16.00 | ~1.45% | — | — | — |
*Yields are point-in-time snapshots from public aggregators and move with price. Blank cells (—) are left intentionally rather than filled with unverified figures. Tata Elxsi ROE shown is a 3-year average. Peer dividends: Tata Elxsi ₹75 final; LTTS ~₹58 (₹18 interim + ₹40 final); Cyient ~₹16; Tata Technologies ₹8.35 final.
The read-across is clear: KPIT pays out the least of the group (~32%) and offers among the lowest yields. This is by design — KPIT positions itself as a growth-stage compounder that reinvests rather than a dividend name. Investors chasing yield would find Tata Elxsi or LTTS more relevant; KPIT's appeal has been capital appreciation, which is precisely what has disappointed over the past year.
Promoter Impact Analysis
Promoter Holding (Jun 2026)
38.59%
Down from 39.41% in Mar 2026
Promoter Share of Total FY26 Dividend
~₹79 Cr
38.59% of ~₹206 Cr total outflow
Who benefits and by how much
Of the ~₹206 Cr total FY26 dividend, promoters receive roughly ₹79 Cr (of which about ₹55 Cr relates to the ₹5.25 final dividend). The remaining ~61% flows to public and institutional shareholders. Because the payout is proportional to holding, minority shareholders are treated identically per share — there is no structural tilt toward promoters here. This is a straightforward, pass-through distribution, not a mechanism that disproportionately rewards insiders.
The more telling ownership signal
The dividend split is neutral, but the shareholding trend is not. Foreign institutional investors (FIIs) have cut their stake from about 26% in 2023 to ~13% by mid-2026 — sustained selling. Domestic institutions (DIIs) picked up much of the slack, rising to ~24%, and promoter holding itself dipped to 38.59% in the June 2026 quarter (a ~0.82% quarterly fall). Heavy FII exit alongside a small promoter reduction, during a period of falling profits, is worth noting.
Taxation Analysis
How dividends are taxed in India
Since April 2020, dividends are taxed in the hands of the investor at their applicable income-tax slab rate — there is no separate Dividend Distribution Tax. The dividend is added to “Income from Other Sources” and taxed accordingly. Companies deduct TDS at 10% under Section 194 if the total dividend paid to a resident individual exceeds ₹10,000 in a financial year (20% if PAN is not furnished). For non-resident investors, TDS is generally higher (around 20% plus surcharge/cess under Section 195, subject to treaty relief).
Worked example — 1,000 KPIT shares, 30% slab
| Shares held | 1,000 |
| Final dividend per share | ₹5.25 |
| Gross dividend | ₹5,250 |
| TDS under Sec 194 | ₹0 (below ₹10,000 threshold) |
| Tax at 30% slab (+ applicable cess) | ₹1,575 |
| Net dividend in hand | ₹3,675 |
| Effective post-tax yield (at ₹562) | ~0.65% |
Even including the ₹2.25 interim, a 1,000-share holder's total FY26 dividend of ₹7,500 stays below the ₹10,000 TDS threshold, so no tax is deducted at source — but the investor must still self-declare and pay tax at their slab. For a 30%-slab investor the ~0.93% pre-tax final-dividend yield shrinks to roughly 0.65% after tax. Cess and any surcharge are additional. This is illustrative, not tax advice.
Key Risks
1. Margin compression. Operating margin fell from 21% to 19% and quarterly net margin dropped to ~9.5% as employee and other costs outran revenue. If wage inflation and pricing pressure persist, profit can keep lagging revenue.
2. Earnings decline and FY27 downgrades. PAT fell 24% in FY26 and Q1 FY27 profit fell further (~₹116–117 Cr). Reports point to leadership changes, project ramp-downs and revenue-guidance cuts — a weak near-term earnings trajectory.
3. Client and end-market concentration. KPIT is heavily tied to the global automotive/mobility cycle. A slowdown in OEM software spending or the wind-down of large programs directly hits growth and margins.
4. Rising leverage and falling returns. Borrowings more than doubled to ₹838 Cr and ROCE fell from ~40% to ~26%, signalling newly deployed capital is earning less. Continued debt-funded expansion could pressure returns.
5. Acquisition execution risk. The Cymotive deal targets a company with declining revenue (USD 42.4M → 19.2M over three years) and could scale to USD 120M by 2029, adding cost before it adds profit. Integration and value realisation are unproven.
6. Institutional exit. FIIs cut their stake from ~26% to ~13% over roughly two years, and mutual-fund holdings also fell — persistent institutional selling can weigh on the share price.
What To Monitor
1. Margin recovery. Watch quarterly EBITDA/operating margin — a return toward the 20%+ band would signal the FY26 squeeze was temporary rather than structural.
2. Revenue growth and deal wins. Track constant-currency growth and total contract value (TCV) of new engagements each quarter, plus management's FY27 guidance revisions.
3. Cash conversion. KPIT's ~115% OCF/operating-profit conversion is a core strength; any slippage in OCF or a jump in debtor days would be an early warning for future payouts.
4. Debt and ROCE trajectory. Monitor whether borrowings keep rising and whether ROCE stabilises or keeps falling as acquired assets are integrated.
5. Cymotive integration. Follow the conversion of the USD 10M preference investment into equity and Cymotive's revenue/EBIT milestones — the tranche structure is milestone-linked.
6. Institutional flows. Whether FII selling stabilises and DII buying continues is a useful sentiment gauge for the stock.
Conclusion
KPIT Technologies' ₹5.25 final dividend for FY2025–26 is a study in why the headline number and the real number diverge. The “52.5% dividend” translates to a real yield of only about 0.93% on the market price, and roughly 1.33% including the interim. More importantly, the total FY26 payout of ₹7.50 is down 11.8% from FY25 — the first cut after years of growth — and it landed in a year when consolidated profit fell 24% on flat operating profit, an 85% collapse in other income, and higher interest and depreciation.
The positives
Strong cash conversion (OCF ₹1,195 Cr, ~115% of operating profit), free cash flow of ₹1,056 Cr covering the dividend ~5x, a net-cash balance sheet, and a disciplined ~30% payout history. The dividend itself is comfortably affordable.
The negatives
Falling profit and margins, a first dividend cut, doubled borrowings, ROCE down from ~40% to ~26%, sustained FII selling, a ~53% one-year share-price fall, and an acquisition of a shrinking-revenue target. Growth — not the dividend — is the concern.
For income-focused investors, KPIT was never a yield play, and FY26 confirms that: sub-1% real yield with a payout that just declined. For growth investors, the question is whether FY26's margin squeeze is a blip or the start of a longer reset. We present the facts; the decision is yours.
Frequently Asked Questions
What dividend has KPIT Technologies announced for FY2025–26?
What is the actual dividend yield of KPIT Technologies?
What was the record date for the KPIT final dividend?
What is the ex-date for this dividend?
When will the KPIT dividend be paid?
Who was eligible to receive this dividend?
How is the KPIT dividend taxed?
Is KPIT's dividend sustainable?
What is KPIT Technologies' dividend history?
Why did KPIT's profit fall despite record revenue?
How does KPIT's dividend compare with peers?
How much of the dividend goes to promoters?
What should investors monitor going forward?
Disclaimer
This article is published by ShareBazaar Online for informational and educational purposes only. It is not investment advice and does not constitute a buy, sell or hold recommendation. ShareBazaar Online is not a SEBI-registered investment adviser or research analyst. Dividend figures, dates and financial data are compiled from the company's exchange filings and reputable public sources (Screener, exchange corporate actions and dividend aggregators) and may contain errors or become outdated; several figures are marked as inferred, aggregator-sourced or “Not Disclosed by Company” where the company has not confirmed them. All dividend-yield figures depend on the market price and must be re-verified against the live price and official NSE/BSE circulars on the date of reading. Investing in equities carries risk, including loss of capital. Readers should conduct their own due diligence and consult a SEBI-registered financial adviser and a qualified tax professional before making any decision. Past performance is not indicative of future results.