
Dividend Snapshot
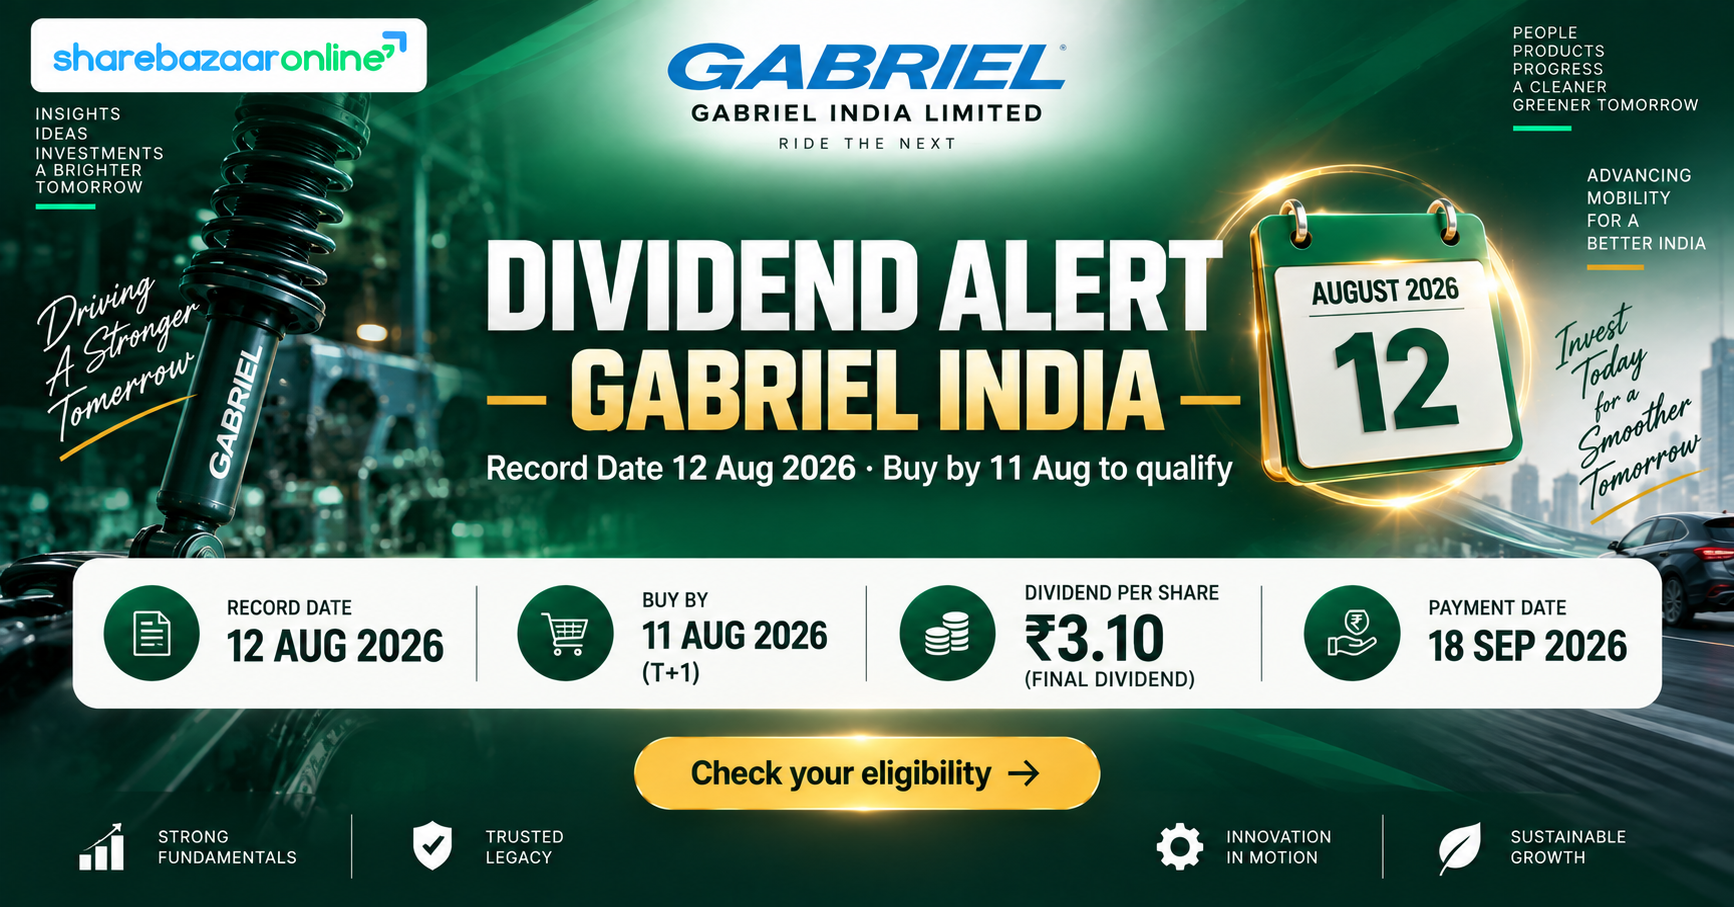
Gabriel India Limited (NSE: GABRIEL | BSE: 505714 | ISIN: INE524A01029), the flagship ride-control company of the ANAND Group, has a Final Dividend of ₹3.10 per equity share for FY2025-26 going to record on 12 August 2026. On a face value of ₹1, that works out to a headline 310% dividend. Including the ₹1.90 interim already paid in December 2025, the full-year FY26 payout is ₹5.00 per share.
Final Dividend / Share
₹3.10
310% on face value of ₹1
Dividend Type
Final Dividend
Subject to AGM approval
Trailing Dividend Yield
~0.36%
Full-year ₹5.00 ÷ CMP ~₹1,390
Record Date
12 Aug 2026
Ex-date same day (T+1)
Payment Date
On/before 18 Sep 2026
Via KFin Technologies
Financial Year
FY2025-26
64th AGM: 19 Aug 2026
Dividend Announcement Summary
The Board of Directors of Gabriel India Limited, at its meeting held on 27 May 2026, recommended a final dividend of ₹3.10 per equity share (face value ₹1) for the year ended 31 March 2026. The dividend is subject to shareholder approval at the 64th Annual General Meeting scheduled for 19 August 2026 at 2:30 PM IST through Video Conferencing / OAVM. The exchange intimation dated 28 July 2026 confirmed the record date and book-closure schedule.
What was declared
A single final dividend of ₹3.10 for FY26. An interim dividend of ₹1.90 was already declared earlier (ex-date 21 November 2025, paid December 2025), so the total FY26 dividend is ₹5.00 per share, up from ₹4.70 in FY25.
Board & approval
Recommendation approved by the Board on 27 May 2026. Final dividend requires AGM approval (19 August 2026). The Register of Members and Share Transfer Books remain closed from 13 to 19 August 2026 (both inclusive). Registrar: KFin Technologies Limited.
The bigger picture
This dividend lands in the middle of the biggest transformation in Gabriel's 60-year history. In FY26 the company completed a Composite Scheme of Arrangement (NCLT Mumbai sanctioned 12 May 2026, effective 22 May 2026) that demerged the automotive undertaking of Asia Investments Pvt Ltd into Gabriel, and it has since announced large acquisitions (HL Klemove India, proposed HL Mando ANAND India) plus a ₹1,000 crore NCD programme. In short, this is a growth-hungry company paying a modest dividend, not a mature cash cow returning surplus capital.
Key Dates Timeline
Board Recommendation (Announcement)
27 May 2026
Book Closure
13 Aug – 19 Aug 2026
Record Date
12 Aug 2026 (Wed)
Ex-Dividend Date
12 Aug 2026
Same as record date under T+1 settlement
64th AGM
19 Aug 2026, 2:30 PM IST
Via VC / OAVM
Payment Date
On or before 18 Sep 2026
To be eligible for the ₹3.10 final dividend, an investor must appear in the Register of Members as of end of business on the record date, 12 August 2026. Because Indian equities settle on a T+1 basis, the ex-date effectively coincides with the record date — shares had to be bought on or before 11 August 2026 to qualify.
Dividend Yield Analysis
Yield on Final ₹3.10 (at CMP ~₹1,390)
~0.22%
Trailing Yield on Full-Year ₹5.00
~0.36%
Yield at Announcement (~₹885, 27 May 2026)
~0.35%
On the ₹3.10 final
Auto Components Sector Avg Yield
~0.6%
Yield Reality Check
Gabriel's dividend yield looks tiny — but the reason is a share price that has roughly 1.5x-ed in a year, not a weak dividend. The stock has ranged between a 52-week low of ₹795.70 and a high of ₹1,600, and the final dividend was recommended when the price was around ₹885. As the market re-rated the stock on the back of the restructuring and acquisitions, the same ₹5.00 payout now buys a much smaller yield. This is a classic case where yield fell because price rose — the opposite of a distressed high-yield situation. Gabriel is a capital-appreciation stock with a token dividend, not an income stock.
Dividend History Analysis
Per-Share Dividend (Interim + Final, by financial year)
| Financial Year | Total Dividend / Share | Payout Ratio |
|---|---|---|
| FY21 | ₹0.90 | ~21% |
| FY22 | ₹1.55 | ~24% |
| FY23 | ₹2.55 | ~28% |
| FY24 | ₹4.00 | 32% |
| FY25 | ₹4.70 | 28% |
| FY26 | ₹5.00 (₹1.90 + ₹3.10) | 28% |
Source: exchange dividend records / Screener. Payout ratios are approximate and computed on a per-share basis (DPS ÷ EPS).
Consistency & growth
The per-share dividend has grown from about ₹0.80 in FY14 to ₹5.00 in FY26 — a compounding rate in the mid-teens. Gabriel has typically paid twice a year (a November interim and an August/September final), and the trend is clearly upward.
Classification
Consistent, growing payer — with one historical cut. Third-party dividend trackers flag at least one reduction in the past decade (around the FY20-21 COVID period). The multi-year direction is positive, but the record is not perfectly unbroken, so it is not a "never-miss" dividend aristocrat.
Financial Performance Analysis
Consolidated Profit & Loss (₹ Crore)
| Metric | FY24 | FY25 | FY26 |
|---|---|---|---|
| Revenue | 3,403 | 4,063 | 4,667 |
| Operating Profit | 293 | 390 | 438 |
| OPM % | 9% | 10% | 9% |
| Net Profit (PAT) | 179 | 245 | 252 |
| EPS (₹) | 12.44 | 17.05 | 17.56 |
Source: Screener (consolidated). Standalone FY26: Revenue ₹4,233 Cr, PAT ₹243 Cr.
Operating Leverage Check
FY26 revenue rose ~15% and operating profit ~12%, but reported PAT grew only ~3% (₹252 Cr vs ₹245 Cr). The gap came from a fall in other income (₹26 Cr → ₹13 Cr), higher interest (₹10 Cr → ₹14 Cr) and higher depreciation (₹81 Cr → ₹100 Cr) as the expanded asset base kicked in. Operating margins stayed thin at ~9% — the trade-off of a volume-heavy, OEM-driven auto-ancillary model.
Watch the "other income"
In the most recent quarters, other income spiked sharply (₹53 Cr in Q4FY26, ₹47 Cr in Q1FY27) alongside the restructuring. A meaningful slice of headline profit is therefore non-operating. The post-merger TTM run-rate (Revenue ₹5,165 Cr, PAT ₹351 Cr) looks stronger, but investors should separate core operating earnings from one-off gains when judging dividend capacity.
Cash Flow Analysis
Consolidated Cash Flows (₹ Crore)
| Metric | FY24 | FY25 | FY26 |
|---|---|---|---|
| Cash from Operations (CFO) | 177 | 204 | 345 |
| Free Cash Flow (FCF) | 16 | ~0 | 108 |
| CFO / Operating Profit | 84% | 73% | 97% |
Source: Screener (consolidated).
Cash is confirming profit — now
FY26 CFO of ₹345 Cr comfortably exceeds PAT of ₹252 Cr (cash conversion ~137%), and FCF recovered to ₹108 Cr. That is a marked improvement over FY25, when FCF was near zero because heavy capex and working capital soaked up operating cash. Earnings quality in FY26 is high.
How is the dividend funded?
In FY26 the payout is funded by current cash generation: FCF of ₹108 Cr covers the estimated final-dividend outflow of ~₹55 Cr about 2x, and the full-year outflow of ~₹88 Cr about 1.2x. In FY25, with FCF near zero, that year's dividend effectively leaned on reserves. Cash-flow coverage is therefore adequate but not consistently thick during the current investment phase.
Balance Sheet Strength
Net Worth (FY26)
~₹1,368 Cr
Reserves ~₹1,354 Cr
Borrowings (FY26)
~₹148 Cr
Up from ~₹69 Cr in FY25
ROE / ROCE
~20% / ~26%
Book Value / Share
~₹95
Historically light debt — but that is changing
Gabriel has run a near debt-free balance sheet with strong return ratios (ROCE ~26%, ROE ~20%). However, borrowings doubled to ~₹148 Cr in FY26, and the Board has approved up to ₹1,000 crore of NCDs (August 2026, rated CRISIL AA+/Stable) to fund acquisitions. Management guidance points to debt-to-equity rising toward ~1:1 after the pending transactions. The balance sheet is still healthy today, but it is being deliberately levered up for growth.
Dividend Sustainability Analysis
Earnings Coverage
3.5x
EPS ₹17.56 ÷ full-year DPS ₹5.00
Payout Ratio
~28%
Comfortable / conservative
FCF Coverage (full-year)
~1.2x
Reserves Buffer
~₹1,354 Cr
Verdict: Sustainable
With a low ~28% payout, 3.5x earnings coverage, FY26 FCF that covers the payout, and a large reserves cushion, the current dividend is Sustainable. The nuance: Gabriel is prioritising growth investment over distribution. As long as earnings keep growing, the dividend can rise; but if the ₹1,000 Cr debt-funded acquisition programme pressures cash flows or interest costs, the company is far more likely to hold the payout ratio flat than to raise it aggressively. Do not expect a step-change in yield from here.
Peer Comparison
| Company | Div Yield | Payout | ROE | ROCE |
|---|---|---|---|---|
| Gabriel India | ~0.36% | ~28% | ~20% | ~26% |
| Endurance Technologies | ~0.4% | ~18% | ~15.5% | ~18% |
| Munjal Showa | ~3.7% | high | low | low |
| Auto Components sector avg | ~0.6% | — | — | — |
Indicative figures from Equitymaster / Screener / Simply Wall St; verify before use.
Among quality auto-ancillary peers, low yields are the norm because these companies reinvest for growth. Gabriel screens with the best return ratios in the group (ROCE ~26%, ROE ~20%) while yielding about the same as Endurance. The outlier is direct shock-absorber rival Munjal Showa, whose ~3.7% yield is a value-trap signal — it reflects a depressed share price and a mature/declining business, not superior generosity. High yield here means weakness, not strength.
Promoter Impact Analysis
Promoter Holding (Jun 2026)
63.55%
Up from 55.02% (Mar 2026) after the scheme
Est. Promoter Dividend Income (FY26 full-year)
~₹56 Cr
~₹35 Cr from the final alone
Who benefits
The ANAND Group promoters hold 63.55%, so roughly ₹56 Cr of the ~₹88 Cr full-year dividend (and ~₹35 Cr of the ~₹55 Cr final) flows to the promoter group; the remaining ~36% goes to public, FII (6.35%) and DII (12.92%) shareholders across ~1.35 lakh investors. Promoter holding jumped ~8.5 percentage points during the quarter because new shares were issued to promoter entities in the composite scheme — which correspondingly diluted the public and DII share of the register. The dividend is uniform per share (no preferential treatment), but the promoter's enlarged stake means a larger absolute slice of the payout now accrues to the family.
Taxation Analysis
How dividends are taxed in India
Since the abolition of Dividend Distribution Tax (FY2020-21 onwards), dividends are fully taxable in the hands of the shareholder at their applicable income-tax slab rate. The company deducts TDS at 10% under Section 194 if total dividend paid to a resident shareholder exceeds ₹5,000 in a financial year (20% if PAN is not furnished). For NRIs, TDS is generally 20% plus surcharge and cess, subject to DTAA relief.
Worked Example A (generic, ₹10/share)
Investor holds 1,000 shares, dividend ₹10/share, tax slab 30%:
- Gross dividend = ₹10,000
- TDS @10% (above ₹5,000) = ₹1,000 (adjustable)
- Total tax @30% slab = ₹3,000
- Net in hand = ₹7,000
Worked Example B (Gabriel final, ₹3.10)
Investor holds 1,000 shares, final dividend ₹3.10/share, slab 30%:
- Gross dividend = ₹3,100
- TDS = Nil (below the ₹5,000 threshold)
- Tax @30% slab = ₹930
- Net in hand = ₹2,170
- Post-tax effective yield (at CMP ~₹1,390) ≈ 0.16%
Key Risks
1. Integration & execution risk
The composite scheme plus HL Klemove / HL Mando ANAND acquisitions are large and simultaneous. Merging cultures, systems and margins is hard; missteps could hit profitability and, by extension, dividend growth.
2. Rising leverage
Up to ₹1,000 Cr NCDs and debt-to-equity heading toward ~1:1 add interest cost and reduce the free cash available for distribution.
3. Thin operating margins
OPM sits near 9%. As an OEM-dependent supplier, Gabriel has limited pricing power; raw-material (steel) inflation or pricing pressure squeezes an already narrow margin.
4. Auto-cycle & EV transition
Volumes track 2W, PV, CV and railway demand. A demand downturn, or a slower-than-planned pivot to EV-relevant products, would pressure earnings.
5. Rich valuation
A P/E in the 60-90x range and P/B ~14x price in flawless execution. Any earnings disappointment can de-rate the stock sharply — the price risk far outweighs the ~0.4% dividend.
6. Earnings quality
A chunk of recent profit is non-operating "other income" linked to restructuring. Underlying core earnings should be watched to confirm dividend capacity.
What To Monitor
1. Net debt trajectory
Track how much of the ₹1,000 Cr NCD facility is drawn and the resulting debt-to-equity and interest coverage each quarter.
2. Free cash flow
Watch whether FCF stays positive and covers the dividend as capex and acquisition spending ramp up.
3. Operating margin
Look for OPM moving above the ~9-10% band as the newly merged, higher-value businesses (sunroofs, ADAS/braking) scale.
4. Payout-ratio policy
Monitor whether management holds the ~28% payout or lifts it once the investment phase settles — the key driver of future yield.
5. Acquisition returns
Track revenue and margin contribution from HL Klemove / HL Mando ANAND to confirm the acquisitions are earnings-accretive.
6. Order wins & EV mix
Follow new OEM order wins and the share of EV-agnostic / EV-relevant products in the order book.
Conclusion
Gabriel India's ₹3.10 final dividend (FY26 total ₹5.00) is a well-covered, steadily growing payout — but it is a token cash return, not the reason to own the stock. At a ~0.36% trailing yield, the dividend is dwarfed by the share-price move, and the company is clearly channelling capital into a once-in-a-generation transformation from a pure ride-control maker into a diversified auto-components major.
Positives
- Low ~28% payout, 3.5x earnings coverage
- Strong FY26 cash conversion (CFO > PAT)
- Best-in-class return ratios (ROCE ~26%)
- Consistent multi-year dividend growth
Negatives / Cautions
- Very low yield; not an income stock
- Rising debt to fund acquisitions
- Thin ~9% margins; earnings partly non-operating
- Rich valuation amplifies price risk
Frequently Asked Questions
What dividend has Gabriel India announced for FY2025-26?
What is the Gabriel India dividend yield?
What is the Gabriel India dividend record date?
What is the ex-dividend date?
When will the Gabriel India dividend be paid?
Who is eligible for the dividend?
How is the Gabriel India dividend taxed?
Is the Gabriel India dividend sustainable?
What is Gabriel India's dividend history?
What should investors monitor going forward?
Why is Gabriel India's dividend yield so low compared to Munjal Showa?
How much of the dividend goes to promoters?
What is the NSE symbol, BSE code and ISIN of Gabriel India?
Disclaimer
This article is for informational and educational purposes only and does not constitute investment advice or any buy, sell or hold recommendation. Figures relating to the dividend, record date and AGM are based on Gabriel India Limited's exchange filings; financial, price, shareholding and peer data are sourced from public providers (including Screener, exchange records and third-party data sites) and may contain estimates or subsequent revisions. Share-count and dividend-outflow figures are approximate given the FY26 composite scheme. Securities markets are subject to risk; dividends are not guaranteed and are subject to shareholder approval. Please verify all data independently and consult a SEBI-registered investment adviser before making any decision. ShareBazaar Online and its authors are not liable for any loss arising from the use of this content.