
Dividend Snapshot
Company
The Sandur Manganese & Iron Ores Limited (SMIORE)
NSE: SANDUMA | BSE: 504918 | ISIN: INE149K01016
Sector: Metals & Mining (Iron & Steel) · Face Value: ₹10
Dividend Announced
Final Dividend of ₹0.50 per equity share (5% of face value) for FY 2025–26
Announced at the 384th Board meeting on 7 May 2026; approved by shareholders at the 72nd AGM.
Key Numbers
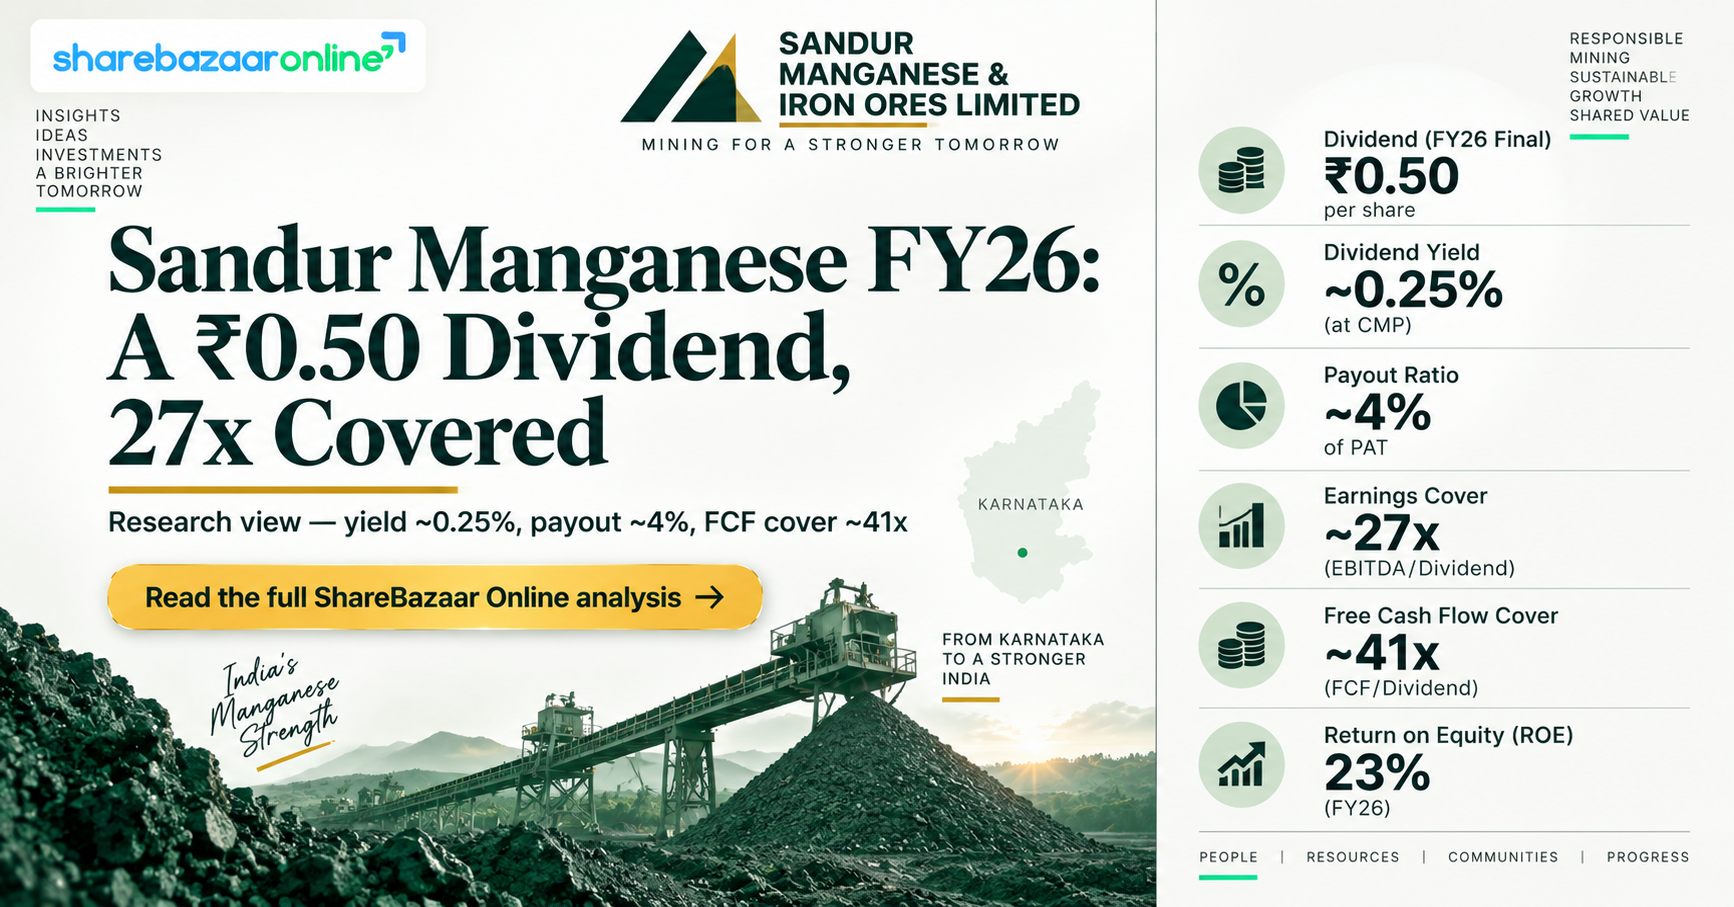
- Dividend per share: ₹0.50
- Dividend Yield (on CMP ~₹197): ~0.25%
- Estimated Dividend Outflow: ~₹24.3 crore
- Dividend Payout Ratio (FY26): ~4%
- Dividend Coverage (EPS ÷ DPS): ~27x
One-line View
The Sandur Manganese dividend of ₹0.50 is a token payout from a fast-growing miner. It is comfortably covered many times over by earnings and cash flow, but the yield is small because Sandur retains almost all of its profit to fund expansion and cut debt.
Market figures (CMP, market cap, ratios) sourced from NSE/BSE and public data aggregators (Screener, Tickertape, Business Standard) as of early September 2026. Financial-statement figures are on a consolidated basis unless stated otherwise.
Dividend Announcement Summary
On 7 May 2026, the Board of Directors of The Sandur Manganese & Iron Ores Limited, at its 384th meeting (2:00 PM to 5:30 PM), recommended a final dividend of ₹0.50 (Fifty Paise) per equity share of face value ₹10 for the financial year ended 31 March 2026. The recommendation was made under Regulation 30 of SEBI (LODR) Regulations, 2015 and was subject to shareholders’ approval at the ensuing Annual General Meeting.
What the filing stated
- Dividend type: Final Dividend
- Amount: ₹0.50 per share (5% of ₹10 face value)
- Financial year: FY 2025–26
- Record date in the 7 May filing: Not Disclosed by Company (to be decided later)
- Signed by Neha Thomas, Company Secretary & Compliance Officer
What followed (per later exchange filings)
- Record date fixed at the 385th Board meeting on 9 July 2026: 12 August 2026.
- Shareholders approved the dividend at the 72nd AGM on 19 August 2026.
- Company stated the dividend would be paid within 30 days of AGM approval.
Management context
The Board framed the dividend as recognition of strong FY26 performance and robust cash flows. Alongside the results, the company flagged the upcoming commencement of a Downhill Conveyor System (DCS) in FY27, the appointment of Ernst & Young LLP as internal auditor for FY27, and ongoing legal matters relating to forest lease extensions. Board recommendation and AGM approval were both required before payout — both are now complete.
Key Dates Timeline
Announcement Date
7 May 2026
384th Board meeting; dividend recommended.
Record Date
12 August 2026
Fixed at 385th Board meeting on 9 July 2026.
Ex-Dividend Date
12 August 2026
Aligned to record date under T+1 settlement (a few data providers list 11 Aug 2026).
AGM (Approval)
19 August 2026
72nd AGM via VC/OAVM; dividend approved by shareholders.
Payment Date
Within 30 days of AGM approval — i.e. on or before ~18 September 2026
The company did not disclose a single fixed payment date; it committed to pay within 30 days of the 19 August 2026 approval.
Note: the record date (12 Aug) preceded AGM approval (19 Aug) — a common structure where entitlement is fixed ahead of the meeting and payout follows approval.
Dividend Yield Analysis
Yield on latest price
CMP ≈ ₹197 (early Sep 2026)
Dividend yield = ₹0.50 ÷ ₹197 × 100 = ~0.25%
Yield on announcement-date price
Price around announcement (early May 2026) ≈ ₹200
Announcement yield = ₹0.50 ÷ ₹200 × 100 = ~0.25%
Yield Reality Check
A SANDUMA dividend yield of about 0.25% is very low — roughly one-sixth of the Basic Materials sector average of ~1.6% (per public dividend trackers). Importantly, this low yield is not caused by a falling share price or a weak business. The share is up strongly over one and three years, and earnings are growing. The low yield simply reflects a deliberate low-payout policy: Sandur pays a token dividend and reinvests the rest. In short, the small yield here signals capital being retained for growth, not distress.
Dividend History Analysis
Dividend per share — recent years (adjusted for bonus issues)
| Financial Year | DPS (adjusted) | Payout Ratio |
|---|---|---|
| FY 2025–26 | ₹0.50 | ~4% |
| FY 2024–25 | ₹0.42 | 4% |
| FY 2023–24 | ₹0.33 | 7% |
| FY 2022–23 | ₹0.28 | 5% |
| FY 2021–22 | ₹0.28 | 1% |
| FY 2020–21 | ₹0.19 | – |
Per-share amounts are as reported by public dividend trackers, adjusted for corporate actions. Note a 2:1 bonus issue during FY26 (equity capital rose from ~₹162 cr to ~₹486 cr), so raw pre-bonus per-share figures are not directly comparable across years.
What the trend shows
- On an adjusted basis, the dividend has risen steadily (₹0.19 → ₹0.28 → ₹0.33 → ₹0.42 → ₹0.50).
- The company has an uninterrupted recent payout record but with historically low ratios.
- Older history includes at least one substantial cut, so the very long-term record is not perfectly smooth.
Classification
Consistent Payer — but token/low-payout. Sandur consistently pays a small dividend that has grown gradually, while retaining ~95% of earnings. It behaves like a growth-stage compounder rather than an income stock.
Financial Performance Analysis
Consolidated results (₹ crore)
| Metric | FY 2024–25 | FY 2025–26 | Change |
|---|---|---|---|
| Revenue | 3,135 | 5,088 | +62.3% |
| Operating Profit (EBITDA) | 782 | 1,208 | +54.5% |
| Operating Margin (OPM) | 25% | 24% | ~flat |
| Net Profit (PAT) | 470 | 658 | +39.7% |
| EPS | ₹9.67 | ₹13.51 | +40% |
| Finance Cost (Interest) | 117 | 212 | +81% |
Source: consolidated financials as reported to exchanges / Screener. Standalone FY26: revenue ~₹2,011 cr, PAT ~₹543 cr (vs ~₹445 cr).
Operating Leverage
Revenue grew +62% while EBITDA grew +55% and PAT +40%. Profit growth lagged revenue growth mainly because finance costs jumped ~81% to ₹212 cr and depreciation rose sharply (to ~₹212 cr), reflecting the debt-funded expansion and a larger asset base. Operating margins held around 24–25%, so the drag is below the operating line (interest and depreciation), not a margin collapse.
Growth quality
- Q4 FY26 PAT: ₹235.8 cr, up ~51% year-on-year.
- 10-year compounded profit growth is very high (management’s scale-up of ferroalloys, coke and integration).
- ROE ~23% and ROCE ~24% — strong returns on capital.
Cash Flow Analysis
Reported profit vs actual cash
Profits can be an opinion; cash is a fact. Here the two line up well. FY26 Operating Cash Flow was ~₹1,143 crore against a net profit of ~₹658 crore — a cash-conversion (CFO/OP) of ~106%. The business is turning its earnings into real cash rather than just accounting profit.
Free cash flow & funding of the dividend
- FY26 Free Cash Flow: ~₹988 crore.
- Estimated dividend outflow: ~₹24.3 crore.
- FCF covers the dividend ~41 times over.
- The dividend is funded entirely from current earnings/free cash flow — not from reserves, asset sales, or borrowings.
Working capital signal
Debtor days improved to ~31 and inventory days fell to ~149 in FY26 (from elevated levels a year earlier), and the cash-conversion cycle shortened. Receivables did not run ahead of revenue in a worrying way — a healthy sign that the revenue growth is being collected in cash. Financing cash flow was a large outflow (~₹1,123 cr) as the company repaid debt.
Balance Sheet Strength
Debt position (Mar 2026)
- Total borrowings: ~₹999 crore, down from ~₹1,890 crore a year earlier (~47% reduction).
- Reserves: ~₹2,768 crore; Book value ~₹66.9/share.
- Investments on the balance sheet: ~₹281 crore. Exact cash & bank balance: Not Disclosed by Company in the sources reviewed.
Read-through
The key positive is that borrowings fell sharply even as the company paid a dividend — debt is being reduced, not increased, to fund the payout. Interest costs stayed high in FY26 (₹212 cr) because the debt was on the books for part of the year, but the direction of travel is deleveraging. Screener flags the balance sheet as strong; investors should still watch short-term working-capital swings typical of a commodity business.
Dividend Sustainability Analysis
Coverage checks
- Earnings cover: EPS ₹13.51 ÷ DPS ₹0.50 = ~27x.
- Free cash flow cover: ~41x.
- Payout ratio: ~4% of profit.
- Debt: falling. Earnings: growing.
Verdict
Sustainable. At a payout of only ~4%, this dividend is one of the easiest to sustain in the sector — even a sharp cyclical downturn in manganese/ferroalloy prices would leave the small payout well covered. The realistic risk is not a cut but that the payout stays token: income-focused investors should not expect a high or rapidly rising yield from this stock in the near term.
Peer Comparison
Sandur vs the closest manganese peer
| Metric | Sandur (SANDUMA) | MOIL Ltd |
|---|---|---|
| Dividend yield | ~0.25% | ~2.3–2.75% |
| Payout ratio | ~4% | ~40–53% |
| ROE | ~23% | lower |
| ROCE | ~24% | lower |
| Profile | Private, growth/expansion | PSU, mature income payer |
MOIL figures per public dividend trackers (yield varies with price); Basic Materials sector average yield ~1.6%.
Interpretation
The comparison captures two very different capital-allocation styles. MOIL, a manganese PSU, distributes a large share of profit and offers a meaningful yield. Sandur keeps its payout tiny and instead ploughs cash into capacity, integration and debt reduction — and, in turn, earns notably higher returns on capital (ROE ~23%, ROCE ~24%). Neither is “better” universally: MOIL suits income seekers; Sandur suits growth-oriented investors comfortable with a token dividend.
Promoter Impact Analysis
Shareholding (Jun 2026)
- Promoters: 74.22% (~36.08 crore shares)
- FIIs: 1.73%
- DIIs: 0.58%
- Public: 23.47%
Who receives the dividend
- Total outflow: ~₹24.3 crore.
- To promoters (74.22%): ~₹18.0 crore.
- To public + institutions (~25.8%): ~₹6.3 crore.
Distribution impact
Because promoters own nearly three-quarters of the company, the bulk of any dividend flows to the promoter group. However, the payout is so small (~4% of profit) that the amount is modest in absolute terms and immaterial to promoter wealth relative to their equity value. The choice to keep payouts low therefore aligns promoters and minority shareholders around the same outcome: reinvestment and share-price compounding rather than cash income.
Taxation Analysis
How dividends are taxed in India
- Since FY 2020–21, dividends are taxable in the hands of the investor at their applicable income-tax slab rate (the company no longer pays Dividend Distribution Tax).
- TDS under Section 194: the company deducts 10% if total dividend paid to a resident shareholder in a financial year exceeds ₹10,000 (threshold raised from ₹5,000 with effect from FY 2025–26). No PAN → TDS at 20%.
- TDS is adjustable against final tax liability; the net taxable income from dividends is added to total income.
Worked example (generic template)
- Shares held: 1,000
- Dividend: ₹10 per share
- Gross dividend: ₹10,000
- Tax slab: 30% → tax = ₹3,000
- Net dividend after tax: ₹7,000
- Effective yield falls by the tax rate (a 1% gross yield becomes ~0.7% post-tax).
Same maths on Sandur’s actual ₹0.50
- Shares held: 1,000
- Dividend: ₹0.50 per share
- Gross dividend: ₹500
- TDS: Nil (below the ₹10,000 threshold)
- Tax at 30% slab: ₹150 → net ₹350
- Post-tax yield on ~₹197 CMP: ~0.18%
Tax treatment depends on individual circumstances and prevailing law; consult a qualified tax advisor. This is general information, not tax advice.
Key Risks
1. Commodity cyclicality. Earnings depend on manganese ore, ferroalloy, iron ore and coke prices, which are volatile and tied to global steel demand. A downcycle can compress margins quickly.
2. Regulatory & forest-lease risk. Management has flagged ongoing legal matters on forest lease extensions; mining volumes hinge on approvals (CEC/MoEFCC/state authorities). Adverse rulings could hit output.
3. Rising finance costs. Interest expense jumped to ~₹212 crore in FY26 (from ~₹117 cr) on expansion/acquisition-related debt. If deleveraging stalls, this drag on PAT persists.
4. Geographic/asset concentration. Operations are concentrated in the Ballari–Hosapete belt of Karnataka; any environmental, weather or logistics disruption there affects the whole business.
5. Unrelated diversification. The group is entering hospitality, education and medical devices via new subsidiaries. Diversification away from core mining can divert capital and management attention with uncertain returns.
6. Low free float / thin institutional interest. With promoters at 74.22% and FII+DII under 2.5%, the free float is small, which can amplify price volatility and limit liquidity.
What To Monitor
1. Realisations & volumes. Quarterly manganese ore, ferroalloy and iron ore prices and dispatch volumes — the biggest swing factor for earnings.
2. Deleveraging & interest. Whether borrowings keep falling from ~₹999 crore and whether finance costs decline in FY27.
3. Capex execution. Commissioning of the Downhill Conveyor System (DCS) and progress on iron-ore capacity expansion (up to ~4.36 MTPA).
4. Forest-lease litigation. Any court or regulatory outcome on lease extensions that could affect mining rights and output.
5. New-venture capital use. Cash committed to the hospitality, academy, green-steel and metals subsidiaries, and the returns they generate.
6. Payout policy. Whether the dividend payout ratio moves up from the current token ~4% — a signal of a shift toward returning cash.
Conclusion
Positives
- Dividend is extremely well covered (~27x earnings, ~41x free cash flow).
- FY26 was a strong year: revenue +62%, PAT +40%, with high ROE/ROCE (~23%/24%).
- Cash conversion is healthy (~106%) and debt fell ~47% year-on-year.
- Adjusted dividend has grown steadily over recent years.
Negatives / watch-outs
- Yield is only ~0.25% — this is not an income stock.
- Finance costs rose sharply in FY26 (₹212 cr).
- Commodity-price and forest-lease risks are real and outside the company’s control.
- New non-core diversification adds execution uncertainty.
In short, the Sandur Manganese final dividend of ₹0.50 is best read as a signal of financial health, not an income opportunity. The company is choosing to compound capital internally — strong returns, falling debt, growing profit — while paying a symbolic dividend. Readers should weigh the positives, negatives, risks and monitoring points above and decide for themselves in line with their own goals.
Frequently Asked Questions
What dividend has Sandur Manganese announced for FY26?
What is the Sandur Manganese (SANDUMA) dividend yield?
What is the record date for the Sandur Manganese dividend?
What is the ex-dividend date?
When will the dividend be paid?
Who is eligible to receive the dividend?
How is the Sandur Manganese dividend taxed?
Is the Sandur Manganese dividend sustainable?
What is Sandur Manganese’s dividend history?
What should investors monitor after this dividend?
How does Sandur’s dividend compare with MOIL?
Why is the dividend yield so low if the company is doing well?
Disclaimer
This article is for informational and educational purposes only and is not investment, financial, legal or tax advice. It does not constitute a recommendation to buy, sell or hold any security. Figures relating to the dividend are based on the company’s stock-exchange filings; other financial and market data are sourced from public providers (including NSE/BSE, Screener, Tickertape, Business Standard and dividend trackers) and may contain errors or become outdated. Tax treatment depends on individual circumstances and current law. Securities markets are subject to risks; please read all related documents carefully and consult a SEBI-registered investment adviser and a qualified tax professional before investing. ShareBazaar Online and the author accept no liability for any loss arising from the use of this content.