
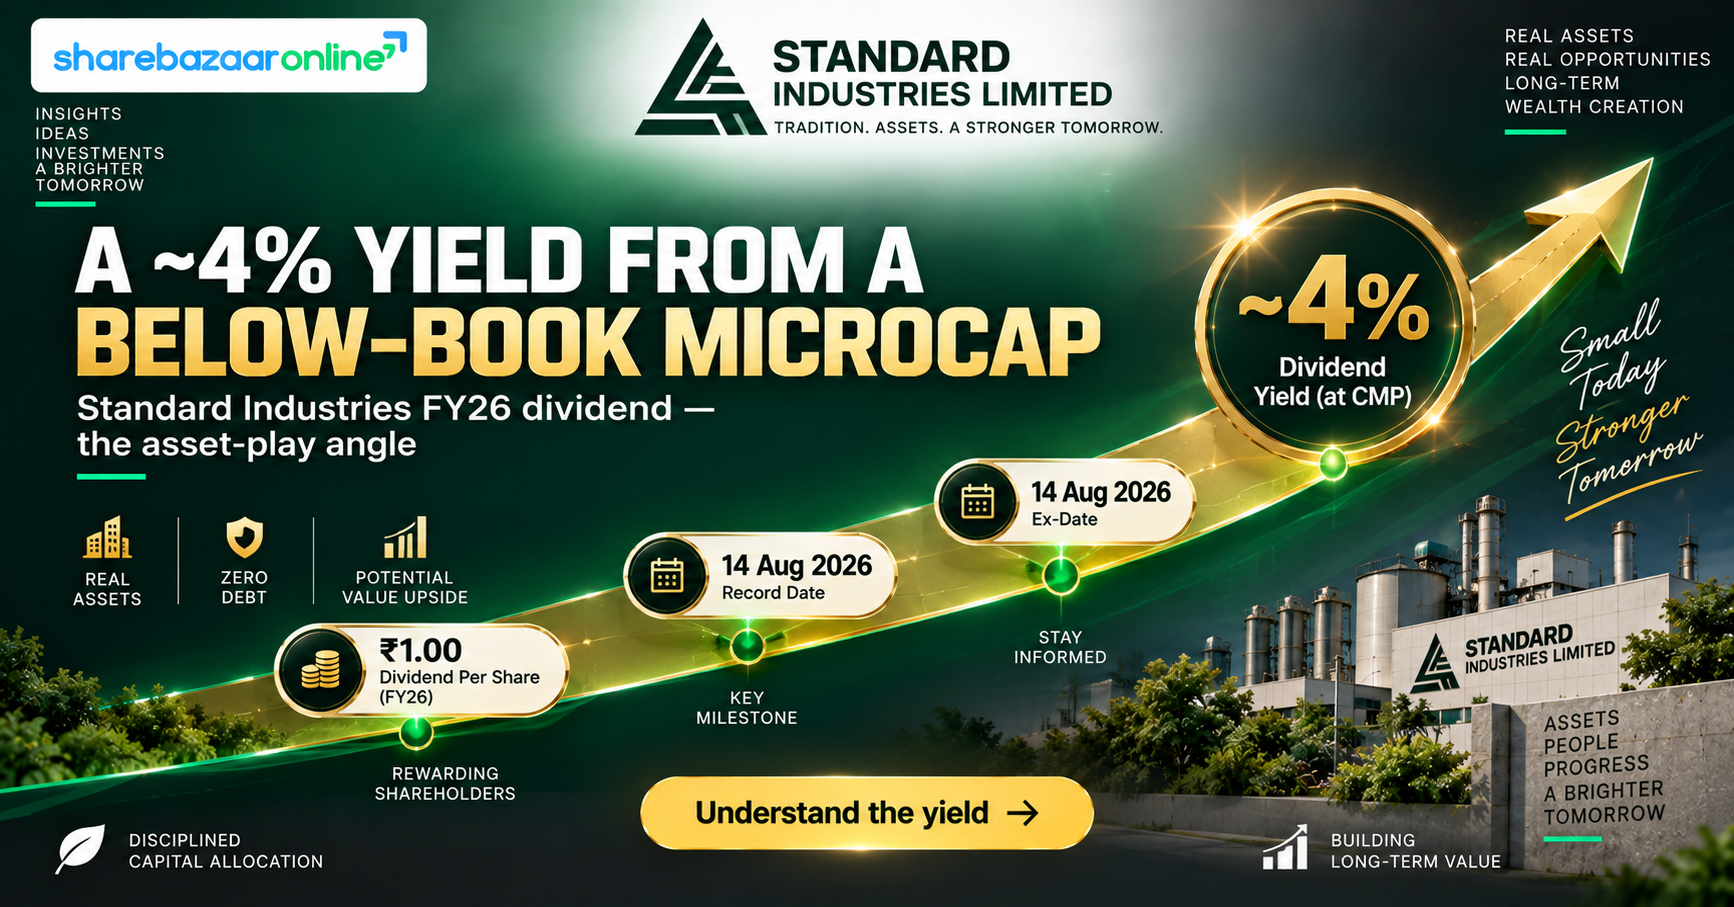
Dividend Snapshot
Standard Industries Limited (NSE: SIL | BSE: 530017) has recommended a Final Dividend of ₹0.25 per share (5% on a face value of ₹5) for FY 2025-26. Combined with the ₹0.55 interim dividend already paid, the company's total dividend for the year works out to ₹0.80 per share (16%). Here is the quick snapshot before we get into the detailed analysis.
Company: Standard Industries Limited
NSE Symbol: SIL | BSE Code: 530017
ISIN: INE173A01025
Dividend Type: Final Dividend
Dividend Per Share: ₹0.25
Dividend %: 5% | Face Value: ₹5
Announcement Date: 12 May 2026
Record Date: 11 August 2026 (Tuesday)
Ex-Date: 11 August 2026 (derived; under T+1 the ex-date is typically the record date — not separately stated by the company)
Payment Date: On or before 17 September 2026
Financial Year: 2025-26
AGM: 129th AGM, 18 August 2026
Shares Outstanding: 6,43,28,941
Share Capital: ₹32.16 Cr
Final Dividend Outflow: ₹1.61 Cr (computed)
Total FY26 Dividend Outflow: ₹5.15 Cr (computed)
FY26 Net Result (Standalone): Net Loss of ₹17.59 Cr
FY26 Net Result (Consolidated): Net Loss of ₹19.50 Cr
Approx. Trailing Dividend Yield: ~4% at a market price of ~₹20 (external market data)
Board Recommendation: Subject to shareholder approval at the 129th AGM
Dividend Announcement Summary
At its board meeting on 12 May 2026, the Board of Directors of Standard Industries Limited recommended a final dividend of ₹0.25 per equity share on 6,43,28,941 shares of ₹5 each, for the financial year 2025-26. The recommendation is subject to shareholder approval at the ensuing 129th Annual General Meeting on 18 August 2026.
What was declared
This ₹0.25 is the final dividend. Earlier in the year the company had already declared an interim dividend of ₹0.55 per share (11%) on 12 February 2026, which was paid on 11 March 2026. So a shareholder eligible for both would receive ₹0.80 per share for FY26 in total.
Accounting treatment
Per Ind AS 10, the company has not recorded the final dividend as a liability in the FY26 accounts, because it is only recommended and becomes payable after shareholder approval. It will be recognised in FY27 once approved.
The bigger picture from the same board meeting
The board meeting was not only about the dividend. The company also approved the assignment of development rights in its Dadar (West) land parcel (Stanrose Apartment) to Prabhadevi Developer Private Limited for a consideration of ₹169.51 Cr (plus four flats and sixteen car-park spaces). This is central to understanding how a loss-making company can comfortably pay a dividend — the story here is about asset monetisation, not operating profit.
Key Dates Timeline
12 May 2026 — Board recommends final dividend of ₹0.25
11 August 2026 — Record Date (to determine eligible shareholders)
11 August 2026 — Ex-Date (derived under T+1 settlement)
18 August 2026 — 129th AGM (shareholders vote on the dividend)
On or before 17 September 2026 — Dividend payment (if approved)
Already done: Interim ₹0.55 paid on 11 March 2026
Eligibility rule (plain English): To receive this dividend, you must hold the shares before the ex-date. If you buy on or after the ex-date, the seller — not you — gets the dividend. With India's T+1 settlement, the ex-date and record date usually fall on the same day, here 11 August 2026.
Dividend Yield Analysis
Dividend yield = dividend per share ÷ market price. Because SIL's share price has swung between roughly ₹11.70 and ₹21.71 over the past year (external market data), the yield you actually lock in depends heavily on the price at which you buy. Below we show the yield on both the final dividend (₹0.25) and the full-year dividend (₹0.80) at two reference prices.
Yield on the Final Dividend (₹0.25)
At ₹20.00 (latest available): 1.25%
At ₹16.40 (late-July 2026 close): 1.52%
At ~₹13.50 (around the 12 May announcement window*): ~1.85%
Yield on Full-Year Dividend (₹0.80)
At ₹20.00 (latest available): 4.00%
At ₹16.40 (late-July 2026 close): 4.88%
At ~₹13.50 (announcement window*): ~5.93%
Yield reality check — why the headline yield can mislead
A ~4% trailing yield looks attractive for a microcap, but three things temper it: (1) the yield is partly high because the share price is depressed by continuous losses (the P/E is negative), not because the payout is unusually generous; (2) the dividend is funded from asset sales and reserves, not recurring earnings (see the Cash Flow and Sustainability sections); and (3) the payout record is irregular, with a multi-year gap around FY2019-FY2021. In short, treat this as an asset-play yield, not a reliable, earnings-backed income stream.
*Exact 12 May 2026 closing price is Not Disclosed in the company filing; the announcement-window figure is an approximation based on external market data from the surrounding weeks (stock traded in the low-to-mid ₹teens in early-mid 2026).
Dividend History Analysis
Dividend track record (by ex-date, external market data)
| Ex-Date | Dividend / Share | Type |
|---|---|---|
| 11 Aug 2026 | ₹0.25 | Final (this announcement) |
| Feb / Mar 2026 | ₹0.55 | Interim (FY26) |
| 30 Jul 2024 | ₹0.55 | FY24 |
| 28 Mar 2024 | ₹0.50 | FY24 interim |
| 25 Jul 2023 | ₹0.25 | FY23 |
| 01 Jun 2023 | ₹0.80 | FY23 |
| 10 Aug 2022 | ₹0.75 | FY22 |
| 30 May 2022 | ₹1.75 | FY22 (large) |
| FY2019 – FY2021 | No dividend | Gap / lean years |
| Jun & Aug 2018 | ₹0.75 + ₹0.25 | FY18/FY19 |
| May & Aug 2017 | ₹0.75 + ₹0.75 | FY17/FY18 |
What the record tells us
Payouts have varied widely (₹0.25 to ₹1.75), and there was a clear gap of roughly three years when no dividend was paid. Dividends resumed strongly in 2022, coinciding with periods of asset monetisation rather than a turnaround in the trading/property operations.
Classification
On the evidence, SIL is best described as an Irregular / Cyclical Payer — not a Consistent Payer. Its dividends track the timing of asset sales and available reserves, so investors should not assume a fixed or growing annual payout.
Financial Performance Analysis
Standalone snapshot (₹ Cr, from the company filing)
| Metric | FY26 | FY25 |
|---|---|---|
| Revenue from Operations | 30.68 | 22.35 |
| Total Income | 31.08 | 25.01 |
| Finance Costs | 3.44 | 2.01 |
| Net Profit / (Loss) | (17.59) | (13.80) |
| EPS (₹) | (2.73) | (2.15) |
| Total Comprehensive Income | 2.07 | (13.71) |
Operating leverage — revenue up, losses up
Revenue from operations rose about 37% (₹22.35 Cr to ₹30.68 Cr), yet the net loss widened from ₹13.80 Cr to ₹17.59 Cr. The trading business earns razor-thin margins, and rising finance costs (up ~71% to ₹3.44 Cr) plus higher other expenses more than absorbed the extra sales. This is negative operating leverage — more turnover has not translated into profit.
Why "comprehensive income" is positive
Despite the ₹17.59 Cr net loss, total comprehensive income was positive at ₹2.07 Cr. The swing came from a ₹19.54 Cr fair-value gain on equity instruments (the exit from Duville Estates Pvt Ltd), routed through OCI. That is a one-off investment gain, not recurring business profit — an important distinction.
Consolidated view
On a consolidated basis (including subsidiaries Standard Salt Works and Mafatlal Enterprises), FY26 revenue was ₹34.33 Cr and the net loss was deeper at ₹19.50 Cr (EPS ₹(3.03)). Reported profitability at both levels is negative; return ratios are correspondingly weak, with external data showing ROE around -10% to -11% and ROCE around -8% to -13%.
Cash Flow Analysis
Reported profit is an opinion; cash is a fact. This is where SIL's story becomes clearer. On a standalone basis the company reported positive operating cash flow of ₹42.85 Cr in FY26 — a striking figure for a company that lost ₹17.59 Cr. So where did the cash come from?
Operating cash flow vs net profit
Before working-capital changes, operations actually consumed ₹12.03 Cr of cash — consistent with the loss. The entire positive OCF came from a ₹56.50 Cr jump in trade and other payables, almost certainly customer advances/tranches linked to the property development transaction. Core operations did not generate this cash; a working-capital inflow did.
Free cash flow
Capital expenditure (largely spending on property under development) was ₹56.39 Cr, taking property-under-development on the balance sheet from ₹5.00 Cr to ₹55.27 Cr. Net of this, free cash flow was negative. The company also raised ₹55.87 Cr by selling financial assets. In effect, SIL is recycling investments and project advances into a large real-estate build-out.
How is the dividend actually funded?
The FY26 cash dividend outflow of ₹3.58 Cr was not funded by current earnings (there were none) and not by core operating profit. It is supported by the company's reserves, liquid investments and asset-monetisation proceeds. During FY26 the company even used its cash to fully repay ₹12.25 Cr of borrowings — a positive for the balance sheet, but a reminder that the cash story rests on the investment portfolio and property realisations, not the trading business.
Balance Sheet Strength
Debt & equity (standalone)
Term borrowings: NIL (₹12.25 Cr repaid in FY26)
Total Equity: ₹166.74 Cr
Book Value / Share: ~₹25.9 (standalone); ~₹17.9 (consolidated)
P/B: below 1x at recent prices (external data)
Liquidity & assets (standalone)
Cash & bank: ₹2.58 Cr
Current investments: ₹24.23 Cr
Non-current investments: ₹8.77 Cr
Investment in subsidiary (Standard Salt Works): ₹59.75 Cr (at cost)
Property under development: ₹55.27 Cr
This is the paradox of Standard Industries: a weak profit-and-loss statement sitting on a strong, debt-free balance sheet. Total assets are around ₹242.68 Cr (standalone) against a market capitalisation of only ~₹100-130 Cr (external data), which is why the stock trades below book value. The auditors added an emphasis-of-matter note that no provision has been made against the ₹59.69 Cr investment in Standard Salt Works, citing the subsidiary's long-term strategic value — a judgement investors should keep in view.
Dividend Sustainability Analysis
Coverage checks
Payout ratio (÷ PAT): Not meaningful — the company reported a net loss
Dividend coverage (EPS ÷ DPS): Negative — not covered by earnings
Cash coverage of full-year dividend: ~5.2x (liquid assets ₹26.80 Cr ÷ ₹5.15 Cr)
Cash coverage of final dividend: ~16.7x
Debt & earnings trend
Debt: Zero term debt — dividends are not being funded by borrowing (a genuine positive)
Earnings trend: Declining / loss-making at the operating level for multiple years
Funding source: Reserves, liquid investments and asset sales
Verdict: Moderately Sustainable
The dividend is comfortably affordable in the near term — the outflow is tiny relative to the company's liquid assets and debt-free balance sheet, and the ₹169.51 Cr Dadar transaction and completed Duville exit provide a strong cash cushion. But it is not backed by recurring business profit. A payout that depends on selling assets and unlocking property value can continue only as long as there are assets to monetise and management chooses to distribute rather than reinvest. We therefore classify it as Moderately Sustainable: safe for now, but not a dependable, earnings-driven income stream over the long run.
Peer Comparison
SIL is difficult to slot against clean peers: it is a microcap asset-monetisation company with a small textile/chemical trading arm and a property division, rather than a typical operating business. The comparison below is therefore about profile, not a like-for-like league table.
How a typical dividend payer looks
Reliable dividend stocks usually show positive ROE/ROCE, a payout ratio comfortably below 100% of profits, consistent year-on-year dividends, and dividends funded from operating earnings. Their yield reflects a healthy business paying out a share of real profit.
How SIL compares
SIL shows negative ROE/ROCE, a payout that cannot be measured against profit (there is none), an irregular dividend history, and dividends funded from the balance sheet. Its edge over peers is a zero-debt, asset-rich, below-book profile — the appeal is the underlying asset value, with the dividend as a by-product of monetisation.
Exact peer-level yield, ROE, ROCE and payout figures for named comparators are Not Disclosed by Company and should be verified from each peer's own filings before drawing conclusions; sector realty/textile-trading averages differ so widely that a headline "sector yield" would be misleading here.
Promoter Impact Analysis
Who owns SIL (external data)
Promoters (Mafatlal group): ~20.31%
FIIs: ~38.86%
DIIs: ~3.97%
Public: ~36.86%
Who gets the dividend (computed)
Total FY26 dividend to promoters: ~₹1.05 Cr (20.31% of ₹5.15 Cr)
Total FY26 dividend to FIIs: ~₹2.00 Cr (38.86%)
Final ₹0.25 to promoters: ~₹0.33 Cr
An unusual feature here is that foreign institutional investors own almost twice the promoter stake. As a result, FIIs collect a larger share of the dividend than promoters do. The dividend is spread across a broad base — every minority shareholder benefits proportionately, and there is no structural bias towards promoters. The relatively low ~20% promoter holding is also worth noting as a governance data point for prospective investors.
Taxation Analysis
How dividends are taxed in India
Since FY 2020-21, dividends are taxed in the hands of the investor at their applicable income-tax slab rate (the company no longer pays Dividend Distribution Tax). The company deducts TDS at 10% under Section 194 if your total dividend from that company in a financial year exceeds ₹10,000 (threshold revised upward from ₹5,000, effective FY2025-26). If you have not linked your PAN, TDS is 20%. You can claim the TDS as credit when filing your return.
Worked example (generic, 30% slab)
Shares held: 1,000 | Dividend: ₹10 / share
Gross dividend: ₹10,000
TDS @10%: ₹1,000 (deducted at source, adjustable)
Tax @30% + 4% cess: ₹3,120
Net dividend in hand: ₹6,880
Effective yield: the pre-tax yield is reduced by ~31.2% for a top-slab investor
SIL-specific example
Shares held: 1,000 | FY26 dividend: ₹0.80 / share
Gross dividend: ₹800
TDS: ₹0 (below the ₹10,000 threshold)
Tax @30% + cess: ~₹250
Net dividend: ~₹550 for a top-slab investor (nil tax if income is below the taxable limit)
Post-tax yield at ~₹20: ~4.0% gross drops to ~2.8% for a 30%-slab investor
Tax rules and thresholds can change; the above is general information, not tax advice. Consult a qualified tax professional for your situation.
Key Risks
1. Loss-making core business
The trading and property operations have posted multi-year losses (net loss of ₹17.59 Cr in FY26). Without a turnaround, future dividends depend entirely on selling assets.
2. Asset-monetisation dependency
Cash flow and dividends hinge on transactions like the ₹169.51 Cr Dadar land deal and the Duville exit. These are lumpy and finite — once sold, they do not repeat.
3. Real-estate execution risk
The ₹169.51 Cr consideration is payable in tranches and the deed is yet to be executed. Delays, disputes or a property-market downturn could push out the expected cash inflows.
4. Irregular payout history
With a multi-year gap and payouts ranging from ₹0.25 to ₹1.75, there is no assurance of a stable or growing dividend. Income-focused investors face uncertainty.
5. Microcap liquidity & valuation risk
SIL is a thinly traded microcap (market cap ~₹100-130 Cr) with a negative P/E and low free float relative to institutional ownership. Prices can be volatile and hard to exit at scale.
6. Subsidiary valuation judgement
The auditor's emphasis-of-matter on the ₹59.69 Cr investment in Standard Salt Works (no provision made) is a reminder that a large chunk of book value rests on a management judgement about long-term value.
What To Monitor
1. Execution of the Dadar land deal
Track when the deed is executed and how the ₹169.51 Cr is received across tranches. Note: SIL's Q1 FY27 (June 2026 quarter) result reportedly swung to a large net profit as this transaction began to be recognised (external data) — watch how it flows through.
2. Core operating margins
Watch whether the trading and property operations move toward break-even, or whether losses persist despite higher revenue. Sustainable dividends ultimately need a viable business.
3. Use of monetisation proceeds
Will management reinvest, return cash via dividends/buybacks, or reduce risk? Capital-allocation choices will drive shareholder returns far more than the trading business.
4. Balance-sheet quality
Monitor cash, liquid investments and any return of debt. The debt-free status is a key strength — watch that it is maintained as the property build-out proceeds.
5. Dividend consistency
Watch whether payouts settle into a predictable pattern or continue to lurch with asset sales. Consistency (or its absence) will define whether SIL is an income idea at all.
6. Institutional ownership shifts
With FIIs holding ~38.86%, track quarterly shareholding changes. Large institutional buying or selling can materially move a low-float microcap.
Conclusion
Positives
Debt-free balance sheet; large asset backing (property, subsidiary and investment portfolio) trading below book value; a small dividend outflow (₹5.15 Cr) that is easily covered by liquidity (~5.2x); and a clear near-term cash catalyst in the ₹169.51 Cr Dadar transaction.
Negatives
A loss-making core business; dividends funded by asset sales rather than earnings; an irregular payout record; microcap liquidity and volatility; and reliance on management judgement for a large part of book value.
Standard Industries' ₹0.25 final dividend (₹0.80 for the full year) is best understood as a distribution from an asset-monetisation story, not a reward from a thriving operating business. The headline ~4% yield is real but rests on a depressed, loss-driven share price and finite asset sales. We present the positives, negatives, risks and monitoring factors above so you can weigh them against your own goals and risk appetite. This article does not offer any buy, sell or hold recommendation.
Frequently Asked Questions
What dividend has Standard Industries announced?
What is the Standard Industries dividend yield?
What is the record date for the Standard Industries dividend?
What is the ex-date for the dividend?
When will the dividend be paid?
Who is eligible for the dividend?
How is the Standard Industries dividend taxed?
Is the Standard Industries dividend sustainable?
What is Standard Industries' dividend history?
Why is Standard Industries paying a dividend despite reporting a loss?
What is the total dividend outflow and who benefits most?
What should investors monitor going forward?
Disclaimer
This article is for informational and educational purposes only and does not constitute investment, financial, legal or tax advice, nor any buy, sell or hold recommendation. Figures taken from the company's board-meeting filing and audited results are stated as such; market data (share price, yield, shareholding, ROE/ROCE, dividend history) is sourced from public third-party platforms and may change. All computed ratios are estimates based on available data. Securities markets carry risk; please read all related documents carefully and consult a SEBI-registered investment adviser before making any decision. ShareBazaar Online and its authors are not liable for any loss arising from the use of this information.