
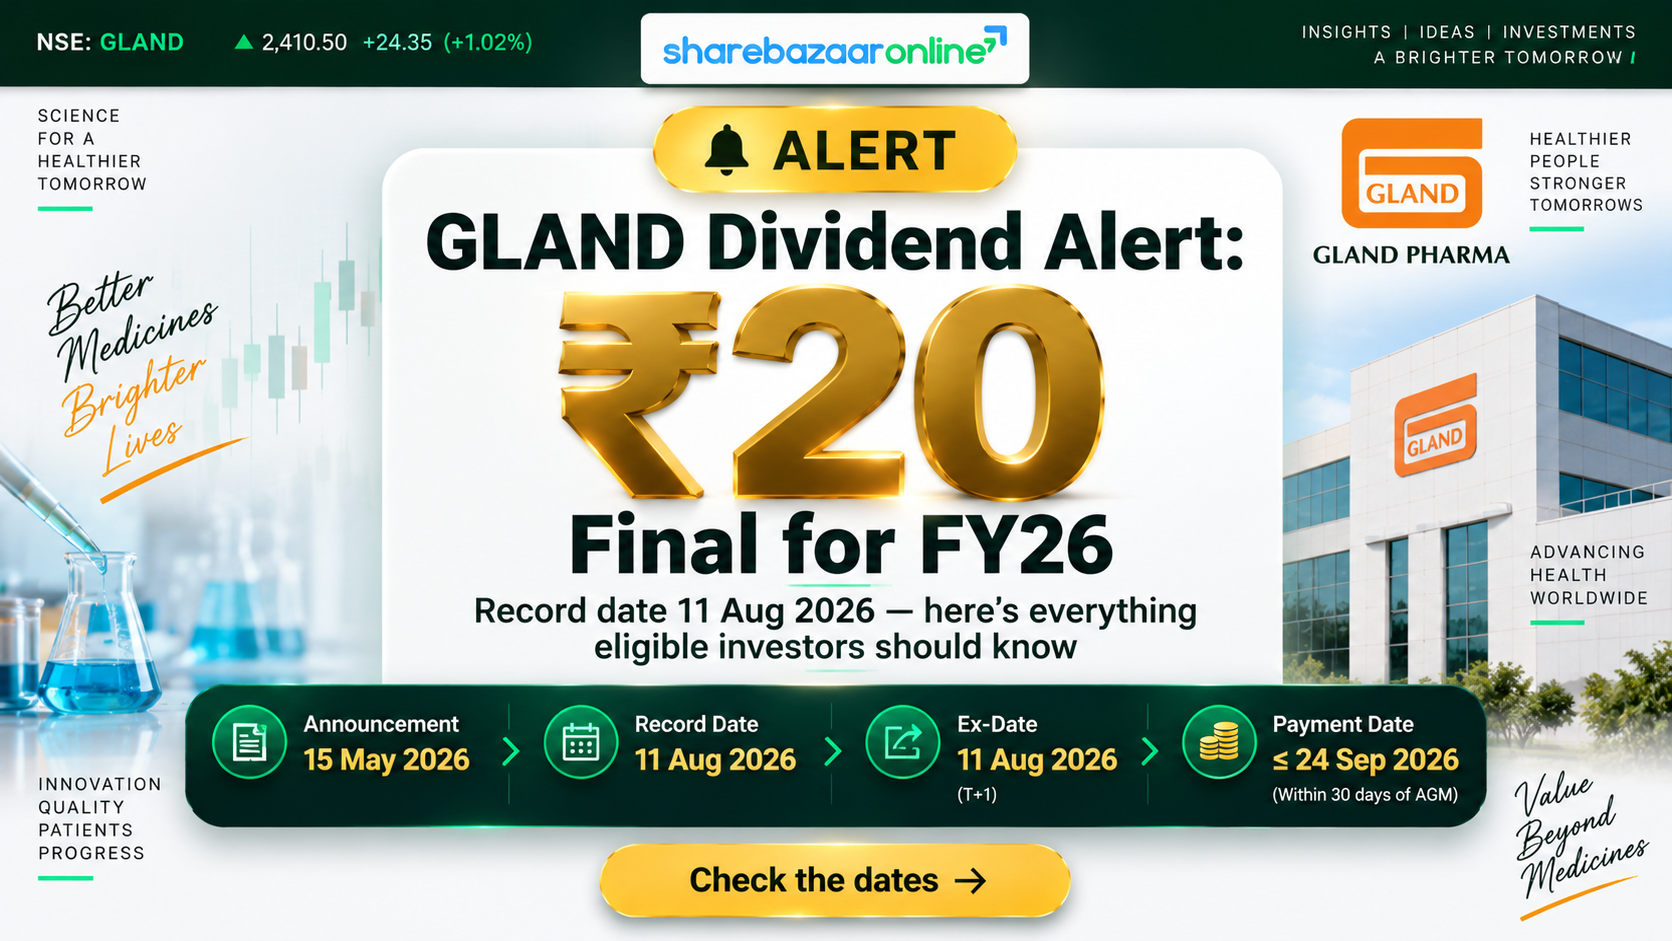
Dividend Snapshot
Gland Pharma Limited (NSE: GLAND, BSE: 543245, ISIN: INE068V01023) has announced a final dividend of ₹20 per equity share for the financial year 2025-26. On a face value of just ₹1, that works out to a headline rate of 2000% — a number that looks dramatic but simply reflects the tiny ₹1 face value. The dividend was recommended at the board meeting on 15 May 2026 and needs shareholder approval at the 48th Annual General Meeting.
Dividend Per Share
₹20
Final Dividend • FY2025-26 • Face value ₹1 (2000%)
Dividend Yield (at latest price)
~0.71%
On CMP of ~₹2,820 (NSE, 2 Sep 2026); ~1.07% on the announcement-day price of ~₹1,867
Total Dividend Outflow
~₹329.5 Cr
₹20 × 16.48 crore shares
Payout Ratio (Consolidated)
~32%
Of consolidated FY26 net profit of ₹1,027 Cr
Dividend Announcement Summary
At its board meeting on Friday, 15 May 2026, the Board of Directors of Gland Pharma approved the audited FY26 results (standalone and consolidated) and recommended a final dividend of ₹20 per share of ₹1 face value. The dividend is a full-year payout for FY2025-26 and, importantly, it is Gland Pharma's only dividend for the year — the company does not pay interim dividends.
The recommendation came alongside a strong set of results. For the year, consolidated revenue from operations rose 14.5% to ₹6,430.7 Cr and consolidated net profit jumped ~47% to ₹1,027.3 Cr. The stronger Q4 (net profit up ~97% year-on-year) and the CDMO ramp-up gave the board the confidence to raise the dividend back to ₹20, after trimming it to ₹18 in FY25. Statutory auditors Deloitte Haskins & Sells issued an unmodified (clean) opinion on both sets of accounts.
What is a "final dividend"? It is a dividend proposed by the board after the full-year accounts are finalised and paid only after shareholders approve it at the AGM. This is different from an interim dividend, which a board can pay mid-year without waiting for the AGM. So the ₹20 here is conditional on the shareholders voting "yes" at the 48th AGM.
Key Dates Timeline
Announcement Date
15 May 2026
Board meeting — dividend recommended
Record Date
11 Aug 2026 (Tue)
Shareholders on record eligible for the dividend
AGM Date
25 Aug 2026 (Tue)
48th AGM via video conferencing; dividend approval
Payment Date
Within 30 days of AGM
i.e. on or before ~24 Sep 2026, post shareholder nod
To be eligible, an investor needed to hold shares as of the record date of 11 August 2026. Because Indian equities settle on a T+1 basis, the ex-date effectively fell on the same day (11 August 2026) — shares had to be bought on or before 8 August 2026 (the last trading day before, given the intervening weekend) to qualify. As the record date has already passed, eligibility for this particular payout is now closed.
Dividend Yield Analysis
Dividend yield tells you the cash return a dividend gives relative to the share price. The formula is simply (Dividend Per Share ÷ Share Price) × 100.
Yield on Announcement-Day Price
~1.07%
₹20 ÷ ~₹1,867 (approx. 15 May 2026 close, before the post-result rally)
Yield on Latest Price
~0.71%
₹20 ÷ ~₹2,820 (NSE, 2 Sep 2026)
Yield reality check — why the yield keeps falling. Notice the yield has dropped from ~1.07% to ~0.71% even though the dividend amount stayed at ₹20. That fall is not a sign of weakness — it is because the share price rallied roughly 50% over the past year (from a 52-week low of ₹1,573.6 to a high of ₹3,039.8, per NSE data). When the price rises faster than the dividend, the yield mechanically shrinks. So Gland's low yield here reflects strong capital appreciation and re-rating after two strong quarters, not a shrinking payout. Gland Pharma is fundamentally a growth-plus-modest-dividend stock, not a high-yield income stock.
Dividend History Analysis
Gland Pharma listed on the exchanges in November 2020, so its dividend track record as a public company is short. It did not distribute a dividend in its first few listed years, preferring to retain earnings. Its dividend journey looks like this:
| Financial Year | Dividend Type | DPS (₹) | Record Date | Payment |
|---|---|---|---|---|
| FY2025-26 | Final | 20.00 | 11 Aug 2026 | By ~Sep 2026 |
| FY2024-25 | Final | 18.00 | 14 Aug 2025 | 27 Sep 2025 |
| FY2023-24 | Final | 20.00 | 16 Aug 2024 | 29 Sep 2024 |
| FY2020-21 to FY2022-23 | — | Nil | — | No dividend |
Source: exchange filings, TipRanks & IndMoney dividend records. Dates approximate.
What the pattern shows: Gland began paying dividends only from FY24. In three years the DPS moved ₹20 → ₹18 → ₹20 — that is, a 10% cut in FY25 (a year of muted earnings) followed by a restoration to ₹20 in FY26 as profits recovered. The dividend clearly tracks earnings rather than following a fixed, ever-rising policy. On the available record we would classify Gland as an emerging / earnings-linked payer — not yet a long, unbroken "consistent grower," and one that has already shown it will trim the payout when profits dip.
Financial Performance Analysis
| Metric (Consolidated, ₹ Cr) | FY26 | FY25 | Growth |
|---|---|---|---|
| Revenue from operations | 6,430.7 | 5,616.5 | +14.5% |
| Reported EBITDA | 1,629.5 | 1,268.9 | +28.4% |
| Profit before tax | 1,464.6 | 1,062.7 | +37.8% |
| Net profit (PAT) | 1,027.3 | 698.5 | +47.1% |
| Basic EPS (₹) | 62.35 | 42.40 | +47.1% |
Operating leverage — profits growing far faster than revenue. This is the story of the year. Revenue rose 14.5%, but EBITDA rose 28.4% and net profit rose 47.1%. When profits grow at 3x the pace of revenue, it signals strong positive operating leverage — costs are being spread over a larger base and margins are widening. Gross margin improved from 63% to 65%, and adjusted EBITDA margin from 23% to 26% (company figures). The improvement was driven by the higher-margin base (Gland) business, whose adjusted EBITDA margin reached ~38%.
A crucial nuance — standalone vs consolidated. Gland's standalone net profit was ₹1,299.6 Cr, higher than its consolidated net profit of ₹1,027.3 Cr. The gap exists because the French subsidiary Cenexi still runs at a loss (FY26 EBITDA of about −₹33.6 Cr). In other words, the Indian core business earns more than the group reports, and Cenexi is diluting group profitability. This matters for the dividend because the payout is comfortably covered either way, but the group-level ROE is being dragged down by the European unit.
Cash Flow Analysis
Reported profits are an accounting opinion; cash is a fact. So the key test for any dividend is whether the company actually generates the cash to fund it. Here Gland Pharma looks solid.
Operating Cash Flow (FY26)
₹1,031.4 Cr
vs net profit of ₹1,027.3 Cr → OCF/PAT ≈ 1.0x (healthy cash conversion)
Free Cash Flow (FY26)
~₹537.0 Cr
OCF minus capex of ~₹494 Cr
FCF Coverage of Dividend
~1.63x
₹537 Cr FCF ÷ ₹329.5 Cr dividend outflow
Cash Coverage of Dividend
~10.2x
₹3,359 Cr cash & equivalents ÷ dividend outflow
How is this dividend funded? Clearly out of current earnings and free cash flow — not from borrowings and not from asset sales. Operating cash flow (₹1,031 Cr) fully backs reported profit, free cash flow (₹537 Cr) covers the ₹329.5 Cr dividend 1.6 times over, and the company is sitting on a large cash pile. That is a reassuring picture.
The one yellow flag — receivables. Consolidated trade receivables rose to ₹1,891 Cr from ₹1,517 Cr, a jump of ~24.7%, faster than revenue growth of 14.5%. Cash flow shows receivables consumed ₹278.6 Cr of working capital during the year. When receivables grow faster than sales, it can mean the company is extending more credit to customers, which can strain cash later. The reassuring counter-point: management data for Q1 FY27 indicates receivable days fell sharply (from ~161 to ~94 days), suggesting the build-up is being worked down. This is a metric worth watching.
Balance Sheet Strength
Cash & Cash Equivalents
₹3,359 Cr
Consolidated, as at 31 Mar 2026
Total Borrowings
~₹243 Cr
Net cash of ~₹3,116 Cr — effectively debt-free
Return on Equity (3-yr avg)
~9.3%
FY26 group RoNW ~11% (company); modest vs peers — Screener
Return on Capital Employed (FY26)
~12%
Company-reported (investor presentation)
Gland's balance sheet is a genuine strength. It is net-cash positive by roughly ₹3,116 Cr with almost no meaningful debt, and its equity base (net worth) crossed ₹10,358 Cr. The obvious trade-off is capital efficiency: a large cash pile plus a still-loss-making Cenexi means the return on equity is a modest ~9.3% on a 3-year basis — lower than most large-cap pharma peers. So the safety of the dividend is not in doubt; the debate is whether that idle cash could work harder.
Dividend Sustainability Analysis
Dividend Coverage (EPS ÷ DPS)
~3.1x
Consolidated EPS ₹62.35 ÷ DPS ₹20 (standalone ~3.9x)
Payout Ratio
~32%
Of consolidated PAT (~25% of standalone PAT)
Putting the four sustainability tests together:
1. Cash position — Can the company afford it? Easily. Cash covers the dividend ~10x. 2. Free cash flow — Is it covered by FCF? Yes, ~1.6x. 3. Debt — Is debt rising to fund payouts? No — the company is net-cash and its dividend cash outflow (₹296.6 Cr paid in FY26) is well below FCF. 4. Earnings trend — Growing or declining? Growing strongly (PAT +47%).
Verdict: Sustainable. On coverage, cash, debt and earnings, the ₹20 dividend is highly sustainable and, in fact, conservative relative to the balance sheet. The only caveats are (a) the payout is earnings-linked and the company has cut it before (FY25), so it is not guaranteed to only rise, and (b) sustainability of the growth that supports future increases depends on the Cenexi turnaround and continued US momentum.
Peer Comparison
| Company | Approx. Div Yield | Approx. ROE | FY26 DPS |
|---|---|---|---|
| Gland Pharma | ~0.7–1.1% | ~9.3% | ₹20 (FV ₹1) |
| Sun Pharma | ~0.84% | ~13.7% | ₹16 (FV ₹1) |
| Dr Reddy's | ~0.68% | ~11.1% | ₹8 (FV ₹5) |
| Cipla | ~0.9% | ~11.3% | ₹13 (FV ₹2) |
| Torrent Pharma | ~0.8% | high | ₹38 (FV ₹5) |
Source: company filings, Univest, IndMoney, TipRanks (Aug–Sep 2026). Figures approximate; DPS across different face values so not directly comparable in rupee terms.
Where Gland sits: Its dividend yield (~0.7–1.1%) is broadly in line with, or a touch below, large-cap pharma peers, which mostly cluster around 0.7–0.9%. None of these are high-yield stocks — Indian pharma is a growth sector, and dividends are a secondary consideration. Where Gland lags is return on equity (~9.3% vs 11–14% for peers), partly a function of its large cash balance and the Cenexi drag. Its payout ratio (~32% consolidated) is a shade below Sun Pharma's ~34%, leaving room for the payout to rise if management chooses.
Promoter Impact Analysis
Promoter Holding (at record date)
~51.77%
Fosun Pharma Industrial Pte (June 2026 pattern)
Estimated Promoter Dividend Income
~₹170.6 Cr
~51.77% of the ₹329.5 Cr total outflow
Gland Pharma's promoter is China's Fosun Pharma (Shanghai Fosun Pharmaceutical, via Fosun Pharma Industrial Pte), which acquired control in 2017. As of the June 2026 shareholding pattern, promoters held ~51.77%, with DIIs at ~30.44%, FIIs ~8.74% and public/retail ~9.05% (Angel One). Based on the record-date holding, the promoter's share of this dividend is roughly ₹170.6 Cr, with the remaining ~₹159 Cr flowing to institutional and minority shareholders.
An important post-record-date development. On 4 September 2026, Fosun Pharma sold roughly 6% of Gland Pharma (~98.97 lakh shares) for about ₹2,800 Cr via block deals, reducing its stake to approximately 45.77% — below the 50% majority mark (per market-data reports; formal filing awaited). The buyers were domestic mutual funds (Kotak, Axis, ICICI Prudential). This is a promoter monetisation / ownership-distribution event, not a change-of-control transaction, but the continuing sell-down is an overhang worth noting. Because the sale happened after the 11 August record date, it does not change eligibility for this dividend.
Taxation Analysis
Since the abolition of the Dividend Distribution Tax in 2020, dividends are taxable in the hands of the investor at their applicable income-tax slab rate. Key rules:
• The full dividend is added to your "Income from Other Sources" and taxed at your slab.
• The company deducts TDS at 10% under Section 194 if your total dividend from that company in the financial year exceeds the threshold (raised to ₹10,000 from FY2025-26). This TDS is adjustable against your final tax liability.
• For non-resident investors, TDS is generally 20% (plus surcharge/cess), subject to treaty relief.
Worked example — an investor holding 1,000 shares receiving ₹10 per share, in the 30% tax slab:
| Gross dividend (1,000 × ₹10) | ₹10,000 |
| TDS deducted at source @10% | ₹1,000 |
| Total tax @30% + 4% cess (31.2%) | ₹3,120 |
| Net dividend in hand (after full tax) | ₹6,880 |
So a headline ~1% gross yield becomes an effective post-tax yield of roughly 0.69% for a 30%-slab investor. For someone in the 0% or 5% slab, the after-tax yield is far closer to the gross figure. For the actual Gland payout of ₹20/share, a holder of 100 shares would receive ₹2,000 gross — below the TDS threshold, so no TDS — but the amount is still taxable at slab when filing returns.
Key Risks
1. US market concentration
The US contributes ~53% of group revenue. Any USFDA import alert, warning letter, or pricing pressure could hit revenue and margins sharply.
2. Cenexi remains a drag
The European subsidiary was still near-breakeven/loss-making in FY26 (EBITDA ~−₹34 Cr). The turnaround is progressing but not yet complete, and it dilutes group ROE.
3. Promoter stake overhang
Fosun has cut its holding to ~45.77% (Sep 2026) and has sold repeatedly. Further supply could weigh on the stock; sub-50% ownership changes control optics.
4. Working capital / receivables
FY26 receivables grew ~24.7% vs revenue +14.5%. If credit to customers keeps rising, it can strain cash generation.
5. Currency exposure
As a heavy exporter, INR/USD/EUR swings materially affect earnings. Forex translation was a ~₹421 Cr line in OCI for FY26.
6. Modest capital efficiency
A ~9.3% three-year ROE and a large idle cash balance mean returns are below peers; capital allocation choices will shape future value.
What To Monitor
1. Cenexi turnaround
Watch whether Cenexi's EBITDA margin turns sustainably positive — the single biggest swing factor for group ROE and future dividend growth.
2. CDMO ramp-up
CDMO is ~46% of group revenue. Track commercialisation of the new Nano Drug Delivery contract and the 15 co-development products (targeted from FY28).
3. US pipeline & approvals
51 ANDAs are pending. Follow complex injectables, GLP-1/insulin (Liraglutide) and RTU bags (~$634M opportunity).
4. Cash conversion cycle
Confirm the Q1 FY27 improvement in receivable days (from ~161 to ~94) sustains rather than reversing.
5. Promoter actions
Watch for further Fosun sell-downs or any change-of-control signals in upcoming shareholding filings.
6. Capital allocation & payout policy
With ~₹3,116 Cr net cash, watch whether management raises the payout, considers a buyback, or deploys cash into capex/acquisitions.
Conclusion
Gland Pharma's ₹20 final dividend for FY26 lands on the back of a strong year — revenue up 14.5%, net profit up ~47%, margins expanding, and a balance sheet carrying ~₹3,116 Cr of net cash. On every affordability test — earnings coverage (~3.1x), FCF coverage (~1.6x) and cash coverage (~10x) — the payout is comfortably, even conservatively, funded out of current cash generation.
Positives
Debt-free, cash-rich balance sheet; strong operating leverage; recovering earnings; sustainable and well-covered dividend; CDMO momentum; clean audit opinion.
Negatives / Watch-outs
Low absolute yield; modest ROE; Cenexi still loss-making; heavy US dependence; rising receivables; continuing Fosun stake sell-down.
The honest framing: Gland is a growth stock that also pays a modest, earnings-linked dividend — not an income stock. The dividend is safe; the more interesting questions are about growth (Cenexi, CDMO, US launches) and capital allocation (what it does with all that cash). We present the facts and let you weigh them against your own goals.
Frequently Asked Questions
What dividend has Gland Pharma announced for FY26?
What is the Gland Pharma dividend yield?
What is the record date for the Gland Pharma dividend?
What is the ex-date for the Gland Pharma dividend?
When will the Gland Pharma dividend be paid?
Who is eligible for the Gland Pharma dividend?
How is the Gland Pharma dividend taxed?
Is the Gland Pharma dividend sustainable?
What is Gland Pharma's dividend history?
What should investors monitor going forward?
Why does Gland Pharma have such a high 2000% dividend figure?
Does Gland Pharma pay interim dividends?
How much of the dividend goes to the promoter, Fosun Pharma?
Disclaimer
This article is for informational and educational purposes only and does not constitute investment advice, or a buy, sell or hold recommendation. Figures marked as computed are derived from Gland Pharma's audited FY26 results; market prices, shareholding and peer data are drawn from public sources (NSE/BSE, company filings, Screener, TipRanks, IndMoney, Angel One and news reports) as of early September 2026 and may have changed. ShareBazaar Online is not a SEBI-registered investment adviser. Investors should verify all figures independently and consult a qualified financial adviser before making any investment decision. Investments in securities are subject to market risks.