
Dividend Snapshot
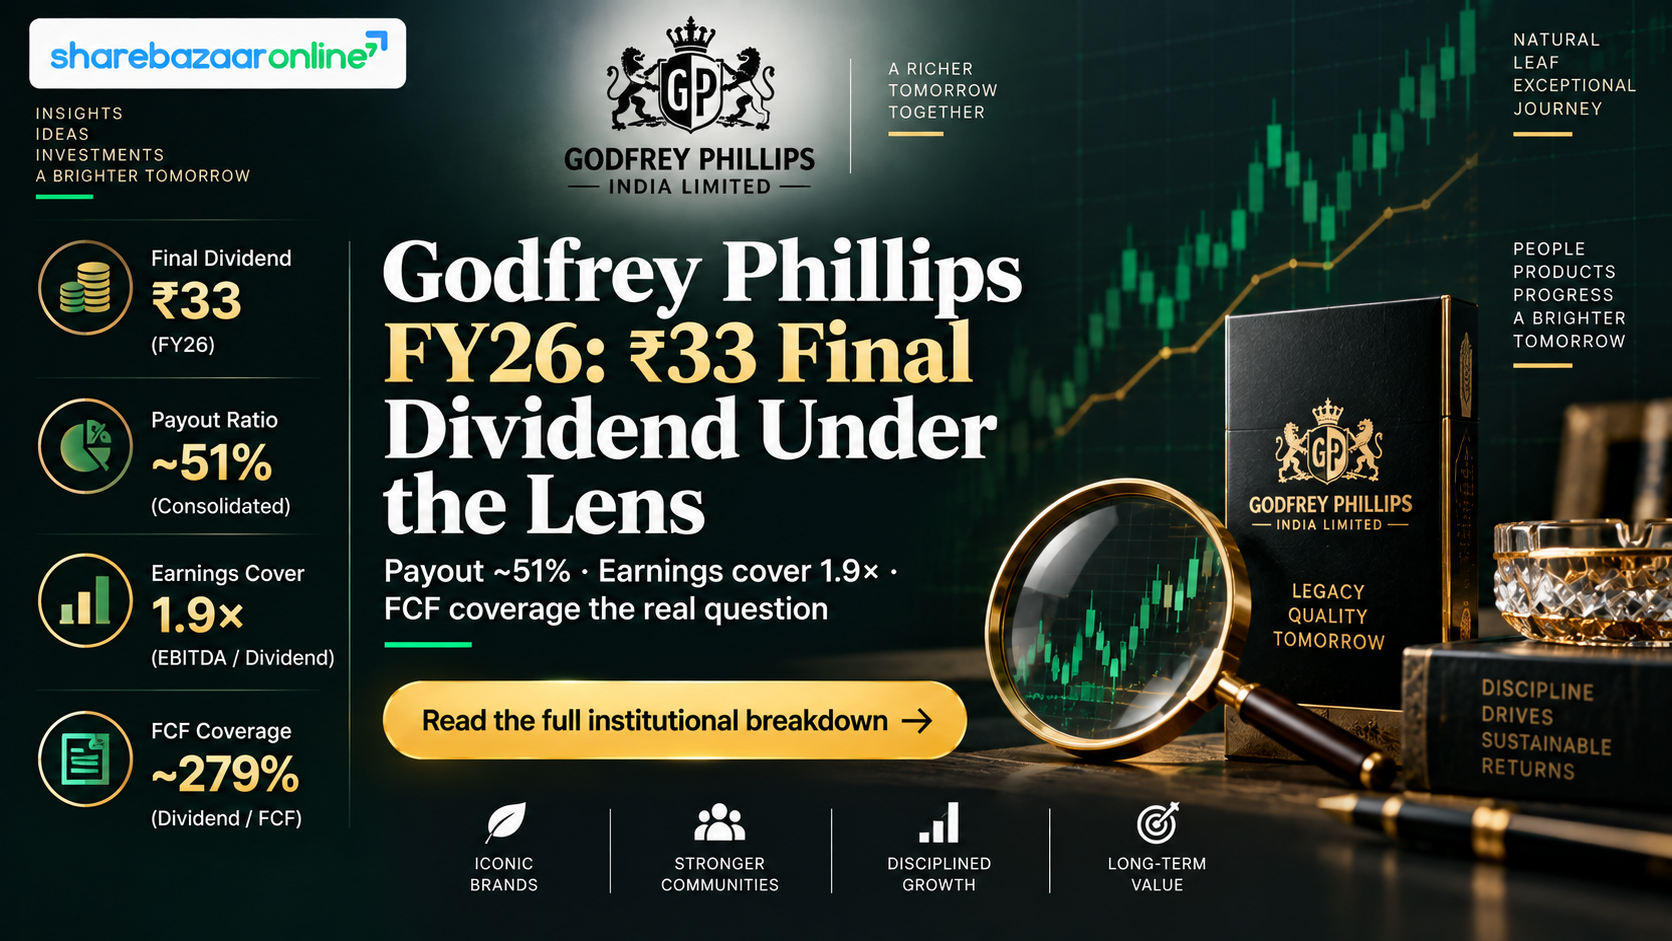
Godfrey Phillips India Ltd (NSE: GODFRYPHLP | BSE: 500163 | ISIN: INE260B01028) has recommended a Final Dividend of ₹33 per equity share (1650% of the ₹2 face value) for the financial year 2025-26. This is the second payout of the year — an interim dividend of ₹17 was already paid — taking the total FY26 dividend to ₹50 per share. The Godfrey Phillips dividend 2026 is subject to shareholder approval at the AGM.
Final Dividend Per Share
₹33.00
1650% on face value of ₹2
Total FY26 Dividend
₹50.00
₹17 interim + ₹33 final
Final Dividend Yield (at CMP ~₹2,033)
~1.62%
Total FY26 yield ~2.46%
Record Date & Ex-Date
11 Aug 2026
AGM: 24 Aug 2026
Sector: FMCG – Cigarettes & Tobacco. Group: KK Modi Group (Modi Enterprises). Godfrey Phillips owns brands such as Four Square, Red & White, Cavanders and Stellar, and distributes Marlboro in India through an associate. Domestic cigarette market share is estimated at ~14% (Screener).
Dividend Announcement Summary
At its board meeting on 15 May 2026, the Board of Godfrey Phillips India approved the audited standalone and consolidated results for the quarter and year ended 31 March 2026 and recommended a final dividend of ₹33 per share. As per the company filing, the final dividend — once declared at the AGM — will be paid within 30 days from the date of the AGM. The statutory auditors, S.R. Batliboi & Co. LLP, issued an unmodified (clean) opinion on the results.
Board Recommendation
Final dividend of ₹33 per equity share of ₹2 each for FY2025-26, subject to AGM approval.
AGM Approval Requirement
Yes — the final dividend requires approval of shareholders at the 89th AGM scheduled for 24 August 2026. The interim ₹17 dividend was already declared (3 Nov 2025) and paid.
Management & Board Context
The results were signed off on behalf of the Board by Dr Bina Modi, Chairperson & Managing Director. The combined FY26 payout of ₹50 comes on the back of a strong reported profit year, and management has flagged that FY26 numbers are not directly comparable with the prior year because the indirect tax structure on cigarettes changed with effect from 1 February 2026 (compensation cess cut to Nil, with GST and excise duty raised).
Key Dates Timeline
| Event | Date | Notes |
|---|---|---|
| Announcement Date | 15 May 2026 | Board recommended final dividend |
| Ex-Date | 11 Aug 2026 | Buy before this date to qualify |
| Record Date | 11 Aug 2026 | Eligibility cut-off |
| AGM | 24 Aug 2026 | Shareholders approve final dividend |
| Payment Date | Within 30 days of AGM (est. ~09 Sep 2026) | Per company filing; exact date intimated by company |
Note: The record date and ex-date are the same because equity settles on a T+1 basis. To be eligible for the ₹33 final dividend, investors needed to hold shares as of the end of 11 August 2026.
Dividend Yield Analysis
Dividend yield tells you how much cash return a dividend gives relative to the share price. Because Godfrey Phillips’ stock has fallen sharply over the past year, the yield looks higher today than it did on the announcement date.
Yield on Announcement Date
NSE close on 15 May 2026 was ₹2,424.90. Final dividend yield = ₹33 ÷ ₹2,424.90 = 1.36%. Total FY26 (₹50) yield at that price = 2.06%.
Yield at Current Price
At CMP ~₹2,033 (7 Sep 2026), final dividend yield = ₹33 ÷ ₹2,033 = 1.62%. Total FY26 yield = ₹50 ÷ ₹2,033 = 2.46%.
Yield Reality Check
The rise in yield from ~2.06% to ~2.46% is not because the dividend grew after announcement — it is because the share price fell ~16% between mid-May and September 2026. Over the past year the stock is down roughly 41% (52-week range ₹1,832 – ₹3,947) (source). A higher yield driven by a falling price is a warning to look at business fundamentals, not just the headline yield.
Dividend History Analysis
Godfrey Phillips has paid a dividend every year for close to two decades (source), which places it firmly in the Consistent Payer category. However, comparing per-share amounts across years needs care: in September 2025 the company issued 2:1 bonus shares (two new shares for every one held), tripling the share count. So a ₹50 dividend in FY26 sits on roughly 3× the shares of earlier years and is not a like-for-like comparison with older per-share figures.
Indicative Annual Dividend (per share, ₹2 face value)
| Financial Year | Dividend / Share | Share Base |
|---|---|---|
| FY2025-26 | ₹50 (₹17 interim + ₹33 final) | Post 2:1 bonus (15.6 cr shares) |
| FY2024-25 | ~₹112 total (source) | Pre-bonus (~5.2 cr shares) |
| Earlier years | Regular annual payer since ~2007 | Pre-bonus |
Per-share figures before Sept 2025 are on a pre-bonus base and are not directly comparable. On a bonus-adjusted basis the FY26 ₹50 payout represents strong growth. Investors should verify exact historical figures on the company’s investor page or NSE/BSE filings.
Classification: Consistent Payer
No dividend suspensions in recent history, an unbroken payout record, and a rising bonus-adjusted trend. The company splits its annual payout into interim and final tranches. There is no evidence of a dividend cut — the FY26 total sits comfortably below FY26 earnings.
Financial Performance Analysis
All figures below are for the year ended 31 March 2026 (audited). We lead with consolidated numbers and note standalone where relevant. Amounts are converted to ₹ Crore (1 lakh = 0.01 crore).
Consolidated FY26
- Revenue from operations: ₹9,120.94 cr (FY25: ₹6,767.49 cr)
- Profit before tax (continuing): ₹1,939.86 cr
- Net profit (total): ₹1,526.02 cr (FY25: ₹1,072.31 cr)
- EPS (total): ₹97.84
- Reserves: ₹6,181.24 cr | Total equity: ₹6,219.08 cr
Standalone FY26
- Revenue from operations: ₹9,119.02 cr
- Profit before tax (continuing): ₹1,920.48 cr
- Net profit (total): ₹1,507.48 cr
- EPS (total): ₹96.64
- Reserves: ₹5,331.42 cr | Total equity: ₹5,362.62 cr
Operating Leverage — read with caution
Consolidated revenue grew ~34.8% and net profit ~42.3%, which looks like powerful operating leverage. But a large part of the headline revenue jump is optical: excise duty flowing through revenue rose from ₹1,156.47 cr to ₹2,729.83 cr after the 1 Feb 2026 indirect-tax change. Stripping out excise, underlying net revenue growth was closer to ~14% — consistent with the company’s Q4 net-of-excise growth of 13.6% (source). Reported Q4 EBITDA margin expanded from 17.1% to 30.9%, but management itself states FY26 is not comparable with prior periods due to the tax restructuring. Treat the margin jump as partly a change in accounting optics, not purely operating gains.
Cash Flow Analysis
Reported profit is an accounting opinion; cash is fact. This is where Godfrey Phillips’ dividend story gets interesting — and where most reporting sites stop.
Operating Cash Flow vs Net Profit (Consolidated)
Net profit was ₹1,526.02 cr but operating cash flow was only ₹518.16 cr — roughly one-third of profit. Two reasons: (1) a large share of profit is investment/treasury income (dividend income ₹259.17 cr and investment gains), which is not operating cash; and (2) a heavy working-capital drag.
Receivables vs Revenue
Trade receivables rose ~₹513 cr and inventories ~₹523 cr during the year, and debtor days lengthened from 33.7 to 51.8 days (Screener). Rising receivables faster than a normalised revenue base is a cash-quality flag worth monitoring.
Free Cash Flow & How the Dividend Is Funded
Consolidated free cash flow (OCF ₹518.16 cr − capex ₹312.19 cr) was about ₹205.97 cr. Cash dividend paid during FY26 was ₹575.25 cr — i.e., the payout consumed roughly 279% of free cash flow (Groww flags the same). The gap was bridged not by operating FCF but by the company’s large investment portfolio and recurring investment/associate income. In short, this year’s dividend is funded by a mix of current earnings + treasury income, not by operating free cash flow alone.
Balance Sheet Strength
Investments & Cash (Standalone)
- Non-current investments: ₹1,911.26 cr
- Current investments: ₹565.77 cr
- Total investment book: ~₹2,477 cr
- Cash & bank: ~₹15.2 cr (operating cash held lean)
Debt Position
- Current borrowings: ~₹93.08 cr (incl. overdraft)
- Lease liabilities: ~₹138.96 cr total
- Effectively debt-free / net cash (Screener)
- Book value ~₹398/share; ROE 23.4%, ROCE 30.2%
Cash Coverage of the Dividend
The ~₹2,477 cr investment book covers the ₹514.80 cr final-dividend outflow about 4.8×, and the full ₹780 cr annual outflow about 3.2×. So while operating FCF is thin, the balance sheet can comfortably fund the dividend. The sustainability question is therefore less about affordability and more about where the cash comes from (treasury drawdown vs core operations).
Dividend Sustainability Analysis
Payout Ratio
Total FY26 dividend outflow ₹780 cr ÷ consolidated PAT ₹1,526.02 cr = ~51.1% (standalone basis ~51.7%). Screener reports a trailing payout of ~43.4%. Either way, roughly half of profit is retained — a healthy, non-stretched ratio.
Dividend Coverage Ratio
EPS ₹96.64 ÷ total DPS ₹50 = 1.93× cover (final ₹33 alone is covered ~2.9×). Earnings comfortably cover the dividend on an accrual basis.
Verdict: Moderately Sustainable
Earnings cover (1.93×) and a debt-free balance sheet with a ₹2,477 cr treasury support the payout. The caveat is cash quality: the dividend outstrips free cash flow (paid at ~279% of FCF) and leans on investment income and working-capital-heavy operations. If receivables/inventory stay elevated and the post-Feb-2026 higher-tax regime pressures cigarette volumes, the buffer between reported earnings and distributable cash could narrow. Sustainable for now, but dependent on treasury income and volume resilience — hence Moderately Sustainable rather than Fully Sustainable.
Peer Comparison
| Metric | Godfrey Phillips | ITC Ltd | VST Industries |
|---|---|---|---|
| Dividend Yield | ~2.4% | ~5.3% | ~3.9% |
| Payout Ratio | ~51% (FY26) | ~74% | ~58% |
| ROE | ~23.4% | ~35% (3yr) | High |
| Debt | Net cash | Debt-free | Debt-free |
Peer figures sourced from Screener, INDmoney, TipRanks and SimplyWall.st (Sept 2026) and are approximate. GPI trades at a lower yield and payout than ITC and VST, and reinvests more of its earnings.
Among listed pure-play cigarette peers, ITC is the highest-yielding (~5.3%) with the biggest payout (~74%+), reflecting its mature, cash-generative model. VST Industries pays out ~58% at ~3.9% yield. Godfrey Phillips is the lowest-yielding of the three today (~2.4%), consistent with it retaining more capital and its higher recent growth profile.
Promoter Impact Analysis
Shareholding Pattern
- Promoter (KK Modi Group): 72.58%
- FII: ~7.8–9.3%
- DII: ~3.7%
- Public / retail: ~14–16%
Source: Angel One / Dhan / Trendlyne (Jun 2026 quarter).
Promoter Dividend Income
At 72.58% holding, promoters receive an estimated ₹373.6 cr from the ₹33 final dividend, and ~₹566 cr from the full ₹50 FY26 payout. Total company dividend outflow: final ₹514.80 cr; full-year ₹780 cr (on 15.6 cr shares).
Distribution impact: Because promoters own nearly three-quarters of the company, the bulk of the dividend flows to the promoter group. Minority (public) shareholders collectively receive roughly ₹110–125 cr of the ₹780 cr. This is normal for a promoter-heavy company — but it means dividend policy is effectively set by, and primarily benefits, the controlling family. A high dividend is a legitimate way for cash-rich promoters to extract returns without diluting control.
Taxation Analysis
How Dividends Are Taxed in India
Since the abolition of Dividend Distribution Tax (April 2020), dividends are taxable in the hands of the investor at their applicable income-tax slab rate, under “Income from Other Sources.” The company deducts TDS at 10% under Section 194 if total dividend paid to a resident shareholder in a financial year exceeds ₹10,000 (threshold raised from ₹5,000 in Budget 2025). No PAN → 20% TDS. NRIs face 20% TDS (plus surcharge/cess), subject to DTAA relief on submitting TRC and Form 10F.
Worked Example (30% slab)
- Holding: 1,000 shares, dividend ₹10/share
- Gross dividend: ₹10,000
- Tax @30% + 4% cess (31.2%): ₹3,120
- Net dividend in hand: ₹6,880
- Effective post-tax yield vs gross: 68.8% of the dividend retained
At exactly ₹10,000, TDS is not triggered (threshold is “exceeds ₹10,000”), but the ₹3,120 tax is still payable via the investor’s own return.
GPI-Specific Illustration
- Hold 100 GPI shares → final ₹33 = ₹3,300 gross (below ₹10,000, no TDS)
- At 30% slab: tax ₹1,030 → net ₹2,270
- Full FY26 (₹50): ₹5,000 gross → net ₹3,440 at 30% slab
- To cross the ₹10,000 TDS threshold on the ₹33 final, you’d need >~303 shares
Key Risks
- Higher tax regime on cigarettes: From 1 Feb 2026 the indirect-tax structure changed (compensation cess to Nil, GST + excise raised). Higher taxes can pressure volumes and squeeze the core cigarette business.
- Dividend outruns free cash flow: FY26 dividend consumed ~279% of free cash flow, relying on treasury/investment income; a weak treasury year could strain the payout.
- Rising working capital: Debtor days jumped from 33.7 to 51.8 and both receivables and inventory rose sharply, weakening cash conversion.
- Regulatory & ESG overhang: Tobacco faces persistent regulatory, taxation and litigation risk; the stock is down ~41% over the past year partly on tax fears.
- Fire/insurance claim: An Oct 2025 fire at a third-party tobacco processing plant (Prakasam, AP) led to an insurance claim of ~₹284 cr, still pending final assessment — a recovery shortfall would hit profits.
- Promoter concentration & governance: 72.58% promoter holding concentrates dividend benefit and decision-making; past executive-level legal matters have periodically weighed on sentiment.
What To Monitor
- Cigarette volume trend in FY27 under the higher-tax regime — the real test of pricing power vs demand.
- Operating cash flow conversion — whether OCF moves closer to reported PAT as working capital normalises.
- Debtor days & inventory days — a reversal back toward ~35 days would restore cash quality.
- Investment/associate income (dividend from the Marlboro-distribution associate) — a key cash source that funds the dividend.
- Payout ratio trajectory — whether management sustains ~50% or raises it, and how FCF coverage evolves.
- Resolution of the insurance claim and any further regulatory/GST changes on tobacco.
Conclusion
Godfrey Phillips India’s ₹33 final dividend (total FY26 ₹50) caps a year of strong reported growth — consolidated profit up ~42% to ₹1,526 cr — backed by a debt-free balance sheet and a ~₹2,477 cr investment book. Earnings cover the dividend ~1.9× and the payout ratio (~51%) is comfortable.
Positives
- Consistent 19-year+ dividend record; strong bonus-adjusted growth
- Debt-free with a large treasury cushion
- Comfortable earnings cover (1.9×) and ~51% payout
- High ROE (23.4%) and ROCE (30.2%)
Negatives / Watch-outs
- Dividend paid at ~279% of free cash flow
- Weak OCF-to-PAT conversion; rising debtor/inventory days
- Revenue growth optically inflated by excise reclassification
- Higher-tax regime and regulatory overhang on tobacco
The dividend is well-supported on an earnings and balance-sheet basis but leans on treasury income rather than operating free cash flow — classified here as Moderately Sustainable. The decision on whether the yield (~2.4%) compensates for tobacco-sector risk is left to the reader.
Frequently Asked Questions
What dividend has Godfrey Phillips India announced for FY2025-26?
What is the Godfrey Phillips dividend yield?
What is the record date for the Godfrey Phillips final dividend?
What is the ex-dividend date?
When will the final dividend be paid?
Who is eligible for the Godfrey Phillips dividend?
How is the Godfrey Phillips dividend taxed?
Is the Godfrey Phillips dividend sustainable?
What is Godfrey Phillips’ dividend history?
What should investors monitor going forward?
How much dividend outflow is Godfrey Phillips paying?
Why has the dividend yield risen even though the dividend was fixed?
How does Godfrey Phillips’ dividend compare with ITC and VST Industries?
Disclaimer
This article is for informational and educational purposes only and does not constitute investment, legal or tax advice, nor a buy/sell/hold recommendation. Dividend figures, dates and financials are based on the company’s board-meeting filing dated 15 May 2026 and publicly available data as of September 2026; market prices and external figures are sourced from third-party portals and may change. ShareBazaar Online is not a SEBI-registered investment adviser. Investing in equities carries risk, including loss of capital. Please verify all data with official NSE/BSE filings and the company’s investor relations page, and consult a qualified financial/tax professional before making any investment decision.