
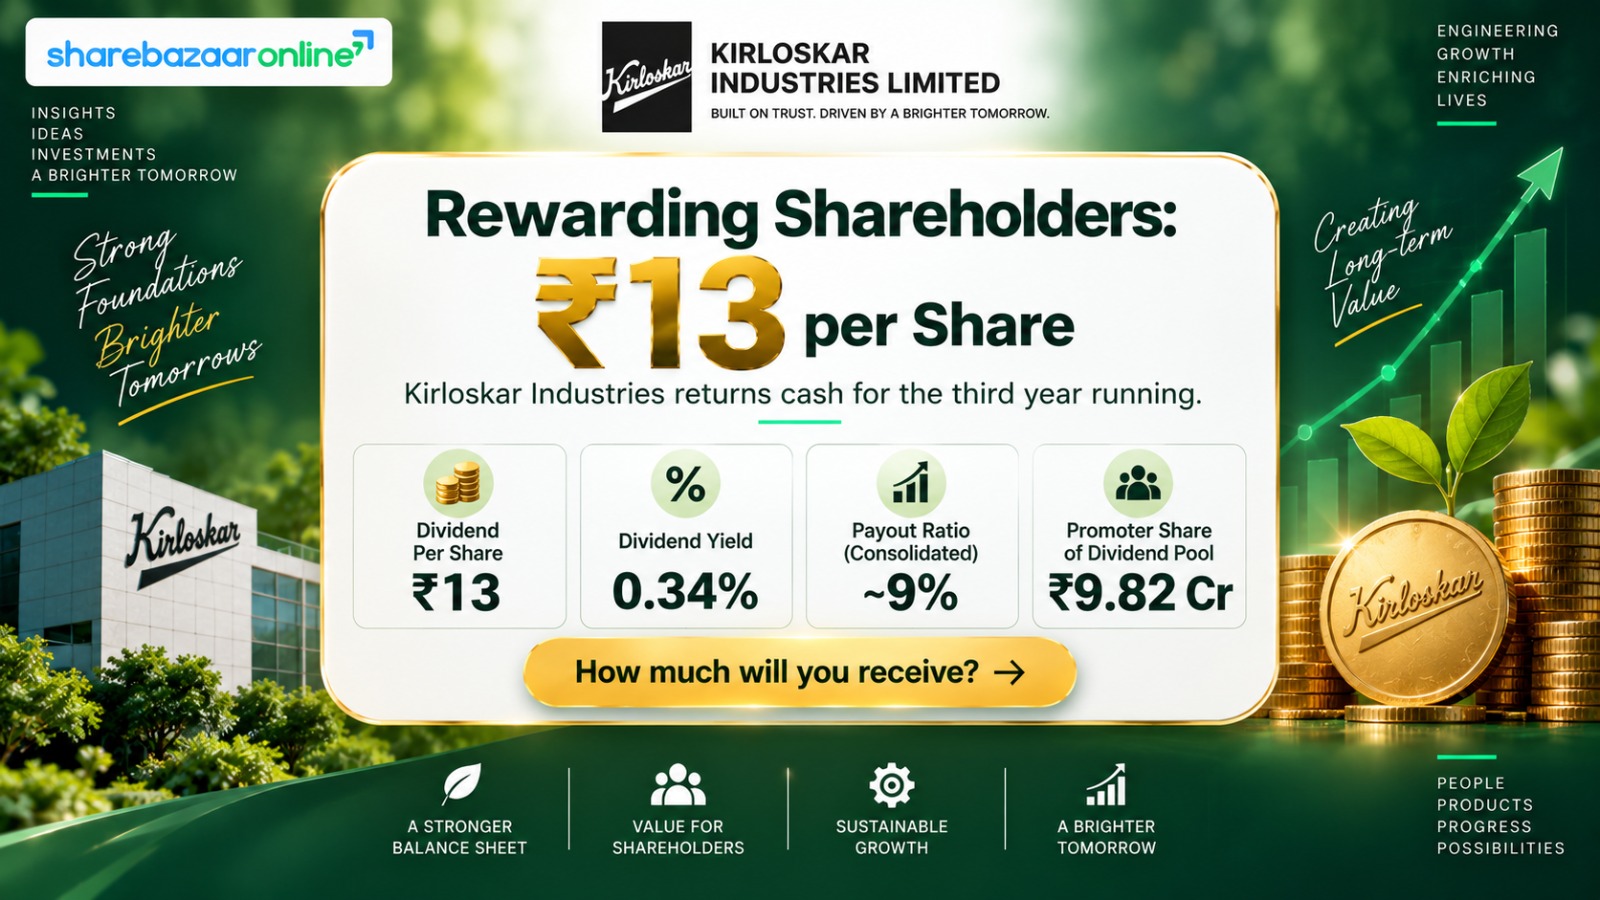
Dividend Snapshot
Kirloskar Industries Limited (NSE: KIRLOSIND | BSE: 500243 | ISIN: INE250A01039) has declared a final dividend of ₹13 per equity share for FY 2025-26 — a payout of 130% on the face value of ₹10. Here is the analysed snapshot at a glance.
Dividend Type
Final Dividend
Dividend Per Share
₹13 (130% of ₹10 FV)
Financial Year
FY 2025-26
Dividend Yield (latest)
~0.34%
Total Dividend Outflow
₹13.66 Crore
Payout Ratio (Standalone / Consolidated)
17.7% / 8.6%
Dividend Coverage (Standalone EPS)
5.7x
Sustainability Verdict
Sustainable
Latest market price ~₹3,804 (NSE close, 5 Aug 2026 — latest available reference). Prices move daily; verify before acting.
Dividend Announcement Summary
The Board of Directors of Kirloskar Industries, at its meeting held on 19 May 2026, recommended a final dividend of ₹13 (130%) per equity share of ₹10 each for the financial year 2025-26. The recommendation was placed for approval of members at the Annual General Meeting, and shareholders duly approved it at the 32nd AGM held on 18 August 2026.
The dividend is being paid through the National Electronic Clearing System (NECS) and, per the company's disclosure, within 30 days of declaration at the AGM. On the same day, the Board also re-appointed statutory auditors Kirtane & Pandit LLP for a second five-year term. It is important for readers to understand what Kirloskar Industries actually is: it is a Kirloskar Group holding company. Its own (standalone) income is largely dividend income and interest income received from group companies, while its operating scale comes from subsidiaries — chiefly Kirloskar Ferrous Industries Limited (KFIL) in iron casting, tubes and steel, and Avante Spaces Limited in real estate. This structure shapes almost every number in this analysis.
Board Meeting / Announcement Date
19 May 2026
AGM Approval
Approved at AGM on 18 Aug 2026
Payment Mode
NECS / electronic credit
Shares Outstanding
1,05,09,372 equity shares
Key Dates Timeline
These are the dates that decide who is eligible for the Kirloskar Industries dividend and when the money lands. To receive the payout, an investor had to hold shares as on the record date.
Announcement Date
19 May 2026
Record Date
11 August 2026
Ex-Dividend Date
On/around 11 August 2026
AGM Date
18 August 2026
Payment Date
On/before 17 September 2026
Eligibility Rule
Hold shares as on record date
Record and payment dates were fixed after the Board recommendation; the announcement filing itself did not carry these. Under India's T+1 settlement, the ex-date typically coincides with the record date.
Dividend Yield Analysis
Dividend yield tells you how much cash return the dividend gives against the share price. It is calculated as dividend per share divided by market price. At a recent price of about ₹3,804, the ₹13 dividend works out to a yield of roughly 0.34% (₹13 ÷ ₹3,804 × 100). Around the announcement period in May 2026 the stock traded near ₹3,750 (approximate), giving a similar announcement-date yield of about 0.35%.
The reality check: a 0.34% yield looks low, and it is — well below the broader industrials/financials sector average of roughly 1.2%. But this is not a sign of a weak dividend. Kirloskar Industries is an investment holding company whose share price largely reflects the market value of the group stakes it owns (its book value per share is far above the price it usually trades at). So the low yield is a function of a high asset-backed share price, not a stingy payout. Investors here are buying an underlying portfolio at a holding-company discount; the dividend is a modest cash top-up on that.
Yield at ~₹3,804
~0.34%
Announcement-date yield (approx)
~0.35%
Sector average yield (approx)
~1.2%
Why yield is low
Asset-backed price, holding-co discount
Dividend History Analysis
Kirloskar Industries has a long dividend record, but it is not a straight line. The table below shows the per-share dividend by financial year (face value ₹10).
| Financial Year | Dividend Per Share | On FV ₹10 |
|---|---|---|
| FY2025-26 | ₹13.00 | 130% |
| FY2024-25 | ₹13.00 | 130% |
| FY2023-24 | ₹13.00 | 130% |
| FY2022-23 | ₹11.00 | 110% |
| FY2021-22 | ₹10.00 | 100% |
| FY2020-21 | ₹10.00 | 100% |
| FY2019-20 | ₹10.00 | 100% |
| FY2018-19 | ₹21.00 | 210% |
| FY2017-18 | ₹21.00 | 210% |
| FY2016-17 | ₹20.00 | 200% |
The good
The dividend has been held steady at ₹13 for three straight years (FY24, FY25, FY26) and has stepped up gradually from ₹10 in FY20 to ₹13 now — a recovering, rising trend.
The caution
There was a sharp cut in FY20, when the payout dropped from ₹21 to ₹10 (roughly a 52% reduction). Companies that have cut once can cut again if group cash flows weaken.
Classification: a Consistent Payer since FY2020, with a clear step-up trend, but carrying a historical dividend cut on its record. It is not a "never-cut" compounder.
Financial Performance Analysis
Because Kirloskar Industries is a holding company, the consolidated numbers (which include KFIL and Avante) show the real operating engine, while the standalone numbers show only the parent's own investment-income profile. Both matter, so both are shown.
Consolidated (FY26 vs FY25)
Revenue from operations: ₹6,938.74 Cr vs ₹6,608.06 Cr — up ~5.0%.
Profit before exceptional items & tax: ₹528.28 Cr vs ₹433.99 Cr — up ~21.7%.
Total net profit: ₹353.77 Cr vs ₹308.22 Cr — up ~14.8%.
Profit attributable to owners: ₹158.92 Cr vs ₹149.09 Cr — up ~6.6%.
Standalone (FY26 vs FY25)
Total income: ₹127.00 Cr vs ₹120.57 Cr — up ~5.3%.
Net profit: ₹77.01 Cr vs ₹78.32 Cr — down ~1.7%.
Standalone EPS (basic, total): ₹73.61.
Driven mainly by dividend income of ₹66.71 Cr and interest income of ₹32.07 Cr from group companies.
Operating leverage (consolidated): this is the encouraging part. Revenue grew about 5%, but profit before exceptional items and tax grew about 22% — profits rose much faster than sales. That points to margin expansion in the operating businesses. The strongest pull came from the Tube segment, whose segment profit jumped to ₹181.16 Cr from ₹119.21 Cr (+52%), and Iron Casting, up to ₹397.10 Cr from ₹348.85 Cr (+14%). The Steel segment was roughly flat (₹57.20 Cr vs ₹59.63 Cr) and the small Real Estate segment stayed loss-making (₹-12.16 Cr).
Standalone note: standalone profit dipped slightly year-on-year even though income rose, because employee benefit expense jumped to ₹14.71 Cr from ₹10.00 Cr and other expenses rose. Over five years, the group has still delivered strong compounding — reported revenue growth of about 27% CAGR and EPS growth of roughly 35% per year [source: market data aggregators].
Cash Flow Analysis
This is where a holding company can look scary if you read it the wrong way, so read it carefully. Reported profit is an opinion; cash is a fact — and the two look very different at the standalone level here.
Highlight: standalone operating cash flow is negative
Standalone net cash from operating activities (continuing) was ₹-42.60 Cr, even though standalone profit was ₹77.01 Cr. This looks alarming but is structural: accounting rules strip dividend income (₹66.71 Cr) and interest income (₹32.07 Cr) out of "operating" cash flow and place them under investing activities. So the parent's real cash actually arrives in the investing line, not the operating line.
On the investing side, the standalone entity received ₹66.71 Cr of dividends, plus interest of ₹30.42 Cr from a wholly-owned subsidiary and other interest and licensing income — producing net investing inflow of +₹48.35 Cr. Against this, the company paid out just ₹13.54 Cr in dividends during FY26. In other words, the money Kirloskar Industries hands to shareholders is essentially a pass-through of the far larger dividends it collects from its group companies.
Group dividend coverage (Standalone)
4.9x
Dividends received ₹66.71 Cr ÷ dividend outflow ₹13.66 Cr
Consolidated operating cash flow
₹869.79 Cr
Strong, driven by the operating subsidiaries
How is the dividend funded? Not from borrowings and not from asset sales — it is funded from current group dividend and interest income flowing up to the parent. At the consolidated level, operating cash flow of ₹869.79 Cr comfortably covers the group's total dividend outgo (₹62.51 Cr, which also includes minority payouts at KFIL). Cash is genuinely backing this dividend.
Balance Sheet Strength
The dividend-paying entity (the standalone parent) sits on a very strong, effectively debt-free balance sheet. This is the single biggest reason the dividend is easy to fund.
Standalone cash + bank deposits
₹102.94 Cr
Standalone investment book
₹4,397.67 Cr
Standalone borrowings
Nil (effectively debt-free)
Standalone reserves
₹4,899.77 Cr
Cash coverage of the dividend is about 7.5x (cash + bank ₹102.94 Cr ÷ outflow ₹13.66 Cr) — before even touching the ₹4,398 Cr investment portfolio. At the consolidated level there is gross debt of about ₹1,105 Cr, but that sits inside the operating subsidiary KFIL (a capital-intensive metals business), not at the holding company. Consolidated net worth attributable to owners is ₹6,180.97 Cr, and book value per share (~₹6,545) is well above the market price — a classic holding-company discount.
ROE looks optically low (consolidated ~2.6%, standalone ~1.6%) because equity is inflated by the fair value of quoted group investments carried on the books; precise ROCE was Not Disclosed by Company in this filing.
Dividend Sustainability Analysis
Pulling the threads together — cash position, coverage, debt and earnings — the ₹13 dividend looks well protected.
Can it afford it?
Yes. Outflow of ₹13.66 Cr against ₹102.94 Cr cash+bank, a ₹4,398 Cr investment book, and ₹66.71 Cr of dividends received from the group.
Is it covered by earnings?
Comfortably. Payout ratio is only 17.7% standalone / 8.6% consolidated; coverage is 5.7x on standalone EPS and 11.7x on consolidated EPS.
Is debt rising to fund it?
No. The parent is effectively debt-free. Dividend is funded from group cash flows, not borrowings.
Are earnings growing?
Consolidated PAT grew ~15%; the underlying group is expanding. Standalone dipped slightly on higher staff costs.
Verdict: Sustainable
The main dependency to watch is that this dividend ultimately relies on group companies (especially KFIL, and stakes in Kirloskar Oil Engines / Kirloskar Pneumatic) continuing to pay dividends upstream. If those cyclical businesses cut their payouts, the parent's dividend capacity could tighten over time. For now, coverage and cash leave a wide margin of safety.
Peer Comparison
The most relevant peers are other listed Kirloskar Group entities, since they share the same promoter ecosystem. Yields differ because business models differ — a holding company will always show a lower yield than an operating company.
| Company | FY26 Dividend | Approx Yield | Type |
|---|---|---|---|
| Kirloskar Industries | ₹13 (130%) | ~0.34% | Holding company |
| Kirloskar Pneumatic | ₹8.50 (425%) | ~0.74% | Operating |
| Kirloskar Ferrous (KFIL) | ₹3 (60%) | ~0.5% band | Operating (subsidiary) |
Against the wider industrials/financials universe (sector average yield ~1.2%), Kirloskar Industries screens as a low-yield, high-asset-backing stock. Its payout ratio (~9% consolidated) is also far lower than typical dividend-focused names, which pay out 30-60% of profit. The trade-off: lower cash yield today, but a large retained-earnings and investment base that supports capital appreciation and future dividend growth. Peer figures are indicative and drawn from public market data; verify current numbers before comparing.
Promoter Impact Analysis
With a promoter holding of about 71.86% (FII ~0.5%, DII ~1.86%, public ~25.75%, per the latest shareholding pattern), the bulk of the ₹13.66 Cr dividend flows to the Kirloskar promoter group. Here is how the outflow splits.
Promoter dividend income (~71.86%)
~₹9.82 Cr
Public / retail share (~25.75%)
~₹3.52 Cr
DII share (~1.86%)
~₹0.25 Cr
FII share (~0.5%)
~₹0.07 Cr
What this means for minority shareholders: the dividend is paid uniformly per share, so minority investors receive the same ₹13 per share as promoters. Because promoters own ~72%, they collect the lion's share of the total pool — but there is no structural disadvantage to small holders; everyone is paid on the same terms. A high, stable promoter stake with zero pledging is generally read as an alignment positive.
Taxation Analysis
Since FY2020-21, dividends in India are taxable in the hands of the shareholder at their applicable income-tax slab rate — there is no separate Dividend Distribution Tax anymore. Key rules to know:
Slab-rate taxation
The full dividend is added to your income and taxed at your slab (5% / 20% / 30% plus cess).
TDS on dividend
The company deducts TDS at 10% for resident shareholders if total dividend in the year exceeds the threshold (₹10,000 from FY2025-26; submit Form 15G/15H or PAN to avoid higher rates).
Worked example — 1,000 shares at ₹13/share, 30% slab
Gross dividend = 1,000 × ₹13 = ₹13,000.
TDS at 10% (dividend exceeds ₹10,000) = ₹1,300 deducted at source.
Final tax at 30% + 4% cess = 31.2% = ₹4,056.
Net dividend in hand after full tax = ₹13,000 − ₹4,056 = ₹8,944.
On a ~₹3,804 share, 1,000 shares cost ~₹38,04,000; the pre-tax yield of ~0.34% becomes an effective post-tax yield of roughly 0.24% for a 30%-slab investor. (A generic illustration on a ₹10 dividend and 30% slab would similarly leave about ₹6.88 net per share.)
Tax rules and thresholds change with each Budget and the new Income-tax Act framework. This is general information, not tax advice — confirm your position with a qualified advisor.
Key Risks
- 1. Group-dividend dependency. The parent's dividend capacity rests on upstream dividends from cyclical group companies (KFIL, and stakes in Kirloskar Oil Engines and Kirloskar Pneumatic). A downturn in metals/engineering could shrink those inflows.
- 2. Commodity cyclicality at KFIL. Iron casting, tubes and steel earnings swing with pig-iron, coke and steel prices. Segment profits can compress quickly if input costs spike.
- 3. Holding-company discount & low ROE. The stock persistently trades below book value (P/B often below 1). Optically low ROE (~2-3%) can weigh on re-rating and keep the dividend yield low.
- 4. Historical dividend cut. The FY20 cut from ₹21 to ₹10 shows the payout is not guaranteed to only rise; it can be reset if group cash flows weaken.
- 5. Concentration & investment-value volatility. A large part of book value is quoted group investments (₹4,398 Cr standalone). Falls in those market prices hit other comprehensive income sharply — FY26 saw a negative fair-value swing of over ₹300 Cr on quoted investments.
- 6. Real estate / new-segment drag. The Avante real-estate segment remained loss-making (₹-12.16 Cr), and execution timelines there add uncertainty.
What To Monitor
- 1. Dividends declared by KFIL, Kirloskar Oil Engines and Kirloskar Pneumatic — the pipes that feed the parent's payout. Rising upstream dividends support future increases.
- 2. KFIL segment margins in iron casting, tubes and steel — watch whether the strong Tube and Casting profit growth sustains into FY27.
- 3. Consolidated operating cash flow — it must stay strong (it was ₹869.79 Cr) to keep funding group-wide dividends comfortably.
- 4. Consolidated debt at KFIL — borrowings of ~₹1,105 Cr sit in the subsidiary; watch whether capex pushes this higher.
- 5. Payout ratio and dividend step-ups — a very low ~9% consolidated payout leaves room to raise the dividend; watch if management chooses to.
- 6. Real-estate (Avante) turnaround — monitor whether the loss-making segment moves toward profitability and unlocks value.
Conclusion
Kirloskar Industries' ₹13 final dividend (130%) for FY2025-26 is a small cash return in yield terms (~0.34%) but a comfortably-funded one. The parent is effectively debt-free, holds ₹102.94 Cr in cash and bank deposits and a ₹4,398 Cr investment book, and collects ₹66.71 Cr of dividends from group companies — nearly five times what it pays out. Payout ratios are low (17.7% standalone, 8.6% consolidated) and coverage is high (5.7x standalone EPS).
The positives: consistent ₹13 payout for three years, a debt-free holding structure, positive operating leverage at the consolidated level (profit up ~22% on ~5% revenue growth), and strong group cash generation. The negatives and watch-items: a low yield versus peers, an optically low ROE and persistent holding-company discount, dependence on cyclical group dividends, a historical FY20 dividend cut, and a loss-making real-estate segment. Both sides are laid out above so you can weigh them against your own goals.
Frequently Asked Questions
What dividend has Kirloskar Industries announced for FY2025-26?
What is the Kirloskar Industries dividend yield?
What is the record date for the Kirloskar Industries dividend?
What is the ex-dividend date?
When will the Kirloskar Industries dividend be paid?
Who is eligible for the dividend?
How is the Kirloskar Industries dividend taxed?
Is the Kirloskar Industries dividend sustainable?
What is the Kirloskar Industries dividend history?
Why is Kirloskar Industries' dividend yield so much lower than its group companies?
Why was standalone operating cash flow negative if the company made a profit?
What should investors monitor going forward?
How much of the dividend goes to promoters?
Disclaimer
This article is prepared by ShareBazaar Online for informational and educational purposes only. It is not investment advice and does not constitute a buy, sell or hold recommendation on Kirloskar Industries Limited or any other security. Figures sourced from the company's own regulatory filing are stated as disclosed; market prices, yields, shareholding, peer data and other externally sourced figures are drawn from public sources and may have changed since publication — the latest reference price used here is ~₹3,804 (NSE, 5 Aug 2026). Financial data can be revised, and past dividends or performance do not guarantee future outcomes. Please verify all figures independently and consult a SEBI-registered financial advisor and a qualified tax professional before making any investment decision. ShareBazaar Online and its authors accept no liability for actions taken based on this content.