
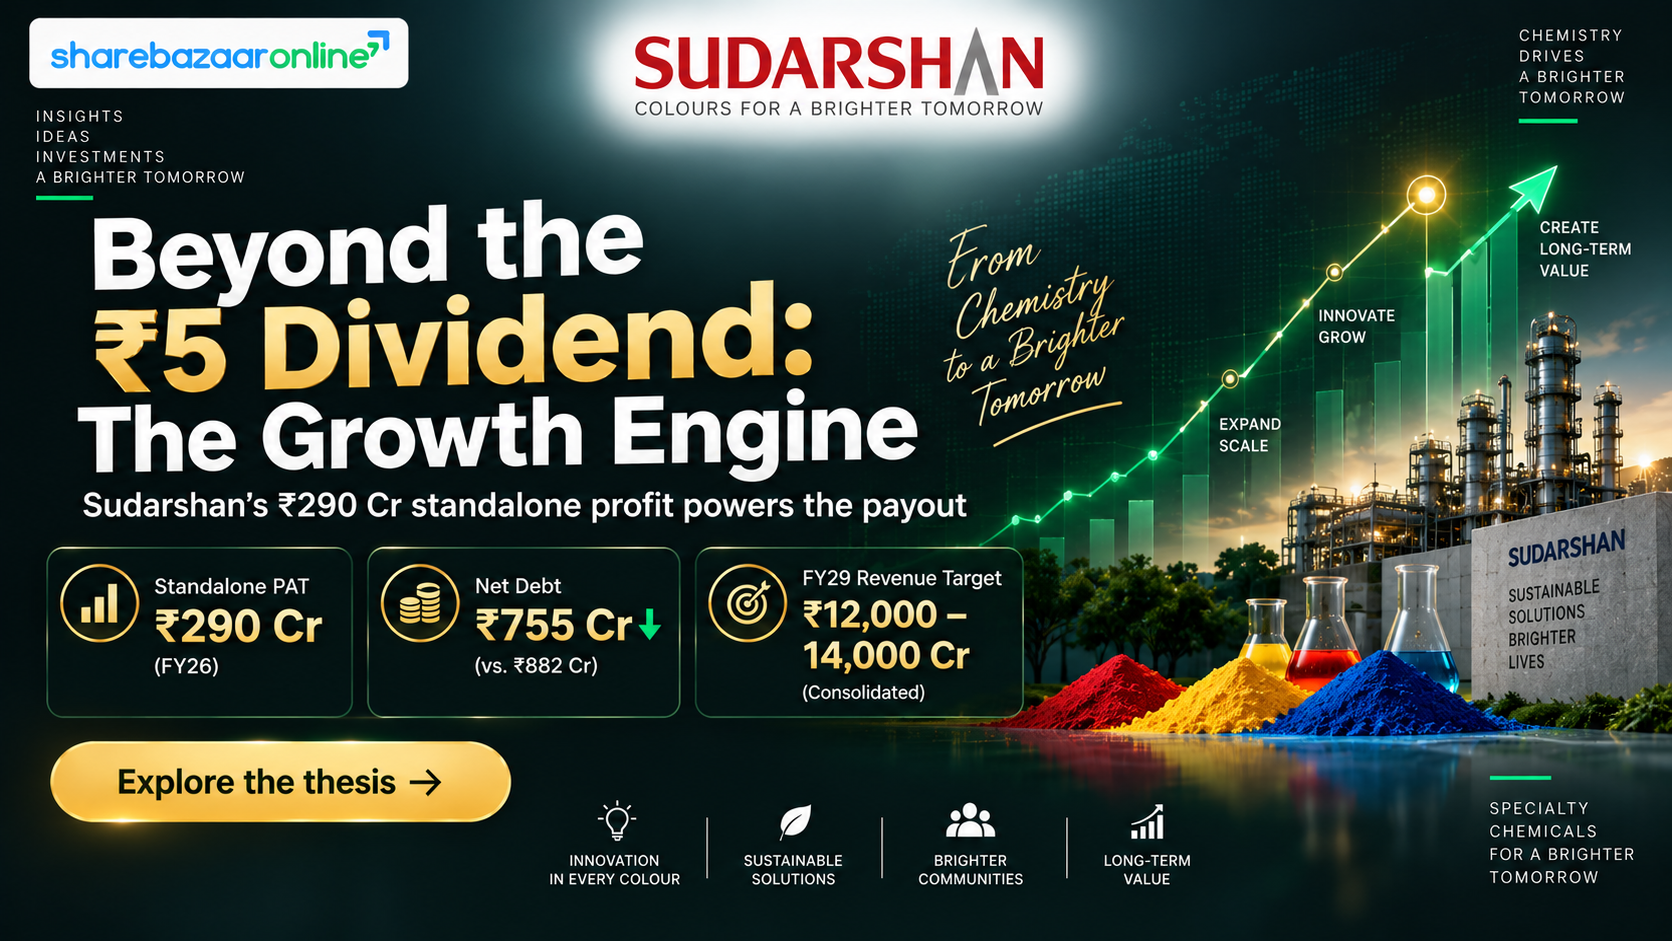
Dividend Snapshot
Sudarshan Chemical Industries Ltd (NSE: SUDARSCHEM | BSE: 506655) has recommended a Final Dividend of ₹5.00 per equity share for the financial year 2025–26, on a face value of ₹2 — a payout of 250%. The Board approved the dividend at its meeting on 25 May 2026 and fixed 11 August 2026 as the record date. Shareholders approved it at the 75th AGM on 18 August 2026.
Dividend Per Share: ₹5.00
Dividend Percentage: 250% (on ₹2 face value)
Dividend Type: Final Dividend
Financial Year: FY 2025–26
Face Value: ₹2 per share
Announcement Date: 25 May 2026
Record Date: 11 August 2026
Ex-Date: 11 August 2026 (as per T+1 exchange convention; the filing specified only the record date)
Payment Date: On or before 8 September 2026
Dividend Yield: ~0.40% (at ~₹1,243 around 7 Sep 2026)
Estimated total dividend outflow: ~₹39.3 crore (7,86,10,087 shares × ₹5). Dividend payout ratio (standalone FY26): ~13.5% of standalone profit; ~96% of consolidated PAT. Share count derived from paid-up capital of ₹15.72 crore (₹2 face value).
Dividend Announcement Summary
At its Board Meeting held on Monday, 25 May 2026, the Board of Directors of Sudarshan Chemical Industries Limited recommended a Final Dividend of ₹5.00 per equity share (250%) of face value ₹2.00 each, for the financial year ended 31 March 2026. The recommendation was subject to shareholder approval at the 75th Annual General Meeting, which was held on 18 August 2026, where the resolution passed with over 99% support.
Board recommendations at the same meeting: The Board also approved the audited standalone and consolidated results (unmodified opinion), appointed PwC Services LLP as Internal Auditor for FY2026–27, and noted that the dividend would be paid within 30 days of AGM declaration.
What stands out: The ₹5 dividend is a marginal increase from ₹4.50 in FY2024-25. Notably, the promoter group holds only 8.19%, so the vast majority of the payout flows to public and institutional shareholders rather than promoters — an unusual ownership structure for an Indian mid-cap.
Key Dates Timeline
Board Meeting / Announcement: 25 May 2026 (Monday)
Ex-Dividend Date: 11 August 2026
Record Date: 11 August 2026 (Tuesday)
75th AGM (Approval): 18 August 2026
Payment Date: On or before 8 September 2026 (within 30 days of AGM declaration)
Financial Year: FY2025-26 (ended 31 Mar 2026)
Under India's T+1 settlement cycle, the ex-date and record date fall on the same day. To be eligible for this dividend, an investor needed to hold the shares as of the record date of 11 August 2026; buyers on or after the ex-date did not qualify.
Dividend Yield Analysis
Yield on latest CMP (~₹1,243): ~0.40%
Yield near announcement window (~₹850–950): ~0.53%–0.59%
Basic Materials sector average yield: ~1.65% (Source: TipRanks sector data)
At roughly 0.40%, Sudarshan's dividend yield sits well below the sector average of ~1.65%. The low yield is not caused by a dividend cut — it reflects a high share price (the stock has re-rated on the Heubach growth story) combined with a deliberately conservative payout while the company conserves cash for integration. This is a growth/re-rating stock, not an income stock.
Yield reality check: A yield near 0.40% offers very limited income. For income-focused investors, this yield is far below what many large-cap dividend payers and even bank fixed deposits offer. Prices: Investing.com, Screener.in (Sep 2026).
Dividend History Analysis
| Ex/Declaration Period | Dividend Per Share (₹) | Type |
|---|---|---|
| FY2025-26 (May 2026) | 5.00 | Final |
| FY2024-25 (Sep 2025) | 4.50 | Final |
| FY2023-24 (Jul 2024) | 1.00 | Final |
| FY2023-24 (Mar 2024) | 3.60 | Interim |
| FY2022-23 (Aug 2023) | 1.50 | Final |
| FY2021-22 (Aug 2022) | 5.00 | Final |
| FY2020-21 (Jul 2021) | 6.00 | Final |
| FY2019-20 (Mar 2020) | 5.80 | Interim/Final |
| FY2018-19 (Jul 2019) | 2.50 | Final |
Source: Exchange filings / TipRanks dividend history. Amounts on ₹2 face value.
Classification: Irregular / Volatile Payer. Sudarshan has paid dividends consistently, but the amount has been highly volatile — from ₹6.00 (FY21) down to ₹1.50 (FY23), back up to ₹4.50 (FY25) and ₹5.00 (FY26). There have been clear cuts in the last decade (notably the drop to ₹1.50). This is a company that flexes its dividend with the business cycle rather than following a steadily rising path. Income-focused investors should not assume a fixed or growing payout.
Financial Performance Analysis (Consolidated vs Standalone)
| Metric (₹ Cr) | Consolidated FY26 | Consolidated FY25 | Standalone FY26 |
|---|---|---|---|
| Revenue from Operations | 9,787.2 | 3,345.6 | 2,396.7 |
| EBITDA (segment) | 589.9 | 381.1 | — |
| Finance Costs | 164.9 | 48.3 | 28.6 |
| Depreciation | 347.2 | 166.2 | 148.0 |
| PAT (total) | 40.8 | 60.3 | 290.3 |
| PAT (owners) | 22.3 | 55.9 | 290.3 |
| EPS after exceptional (₹) | 2.8 | 7.9 | 36.9 |
Source: Screener.in consolidated & standalone financials, Aug 2026.
Operating Leverage: Revenue Up, Profit Down — Why? Consolidated revenue "jumped" to ₹9,787 Cr from ₹3,346 Cr — but this comparison is not like-for-like: the Heubach global pigment business was consolidated only from 3 March 2025, so FY25 captured barely a month of it while FY26 is a full year. Despite the top-line scale, consolidated PAT fell to ₹40.8 Cr from ₹60.3 Cr because of: (1) full-year Heubach integration/restructuring costs of ₹20.6 Cr (employee) + ₹114.6 Cr (other expenses); (2) depreciation more than doubling to ₹347 Cr; and (3) finance costs rising to ₹165 Cr from ₹48 Cr. Operating leverage has not yet flowed through — margins are thin at ~6% EBITDA.
The Standalone Story Is Very Different. The India-only (standalone) business earned a PAT of ₹290.3 Cr, more than double the ₹140.9 Cr of FY25, on revenue of ₹2,396.7 Cr. This is the profit engine that actually funds the dividend — the legacy pigments business remains highly profitable while the overseas Heubach operations are still being turned around.
Cash Flow Analysis
Operating profit before WC changes: ₹616.2 Cr
Net Cash from Operations (OCF): ₹344.0 Cr
Consolidated PAT: ₹40.8 Cr
Capex (PPE + intangibles): ₹270.4 Cr
Free Cash Flow (OCF − Capex): ~₹73.6 Cr
OCF of ₹344 Cr is roughly 8× the ₹40.8 Cr consolidated PAT — the gap is largely the ₹347 Cr depreciation add-back, confirming that the low profit is an accounting/amortisation effect, not a cash problem. Working capital was mixed: trade payables fell ₹353 Cr (a cash drag) but inventories released ₹360 Cr (a cash source).
How is the dividend funded? The total dividend outflow of ~₹39.3 Cr is about 11% of operating cash flow (₹344 Cr) and is covered ~1.9× by free cash flow (₹73.6 Cr). The payout is therefore funded primarily from current cash generation, not from borrowings or asset sales. It is a small, easily affordable cheque in cash-flow terms — the constraint is prudence during integration, not affordability. Source: Screener.in cash-flow statements, Aug 2026.
Balance Sheet Strength
Cash & Equivalents: ₹932.9 Cr
Current Investments: ₹323.0 Cr
Total Borrowings: ~₹2,119 Cr (LT ₹1,647.9 + ST ₹471.1)
Net Debt (Q4FY26): ~₹755 Cr (down from ₹934 Cr in Dec-25)
Total Equity: ₹3,854.0 Cr
The balance sheet carries meaningful acquisition-related debt, but net debt is falling (₹934 Cr → ₹755 Cr in one quarter) and cash + liquid investments of ~₹1,256 Cr comfortably cover the ~₹39.3 Cr dividend ~32×. Debt is elevated but trending in the right direction, and the dividend is a rounding error against the cash pile. Source: Screener.in balance sheet, Aug 2026.
Dividend Sustainability Analysis
| Coverage Metric | Value | Read |
|---|---|---|
| Payout ratio (standalone PAT ₹290.3 Cr) | ~13.5% | Very comfortable |
| Payout ratio (consolidated PAT ₹40.8 Cr) | ~96% | Tight on group profit |
| Payout ratio (owners' PAT ₹22.3 Cr) | ~176% | Exceeds group earnings |
| Dividend coverage — standalone EPS ₹36.9 | ~7.4× | Strong |
| Dividend coverage — consolidated EPS ₹2.8 | ~0.6× | Not covered on group EPS |
| FCF coverage (FCF ₹73.6 Cr) | ~1.9× | Adequate |
| Cash coverage (cash+investments ₹1,256 Cr) | ~32× | Very strong |
Verdict: Sustainable — but read the right number. On consolidated reported profit, the dividend looks stretched (payout ~96%, and above 100% on owners' earnings). But that consolidated profit is artificially depressed by non-cash depreciation and one-off integration costs. On the metrics that actually matter for a dividend — standalone earnings (13.5% payout), free cash flow (1.9× cover) and cash reserves (32× cover) — the ₹5 payout is comfortably sustainable. Classification: Sustainable, with the caveat that it is a token, low-yield payout rather than a generous or growing one.
Peer Comparison
Sudarshan is classified under Pigments & Specialty Chemicals. Direct like-for-like peer yields are shown below:
| Company | Approx. Div Yield | ROE (approx) |
|---|---|---|
| Sudarshan Chemical | ~0.40% | ~2–3% (depressed by Heubach) |
| Deepak Nitrite | ~0.40–0.45% | ~18–21% |
| Aarti Industries | ~0.23% | Low single digit / moderate |
| Fine Organics | Low | ~15.7% |
| Basic Materials sector avg | ~1.65% | — |
Source: Screener.in, TipRanks (Aug 2026). Indicative figures, verify before use.
Specialty-chemical and pigment peers are uniformly low-yield — the sector reinvests for growth rather than paying out. Sudarshan's yield is in line with peers like Deepak Nitrite, but its ROE is currently far below peers because of the Heubach integration drag. The dividend comparison is less relevant here than the earnings-recovery comparison: the investment case rests on ROE/ROCE normalising, not on the payout.
Promoter Impact Analysis
Promoter holding (Jun 2026): ~8.19% (64,40,604 shares)
FII holding: ~8.5%
DII holding: ~26.4%
Public holding: ~56.9%
Est. promoter dividend income: ~₹3.22 Cr
Est. public & institutional share: ~₹36.1 Cr
With promoters holding just 8.19%, roughly ₹36 Cr of the ~₹39.3 Cr payout goes to public and institutional shareholders, not the promoter family. Promoter holding has fallen sharply (from ~16% earlier) following the equity raise/dilution used to fund the Heubach deal. This dividend is minority-shareholder friendly — it is not a mechanism for the promoter to extract cash. Shareholding source: Screener.in (Jun 2026).
Taxation Analysis
Since FY2020–21, the Dividend Distribution Tax (DDT) has been abolished and dividends are taxable in the hands of the shareholder under "Income from Other Sources" at the investor's applicable income-tax slab rate. There is no special or flat rate for residents.
TDS (Section 194): 10% if total dividend from one company exceeds ₹10,000 in a financial year (threshold raised from ₹5,000 w.e.f. 1 April 2025).
No PAN / inactive PAN: TDS at 20%.
NRIs: ~20% TDS under Section 195 (or lower DTAA rate with valid documents).
Deduction: Only interest on money borrowed to buy the shares, capped at 20% of dividend (Section 57).
Source: Income-tax rules FY2025-26 (ClearTax, Motilal Oswal, Tax Garden), Aug 2026.
Worked example A — small holder
1,000 shares × ₹5 = ₹5,000 gross. Below ₹10,000 → no TDS. At a 30% slab, tax = ₹1,500 + 4% cess = ₹1,560. Net after tax = ₹3,440. Post-tax yield on ~₹1,243 ≈ ~0.28%.
Worked example B — larger holder
5,000 shares × ₹5 = ₹25,000 gross. Exceeds ₹10,000 → TDS 10% = ₹2,500; net received ₹22,500. Final tax at 30% slab = ₹7,500 + cess ₹300 = ₹7,800 (TDS of ₹2,500 is a credit; ₹5,300 payable at filing). Net after full tax = ₹17,200.
Key Risks
1. Integration execution risk. The Heubach turnaround is unproven. Full-year integration/restructuring costs of ₹135+ Cr hit FY26; if synergies slip, consolidated profitability stays depressed.
2. Acquisition debt. Net debt of ~₹755 Cr and finance costs of ₹165 Cr pressure earnings; a rate or refinancing shock would bite.
3. Thin consolidated margins. Group EBITDA margin of ~6% and near-zero group ROE leave little cushion if global pigment demand weakens.
4. Cyclical, competitive end-markets. Pigments serve coatings, plastics and inks — demand tracks global industrial/construction cycles and faces Chinese price competition.
5. Dividend volatility. History shows the payout has been cut before (down to ₹1.50); it is not a reliable, growing income stream.
6. FX exposure. Large overseas operations create currency translation swings (FX gains/losses already move the P&L materially).
What To Monitor
1. Consolidated EBITDA margin trajectory. Management targets a rise from ~6% toward 11%; watch quarterly progress.
2. Heubach EBITDA (€ terms). Guided to ~€35m in FY26 scaling to €90–100m; track against milestones.
3. Net debt reduction. Continuation of the ₹934 Cr → ₹755 Cr deleveraging trend.
4. Consolidated ROE/ROCE normalisation. The single biggest driver of the equity story.
5. Free cash flow. Sustained positive FCF is what keeps the dividend comfortably funded.
6. Revenue guidance delivery. FY27 target ₹9,800–10,200 Cr; FY29 target ₹12,000–14,000 Cr.
Conclusion
Sudarshan Chemical Industries' ₹5 final dividend (250%) for FY2025–26 is a small, comfortably-funded signal of confidence. The payout is safe on cash and standalone-earnings measures; the real question for investors is not the dividend but whether the Heubach acquisition converts scale into profit. This is a growth/turnaround story with a token dividend attached.
Positives: Dividend up to ₹5 from ₹4.50; cash-covered ~1.9× by FCF, ~32× by cash; standalone India business highly profitable (PAT ₹290 Cr); net debt falling; minority-shareholder-friendly (promoters only 8.19%).
Negatives: Very low yield (~0.40%) vs sector ~1.65%; consolidated payout ~96% of depressed group profit; Heubach integration unproven; margins thin (~6%); dividend history is volatile with past cuts.
The positives, negatives, risks and monitoring points are laid out above so you can weigh them yourself. This analysis does not offer any buy, sell or hold recommendation.
Frequently Asked Questions
What dividend has Sudarshan Chemical announced for FY2025-26?
What is the Sudarshan Chemical dividend yield?
What is the record date for the Sudarshan Chemical dividend?
What is the ex-dividend date for SUDARSCHEM?
When will the Sudarshan Chemical dividend be paid?
Who is eligible for the Sudarshan Chemical dividend?
How is the Sudarshan Chemical dividend taxed?
Is the Sudarshan Chemical dividend sustainable?
What is Sudarshan Chemical's dividend history?
Why did Sudarshan's consolidated profit fall despite higher revenue?
How much dividend income do the promoters receive?
What should investors monitor going forward?
Disclaimer
This article is for informational and educational purposes only and does not constitute investment advice or any buy, sell or hold recommendation. ShareBazaar Online is not a SEBI-registered investment adviser. Figures sourced from Sudarshan Chemical Industries' official exchange filings and publicly available third-party data (Screener.in, TipRanks, Business Standard, ScanX and others) may contain errors or become outdated; market prices and ratios change continuously. Some figures such as the exact announcement-date price and peer metrics are approximate and should be independently verified. Securities markets carry risk, including loss of capital. Please verify all data independently and consult a SEBI-registered financial adviser before making any investment decision.