
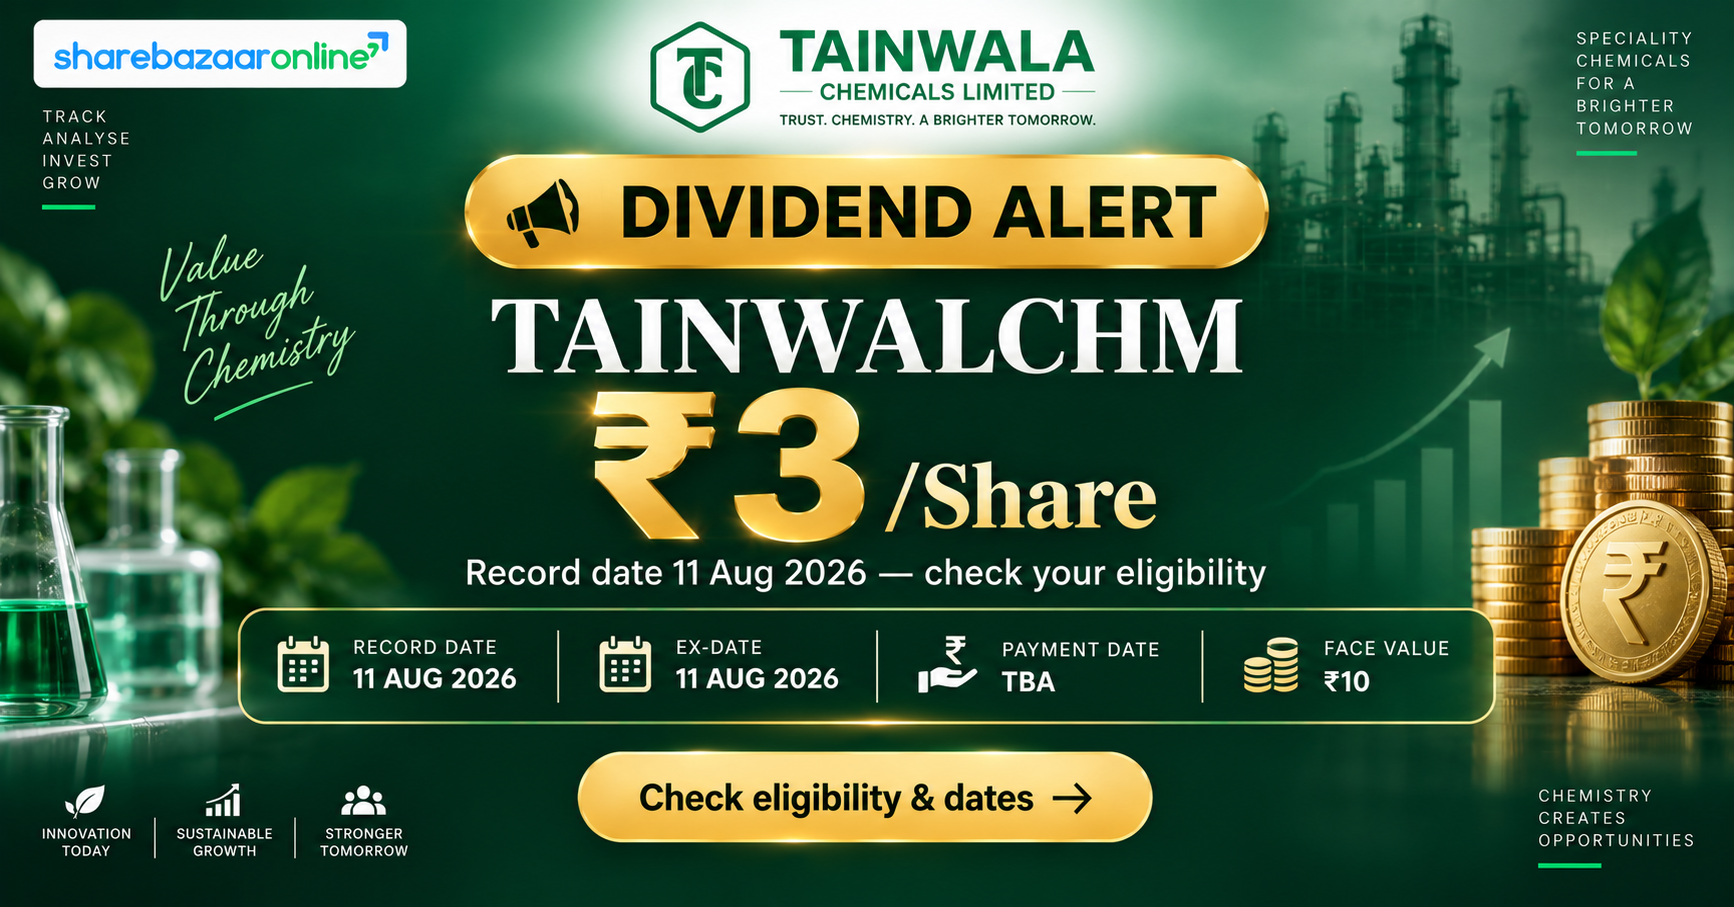
Dividend Snapshot
Tainwala Chemicals and Plastics (India) Limited (NSE: TAINWALCHM | BSE: 507785) has declared an Interim Dividend of ₹3 per equity share for the financial year 2026–27, on a face value of ₹10 — a payout of 30%. The Board approved the dividend at its meeting on 5 August 2026 and fixed 11 August 2026 as the record date.
Dividend Per Share: ₹3.00
Dividend Percentage: 30% (on ₹10 face value)
Dividend Type: Interim Dividend
Financial Year: FY 2026–27
Face Value: ₹10 per share
Announcement Date: 5 August 2026
Record Date: 11 August 2026
Ex-Date: 11 August 2026 (as per T+1 exchange convention; the filing specified only the record date)
Payment Date: Not Disclosed by Company (statutorily payable within 30 days of declaration)
Dividend Yield: ~1.46% (at ~₹205 around announcement)
Estimated total dividend outflow: ~₹2.81 crore (9,363,863 shares × ₹3). Dividend payout ratio (FY26): ~26% of standalone profit. Share count derived from paid-up capital of ₹9,36,38,630 disclosed in the filing.
Dividend Announcement Summary
In its intimation to BSE and NSE dated 5 August 2026, Tainwala Chemicals and Plastics (India) Limited informed the exchanges that its Board of Directors, at the meeting held on Wednesday, 5 August 2026, declared an interim dividend for FY 2026–27 and fixed Tuesday, 11 August 2026 as the record date to determine shareholder entitlement. The company’s paid-up equity capital is ₹9,36,38,630 (₹10 per equity share).
Important disclosure note: The record-date intimation itself did not state the dividend amount per share, the ex-date, or the payment date. Based on the company’s board outcome and exchange/data-provider disclosures, the interim dividend is ₹3 per share (Source: BSE/NSE disclosures, INDmoney, ScanX, Business Standard, Aug 2026). Shareholders were also asked to submit TDS-related declarations to the registrar (MUFG Intime) on or before 11 August 2026. Separately, the company published its 41st AGM notice for a virtual meeting on 3 September 2026.
Key Dates Timeline
Board Meeting / Announcement: 5 August 2026 (Wednesday)
Ex-Dividend Date: 11 August 2026
Record Date: 11 August 2026 (Tuesday)
Payment Date: Not Disclosed by Company (within 30 days of declaration by law)
41st AGM: 3 September 2026 (via VC/OAVM)
For reference — prior interim (₹3): paid ~4 September 2025
Under India’s T+1 settlement cycle, the ex-date and record date fall on the same day. To be eligible for this dividend, an investor needed to hold the shares as of the record date of 11 August 2026; buyers on or after the ex-date do not qualify.
Dividend Yield Analysis
Yield at announcement: ~1.46% (₹3 ÷ ~₹205)
Yield at recent price (~₹218): ~1.38%
Plastics/industrials sector average yield: ~2.5% (Source: TipRanks sector data)
At roughly 1.4%, Tainwala’s dividend yield sits below the broader sector average of ~2.5%. This is a modest yield, not a high-yield situation. The yield is driven by a small absolute dividend on a stock trading near its book value, rather than by any distressed fall in the share price. Prices: Investing.com, INDmoney, Screener.in (Aug 2026).
Yield reality check: A yield near 1.4% offers limited income and does not, by itself, indicate value. For income-focused investors, this yield is well below what many large-cap dividend payers and even bank fixed deposits offer.
Dividend History Analysis
| Financial Year | Dividend Per Share | Dividend Payout % |
|---|---|---|
| FY2016 to FY2025 | Nil | 0% |
| FY2026 (paid ~Sep 2025) | ₹3.00 | ~26% |
| FY2027 (interim, current) | ₹3.00 | To be seen (full-year) |
Source: Screener.in standalone data, Aug 2026.
This is the most important context most reports miss: Tainwala is a very new dividend payer. Company data shows a 0% dividend payout for roughly a decade (FY2016–FY2025), with the first cash dividend of ₹3 appearing only in FY2026. The current ₹3 interim for FY2027 is therefore only the second consecutive payout on record.
Classification: Irregular / newly-initiated payer. With only two years of dividends, there is no long-term track record of consistency or growth yet. Investors should not assume this dividend is a stable, recurring feature until a multi-year pattern is established.
Financial Performance Analysis
| ₹ Crore (Standalone) | FY24 | FY25 | FY26 |
|---|---|---|---|
| Revenue (Sales) | 18.03 | 16.42 | 17.83 |
| Operating Profit | -1.09 | 1.27 | 0.45 |
| Operating Margin (OPM) | -6.1% | 7.7% | 2.5% |
| Other Income | 7.06 | 5.40 | 13.23 |
| Net Profit (PAT) | 4.81 | 4.92 | 10.79 |
| EPS (₹) | 5.14 | 5.25 | 11.52 |
Source: Screener.in standalone financials, Aug 2026.
The critical finding — profit is not from the core business. In FY26, the company earned an operating profit of just ₹0.45 crore on revenue of ₹17.83 crore, while Other Income was ₹13.23 crore. In other words, the entire ₹10.79 crore net profit was effectively powered by investment/other income, not by making and selling plastic sheets. The plastics operation has historically run at a loss or wafer-thin margins.
Operating leverage & Q1FY27 warning. In the June 2026 quarter, net profit collapsed ~99% year-on-year to about ₹0.03 crore (from ~₹2.81 crore a year earlier). Revenue fell to ₹0.95 crore. The primary reason was a sharp fall in other income (from ~₹3.09 crore to ~₹0.08 crore). This shows how lumpy and unpredictable the company’s earnings are, because they hinge on investment gains rather than steady operations. Source: Screener.in, INDmoney (Aug 2026).
Cash Flow Analysis
Operating Cash Flow (FY26): ₹-2.01 Cr (negative)
Operating Cash Flow (FY25): ₹-0.94 Cr
Free Cash Flow (FY26): ₹-1.11 Cr (negative)
Financing outflow (FY26): ₹-2.81 Cr (the prior dividend)
“Reported profit is an opinion; cash is a fact.” Here the two diverge sharply. Despite a ₹10.79 crore accounting profit, the company’s operating cash flow was negative in FY26 — and has been negative in most of the last ten years.
So how is the dividend funded? Not from current operating cash and not from free cash flow (both negative). It is funded from the company’s large investment portfolio and the returns/realisations from it. The ₹3 dividend is comfortably affordable in absolute terms — but the source is the balance-sheet investment book, not the plastics business. This is a crucial distinction that a simple “company pays dividend” headline hides. Source: Screener.in cash-flow statements, Aug 2026.
Balance Sheet Strength
Net Worth (Mar 2026): ~₹172 Cr (Equity ₹9.36 Cr + Reserves ₹162.82 Cr)
Investments on books: ~₹181 Cr
Borrowings: ~Nil (debt-free)
Fixed Assets: ~₹2 Cr
Book Value / share: ~₹184; Price/Book ~1.2x
The balance sheet is the company’s real strength. It is essentially debt-free and holds an investment book (~₹181 Cr) that dwarfs its fixed assets (~₹2 Cr). Structurally, Tainwala looks more like an investment holding vehicle with a small plastics operation attached than a conventional manufacturer.
Dividend cover from the balance sheet: Against a dividend outflow of ~₹2.81 crore, the investment book of ~₹181 crore provides cover of roughly 60–65 times. On this measure the dividend is trivially affordable; the real question is earnings quality, not affordability. Source: Screener.in balance sheet, Aug 2026.
Dividend Sustainability Analysis
Can it afford the dividend? Yes — easily, from its investment book.
Covered by operating cash flow? No — OCF is negative.
Covered by free cash flow? No — FCF is negative.
Debt rising to fund payouts? No — company is debt-free.
Earnings trend? Volatile; dependent on other income.
Verdict: Moderately Sustainable (balance-sheet funded). The dividend is affordable because of a strong, debt-free balance sheet, but it is not backed by operating cash generation. Its continuity depends on the company’s willingness to keep distributing investment income — something with only a two-year history and no formal, disclosed dividend policy guaranteeing it.
Peer Comparison
Tainwala is classified under Plastic Products – Industrial. Direct like-for-like peer yields are not readily comparable because most listed plastic-product manufacturers are operating businesses, whereas Tainwala’s profits are investment-driven. On the metrics that can be benchmarked:
| Metric | Tainwala | Sector / Benchmark |
|---|---|---|
| Dividend Yield | ~1.4% | ~2.5% sector avg |
| Payout Ratio | ~26% | Varies widely |
| ROE (3-yr) | ~5% | Low vs quality peers |
| ROCE (FY26) | ~7.9% | Modest |
| Debt | Nil | Favourable |
Source: Screener.in, TipRanks (Aug 2026). Specific peer-by-peer figures: Not readily available / Not Disclosed.
Institutional interest is negligible — FII ~0.04% and DII ~0.22% — which is typical for a small, illiquid micro-cap. Its debt-free status compares favourably, but its low return ratios (ROE ~5%) lag higher-quality industrial peers.
Promoter Impact Analysis
Promoter holding (Jun 2026): ~68.1%
Public holding: ~31.6%
Est. promoter dividend income: ~₹1.91 Cr
Est. public shareholders’ share: ~₹0.89 Cr
With promoters holding ~68%, roughly two-thirds of the ₹2.81 crore payout flows to the promoter group. This is normal for a promoter-heavy company, but it means the dividend is also an efficient, lower-taxed-at-source route for the promoter family to draw cash from the company’s investment income. Minority shareholders benefit proportionately, receiving ~₹0.89 crore in aggregate. Shareholding source: Screener.in (Jun 2026).
Taxation Analysis
Since FY2020–21, the Dividend Distribution Tax (DDT) has been abolished and dividends are taxable in the hands of the shareholder under “Income from Other Sources” at the investor’s applicable income-tax slab rate. There is no special or flat rate for residents.
TDS (Section 194): 10% if total dividend from one company exceeds ₹10,000 in a financial year (threshold raised from ₹5,000 w.e.f. 1 April 2025).
No PAN / inactive PAN: TDS at 20%.
NRIs: ~20% TDS under Section 195 (or lower DTAA rate with valid documents).
Deduction: Only interest on money borrowed to buy the shares, capped at 20% of dividend (Section 57).
Source: Income-tax rules FY2025-26 (ClearTax, Motilal Oswal, Tax Garden), Aug 2026.
Worked example A — small holder
1,000 shares × ₹3 = ₹3,000 gross. Below ₹10,000 → no TDS. At a 30% slab, tax = ₹900 + 4% cess = ₹936. Net after tax = ₹2,064. Post-tax yield on ~₹205 ≈ ~1.0%.
Worked example B — larger holder
5,000 shares × ₹3 = ₹15,000 gross. Exceeds ₹10,000 → TDS 10% = ₹1,500; net received ₹13,500. Final tax at 30% slab = ₹4,500 + cess ₹180 = ₹4,680 (TDS of ₹1,500 is a credit; ₹3,180 payable at filing). Net after full tax = ₹10,320.
Key Risks
1. Earnings quality risk. Profits are dominated by other/investment income, not core plastic-sheet operations, making earnings lumpy and hard to predict — as the ~99% Q1FY27 profit fall showed.
2. Weak core operations. The plastics business has run at losses or razor-thin margins for years and faces cheap imports and excess industry capacity.
3. Negative operating cash flow. The dividend is not funded by operating or free cash flow, both of which are negative.
4. Micro-cap liquidity risk. Very low trading volumes and negligible institutional ownership (FII ~0.04%, DII ~0.22%) can cause sharp price swings and exit difficulty.
5. Dividend continuity risk. With only two years of payouts and no disclosed dividend policy, future dividends are not assured.
6. Market/valuation risk. Investment-income-led profits mean results move with markets; a market downturn can hit both earnings and the share price.
What To Monitor
1. Operating profit trend. Watch whether the plastics business can sustainably turn and hold a positive operating margin, independent of other income.
2. Other income composition. Track how much of each quarter’s profit is recurring vs one-off investment gains.
3. Operating cash flow. Look for a genuine shift to positive OCF, which would make dividends operationally funded.
4. Dividend consistency. A third and fourth consecutive payout would begin to establish a real track record.
5. Promoter holding changes. Monitor any pledging, buying, or selling in the quarterly shareholding pattern.
6. Investment book value. Since ~₹181 Cr of investments drive value, changes in this portfolio directly affect intrinsic worth.
Conclusion
Tainwala Chemicals and Plastics’ ₹3 interim dividend (30%) for FY2026–27 is a modest, easily affordable payout for a debt-free company sitting on a ~₹181 crore investment book. But the headline hides the substance: the payout is funded by the balance-sheet investment portfolio, not by the plastics operations, whose cash flows are negative and whose reported profits depend heavily on volatile other income.
Positives: Debt-free; large investment book giving huge dividend cover; second consecutive payout; promoter skin in the game (~68%).
Negatives: Weak core operations; negative operating/free cash flow; investment-dependent, lumpy earnings; low yield (~1.4%); micro-cap illiquidity; only a two-year dividend record.
The positives, negatives, risks and monitoring points are laid out above so you can weigh them yourself. This analysis does not offer any buy, sell or hold recommendation.
Frequently Asked Questions
What dividend has Tainwala Chemicals announced?
What is the dividend yield on this payout?
What is the record date for the Tainwala dividend?
What is the ex-date?
When will the dividend be paid?
Who is eligible for the dividend?
How is this dividend taxed?
Is the Tainwala dividend sustainable?
What is Tainwala’s dividend history?
Why did Tainwala’s Q1 FY27 profit fall so sharply?
How much does the dividend cost the company and the promoters?
What should investors monitor going forward?
Disclaimer
This article is for informational and educational purposes only and does not constitute investment advice or any buy, sell or hold recommendation. ShareBazaar Online is not a SEBI-registered investment adviser. Figures sourced from the company’s exchange filing, Screener.in, TipRanks, INDmoney, Investing.com and Business Standard as of August 2026 may contain errors or become outdated, and standalone/consolidated classifications may differ across sources. Securities markets carry risk, including loss of capital; micro-cap stocks are especially volatile and illiquid. Please verify all data independently and consult a SEBI-registered financial adviser before making any investment decision.