
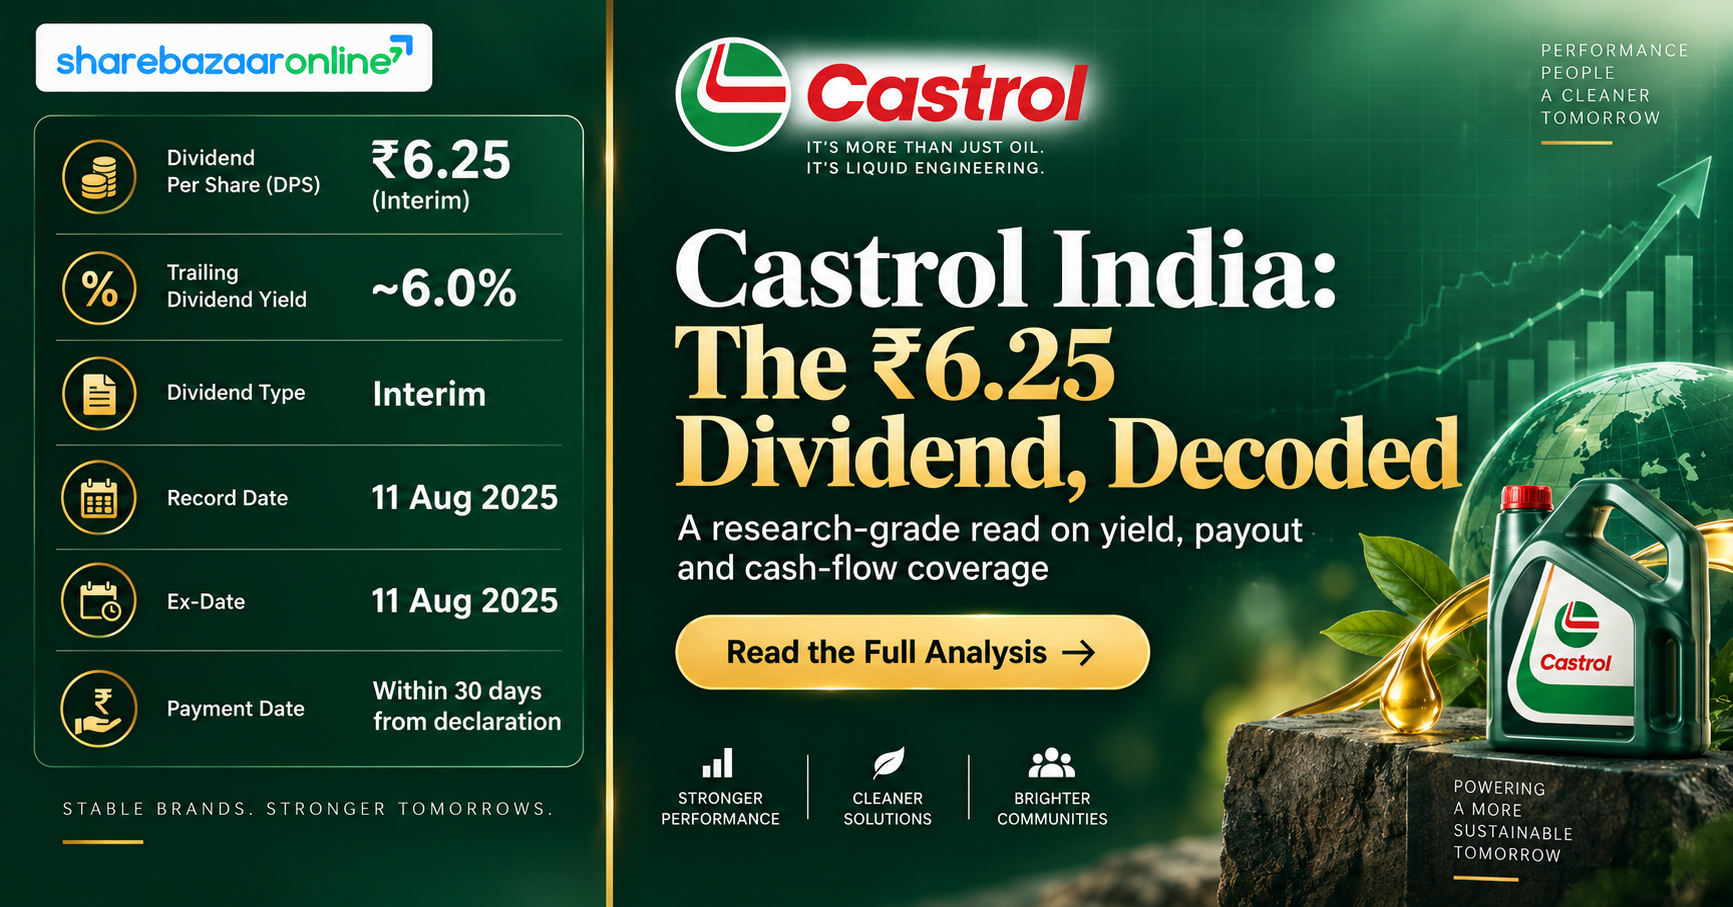
Dividend Snapshot
Company
Castrol India Limited
NSE: CASTROLIND | BSE: 500870 | ISIN: INE172A01027
Interim Dividend Declared
₹6.25 per equity share (Face Value ₹5) — a 125% dividend
Approx. Dividend Yield (this interim)
~3.36% on CMP of ₹186.05 (2 Sep 2026)
Trailing 12-month yield (₹11.50): ~6.2%
Estimated Total Payout
~₹618 Crore cash outflow for this single interim
Castrol India’s Board declared this interim dividend at its meeting on 4 August 2026, alongside Q2 (Apr–Jun) 2026 results. The headline read simple — a bigger cheque than last year’s ₹3.50 August interim. The important story sits underneath: the company is front-loading cash returns during a year of ownership transition, and this one interim payout is larger than the entire profit it earned in the first half of 2026. This report breaks down whether the numbers hold up.
Dividend Announcement Summary
At the Board Meeting held on Tuesday, 4 August 2026, the Directors of Castrol India Limited approved the unaudited financial results for the quarter and half-year ended 30 June 2026 and declared an interim dividend of ₹6.25 per equity share of face value ₹5 each, for the financial year ending 31 December 2026. Castrol follows a calendar year (January–December) reporting cycle, so this is an FY2026 interim payout.
Board Recommendation
Being an interim dividend, it is declared directly by the Board and does not require AGM approval to be paid. It will be paid within 30 days of declaration.
Management Commentary
CFO Ms. Mrinalini Srinivasan said the Board has declared a dividend that “accelerates a greater portion of cash returns to shareholders during this year of transition,” while the full-year payout is expected to stay “broadly in line with established practice.”
The “Transition” Context You Should Know
In December 2025, Castrol’s ultimate parent bp plc announced an agreement to sell a 65% stake in its global Castrol lubricants business to Stonepeak at an enterprise value of approximately USD 10 billion, retaining a 35% minority interest. bp expects to complete the transaction by end-2026, subject to approvals. The company clarified this has no impact on the H1 2026 financial results. This backdrop matters because it helps explain why cash is being pushed out to shareholders more aggressively this year. (Source: Castrol India board-meeting filing & press release, 4 Aug 2026)
Key Dates Timeline
Announcement / Declaration Date
Tuesday, 04-08-2026
Record Date
Tuesday, 11-08-2026
Ex-Dividend Date
Monday, 11-08-2026
Under T+1 settlement, ex-date and record date fall on the same day.
Payment Date
On or before 02-09-2026
To be eligible, you must hold the shares in your demat account as of the record date, 11 August 2026. Because Indian equities settle on a T+1 basis, you needed to have bought on or before 8 August 2026 (the last cum-dividend trading day) to receive this dividend. Anyone buying on the ex-date or later is not entitled to it.
Dividend Yield Analysis
Yield On Announcement Day
NSE close on 4 Aug 2026 was ₹187.06. This interim of ₹6.25 gives a yield of ~3.34% for this single payout.
Yield On Current Price
At a CMP of ₹186.05 (2 Sep 2026), this interim yields ~3.36%. Adding the ₹5.25 interim paid earlier in 2026, the trailing-twelve-month dividend of ₹11.50 works out to a TTM yield of roughly 6.2%.
Yield Reality Check — Why Is It This High?
Castrol’s ~6% trailing yield sits far above the lubricants/petroleum-products industry median (roughly 1.9%, per Investing.com). The high yield here is not the classic “falling knife” trap where a collapsing price inflates yield. Instead it is driven by two real factors: (1) Castrol genuinely pays out most of its profit as dividend, and (2) the stock has drifted lower over the past year (down roughly 6–14% depending on the window), which lifts the yield mechanically. So the yield is “real,” but it is being propped up by an above-100% payout ratio — a level that can only continue if earnings keep rising or cash reserves are drawn down. That is the crux of the sustainability question below.
Dividend History Analysis
Dividends By Calendar Year (Interim + Final, ₹ per share)
| Year | Dividends Declared | Total (₹) |
|---|---|---|
| 2021 | ₹3.00 + ₹2.50 | 5.50 |
| 2022 | ₹3.00 + ₹3.00 | 6.00 |
| 2023 | ₹3.50 + ₹3.00 | 6.50 |
| 2024 | ₹4.50 + ₹3.50 | 8.00 |
| 2025 | ₹9.50 + ₹3.50 | 13.00 |
| 2026 (YTD) | ₹5.25 + ₹6.25 | 11.50 |
Figures grouped by the calendar year in which each dividend went ex. Source: exchange filings / public dividend records. Minor differences vs other trackers can arise from year-attribution methods.
Consistency & Trend
Castrol has paid a dividend every single year for well over a decade, with no suspensions. The trend is clearly rising — the annual payout has grown from ₹3.50 a decade ago toward double digits, a compound growth rate in the high single digits.
Classification
On this record, Castrol is a Consistent Payer. The 2025 jump to ₹13.00 (boosted by a large ₹9.50 final) and the elevated 2026 interims reflect the parent-level transition, not a change in dividend discipline.
Financial Performance Analysis
Standalone Results (₹ Crore)
| Particulars | Q2 2026 | Q2 2025 | YoY | H1 2026 | H1 2025 |
|---|---|---|---|---|---|
| Revenue from Operations | 1,871.47 | 1,496.83 | +25.0% | 3,416.71 | 2,918.83 |
| EBITDA | 494 | 350 | +41% | 823 | 657 |
| Profit Before Tax | 476.03 | 329.54 | +44.5% | 799.14 | 642.26 |
| Profit After Tax | 347.70 | 244.00 | +42.5% | 589.88 | 477.46 |
| EPS (₹, not annualised) | 3.51 | 2.47 | +42.1% | 5.96 | 4.83 |
Operating Leverage — The Good News
This is a clean, positive operating-leverage quarter. Revenue rose +25% but EBITDA rose +41% and PAT +42.5% — profits grew almost twice as fast as sales. That means margins expanded despite the commodity inflation management flagged. EBITDA margin improved to roughly 26% in Q2 2026 from ~23% a year earlier.
Where To Be Careful
Raw & packing material cost jumped to ₹939.54 Cr in Q2 2026 from ₹697.57 Cr (+34.7%) — faster than revenue. Reported margins held up partly because of a large ₹108.36 Cr inventory build (favourable to cost-of-goods). That is a real gain, but it is worth watching whether margins sustain once that inventory is sold.
For context, FY2025 (year ended Dec 2025) delivered revenue of ₹5,721.50 Cr, PAT of ₹949.93 Cr and EPS of ₹9.60. Over the last five years Castrol has grown revenue at roughly a 13–14% CAGR (Source: MoneyWorks4Me), so the growth engine is intact.
Cash Flow Analysis
Reported Profit Is An Opinion — Cash Is A Fact
Castrol reported a strong ₹589.88 Cr H1 profit, but its operating cash flow (OCF) was only ₹308.13 Cr in H1 2026 — and it actually fell from ₹412.81 Cr a year earlier despite higher profit. The gap is the single most important thing in this result.
Why OCF Lagged Profit
Working capital swallowed the cash. In H1, inventories rose by ₹495.49 Cr and trade receivables by ₹284.42 Cr, only partly offset by a ₹446.35 Cr rise in payables. That is why cash generated from operations, before working capital, of ₹838.37 Cr shrank to just ₹459.71 Cr after working-capital movements.
Free Cash Flow (H1 2026)
FCF = OCF ₹308.13 Cr − capex ₹84.47 Cr = ₹223.66 Cr. Against this interim’s outflow of ~₹618 Cr, FCF covers only ~0.36x.
How Is The Dividend Being Funded?
The cash-flow statement is blunt: Castrol paid ₹519.29 Cr in dividends during H1 2026, well above its ₹308.13 Cr operating cash flow. The shortfall was bridged by drawing down bank deposits — net maturity of deposits contributed a ₹289.98 Cr investing inflow. In plain English: for now, a meaningful slice of the dividend is being funded from the accumulated cash pile, not purely from current-year cash generation. This is sustainable while the reserve lasts, but it is not a permanent arrangement, and it aligns with management’s stated aim of “accelerating” returns this year.
Balance Sheet Strength
Debt Position
Castrol is effectively debt-free. It carries no bank borrowings — only lease liabilities of ₹53.15 Cr (₹30.32 Cr non-current + ₹22.83 Cr current). Finance costs were a tiny ₹3.57 Cr in H1.
Cash & Liquidity
Cash & equivalents of ₹492.28 Cr plus other bank balances of ₹370.60 Cr give ~₹862.88 Cr of liquid resources, with a further ₹376.81 Cr in investments. Total equity stands at ₹1,908.92 Cr.
The Working-Capital Watch-Item
Since December 2025, inventories nearly doubled to ₹1,041.83 Cr (from ₹546.34 Cr, +90.7%) and trade receivables jumped ~60% to ₹757.70 Cr (from ₹473.21 Cr). Some of this is seasonal stocking, but a build this large ties up cash and is the direct reason operating cash flow lagged profit this half-year. Payables also rose (to ₹1,201.13 Cr), which cushions the impact, but the trend deserves monitoring.
Return ratios remain outstanding and asset-light: ROE of roughly 45–50% and ROCE around 60–65% (Source: Screener / Dhan, 2026). Even after generous dividends, the balance sheet is strong — the question is one of cash-flow timing, not solvency.
Dividend Sustainability Analysis
| Test | Reading | Verdict |
|---|---|---|
| Payout Ratio (TTM) | ~110–120% of profit | Stretched |
| EPS vs this interim DPS | H1 EPS ₹5.96 vs ₹6.25 | Coverage < 1x |
| FCF Coverage (H1) | ₹223.66 Cr vs ~₹618 Cr | ~0.36x |
| Cash Coverage | ₹862.88 Cr cash vs ~₹618 Cr | ~1.4x |
| Debt Position | Effectively debt-free | Strong |
| Earnings Trend | PAT +23.5% H1 YoY | Growing |
Overall Classification: Moderately Sustainable
Castrol scores well on the balance-sheet tests (no debt, healthy cash, rising profit) but poorly on the flow tests (payout above 100%, FCF covering only about a third of this interim). The dividend is affordable today because the company sits on a cash cushion and earns very high returns. But at a 100%+ payout funded partly from reserves, the current pace is not indefinitely repeatable from organic cash unless earnings keep climbing. Management itself frames this as an accelerated payout for a “year of transition,” and guides that the full-year payout will stay “broadly in line with established practice” — a signal not to simply annualise the elevated 2026 interims into perpetuity.
Peer Comparison
| Company | Div Yield | Payout | ROE | P/E | Debt |
|---|---|---|---|---|---|
| Castrol India | ~4.5–6.2% | ~110%+ | ~50% | ~18x | Nil |
| Gulf Oil Lubricants | ~4.0–4.8% | ~65% | ~22.6% | ~16x | Low |
| Veedol Corporation | ~3.9% | Moderate | ~18.5% | ~14x | Low |
Source: Screener / Motilal Oswal / Dhan peer data, 2026. Figures are approximate and move with price.
Castrol offers the highest yield and by far the highest ROE of the listed pure-play lubricant names — a function of its asset-light model and market leadership. But it also runs the most aggressive payout. Gulf Oil pays a comparable yield while retaining more earnings (~65% payout), giving it more room to reinvest for growth. In short: Castrol is the income-heavy, cash-return leader; Gulf Oil is the faster-growing, more self-funding alternative. Castrol also trades at a premium P/B to peers, reflecting its return profile.
Promoter Impact Analysis
Shareholding Pattern (Jun 2026)
Promoter (Castrol Ltd, bp group): 51.00%
DII: ~14.4% | FII: ~8.2%
Public & others: ~20.4%
Source: Dhan / Screener, Jun 2026 pattern.
Promoter Dividend Income
On this interim alone, the promoter’s 51% stake earns roughly ₹315 Crore (51% × ~₹618 Cr outflow). Minority shareholders collectively receive the remaining ~₹303 Crore.
Distribution Impact — A Fair-But-Watchful Read
The dividend is paid equally per share, so minority holders receive exactly the same ₹6.25 per share as the promoter — there is no structural disadvantage. However, given the bp–Stonepeak transition at the parent level and management’s language about “accelerating” returns, investors should note that a high-payout policy channels a large, steady cash stream to the controlling shareholder. That is normal for an MNC subsidiary, but it does mean less profit is retained inside Castrol India for reinvestment.
Taxation Analysis
How Dividends Are Taxed In India
Since FY2020-21, dividends are taxed in the hands of the investor at their applicable income-tax slab rate (added to “Income from Other Sources”). The company deducts TDS at 10% if your total dividend from that company in a financial year exceeds ₹10,000 (TDS is 20% for those without a valid PAN; NRIs face 20% or the applicable DTAA rate).
Worked Example
Investor owns 1,000 shares; dividend ₹10 per share; tax slab 30%:
- Gross Dividend = 1,000 × ₹10 = ₹10,000
- TDS at 10% (since it just crosses ₹10,000) = ₹1,000 deducted at source
- Total tax at 30% slab = ₹3,000 (the ₹1,000 TDS is adjusted against this)
- Net Dividend in hand after full tax = ₹7,000
- If the stock were bought at ₹186, the effective post-tax yield on that ₹10 dividend falls from ~5.4% to ~3.8% for a 30%-slab investor
Illustrative only. Actual liability depends on your total income, slab, surcharge and cess. This is not tax advice.
Key Risks
- Payout above 100%: With the TTM payout around 110–120% and this interim exceeding H1 profit, the dividend leans on cash reserves; a bad earnings year would force a rethink.
- Operating cash-flow softness: H1 OCF (₹308 Cr) fell below the dividend paid (₹519 Cr) and below the prior year, driven by a large working-capital build.
- Raw-material / crude inflation: Base-oil and packaging costs rose faster than sales in Q2; management explicitly flagged commodity inflation and currency pressure.
- Ownership transition: The bp–Stonepeak deal (65% of global Castrol to Stonepeak) introduces uncertainty around long-term capital-allocation and brand strategy, even if the Indian entity is unaffected today.
- EV & demand shift: A long-term structural move toward EVs and tighter emission norms (from 2027) could slow conventional lubricant volume growth.
- Weak price performance: The stock has drifted lower over the past year; a rising yield partly reflects that, and capital-appreciation has lagged the dividend.
What To Monitor
- Full-year 2026 payout vs guidance: Watch whether the total FY2026 dividend stays “broadly in line with established practice,” as the CFO indicated, rather than annualising the elevated interims.
- Operating cash flow recovery: Does OCF rebuild in H2 as the inventory build unwinds? A return toward the ₹400 Cr+ half-yearly OCF range would ease sustainability concerns.
- Working-capital normalisation: Track whether inventory (₹1,042 Cr) and receivables (₹758 Cr) come back down toward historical levels.
- Gross-margin durability: Watch whether EBITDA margins hold near ~24–26% once the inventory gain rolls off and if pricing offsets raw-material inflation.
- bp–Stonepeak completion: Any change in control, royalty, or brand-licensing terms flowing to Castrol India post-completion.
- Volume growth in core segments: Personal-mobility & industrial volume trends, distribution expansion (~160,000 outlets) and premiumisation of the portfolio.
Conclusion
Positives
- Strong Q2: revenue +25%, EBITDA +41%, PAT +42.5% YoY
- Effectively debt-free with ~₹863 Cr liquid cash
- Exceptional returns: ROE ~50%, ROCE ~60%+
- Consistent dividend payer for 10+ years, rising trend
- High trailing yield (~6%) vs ~1.9% industry median
Negatives / Watch-outs
- Payout above 100% of profit; this interim > H1 PAT
- H1 operating cash flow fell YoY and trailed dividends paid
- Dividend part-funded from cash reserves, not just earnings
- Sharp working-capital build tied up cash
- Raw-material inflation and parent-level transition overhang
Castrol India’s ₹6.25 interim is a shareholder-friendly move backed by a rock-solid balance sheet and elite return ratios. The catch is timing: it is being paid out at a pace that current-year cash flow does not fully cover, leaning on the company’s cash cushion during a “year of transition.” That makes it moderately sustainable — comfortable for now, but dependent on earnings continuing to grow and management’s guidance that full-year payout stays in its usual band. Income investors get a genuinely high yield; the trade-off is limited retained cash for growth and a payout that cannot be simply extrapolated upward. Weigh the positives, negatives and risks above and decide based on your own goals.
Frequently Asked Questions
What dividend has Castrol India announced in August 2026?
What is the Castrol India dividend yield?
What is the record date for the Castrol India interim dividend?
What is the ex-dividend date for Castrol India?
When will the Castrol India dividend be paid?
Who is eligible to receive the Castrol India dividend?
How is the Castrol India dividend taxed?
Is the Castrol India dividend sustainable?
What is Castrol India’s dividend history?
What should investors monitor going forward?
How much dividend outflow does this involve for Castrol India?
How does Castrol India compare with Gulf Oil Lubricants on dividends?
Disclaimer
This article is for informational and educational purposes only and does not constitute investment, financial, legal or tax advice, nor a recommendation to buy, sell or hold any security. Company-disclosed figures are drawn from Castrol India Limited’s board-meeting filing, unaudited financial results and press release dated 4 August 2026. Market prices, yields, shareholding, ratios and peer data are sourced from public providers (NSE/BSE, Screener, Dhan, Motilal Oswal, Investing.com and others) as of the dates noted and may change. ShareBazaar Online has made reasonable efforts to ensure accuracy but does not guarantee it and accepts no liability for any loss arising from the use of this information. Please consult a SEBI-registered investment adviser and a qualified tax professional before making any decision.