
Dividend Snapshot
Ratnamani Metals & Tubes Limited (NSE: RATNAMANI, BSE: 520111, ISIN: INE703B01027) has recommended a Final Dividend of ₹10 per equity share — a payout of 500% on the face value of ₹2 each — for the financial year ended March 31, 2026.
The dividend is on 7,00,92,000 equity shares and is subject to shareholder approval at the 42nd Annual General Meeting. The total cash outflow works out to approximately ₹70.09 crore.
- • Dividend Type: Final Dividend
- • Dividend Per Share: ₹10.00
- • Dividend Rate: 500% (on FV ₹2)
- • Face Value: ₹2.00
- • Dividend Yield: approx. 0.37% (at ~₹2,700 CMP)
- • Record Date: August 11, 2026
- • Ex-Date: August 11, 2026
- • Payment: on or before September 17, 2026
The one number that matters: this ₹10 dividend is a cut of about 28.6% from the ₹14 per share Ratnamani paid in both FY2025 and FY2024. That reduction is the single most important fact for income-focused shareholders, and this analysis explains exactly why it happened and whether the smaller payout is now safer or weaker. (FY25/FY24 dividend of ₹14 verified via TipRanks dividend history and the company's own cash-flow statement, which shows ₹98.13 crore of dividend paid during FY26.)
Dividend Announcement Summary
At its Board Meeting on May 15, 2026 (commenced 12:15 PM, concluded 3:40 PM), the Board of Directors of Ratnamani Metals & Tubes Limited approved the audited standalone and consolidated financial results for the quarter and year ended March 31, 2026, and recommended a final dividend of ₹10 per share (500%) for FY2025-26.
Per the board outcome, the dividend, if approved by members at the ensuing 42nd AGM, would be paid subject to tax deducted at source, on or before September 17, 2026. The record date for determining eligible members has been fixed as Tuesday, August 11, 2026, and the 42nd AGM is scheduled for Tuesday, August 18, 2026, via video conferencing.
The independent auditors, M/s. Kantilal Patel & Co., issued an unmodified (clean) opinion on both the standalone and consolidated results — an important quality marker for the numbers underpinning this dividend. Post-announcement, the dividend was approved by shareholders at the AGM on August 18, 2026. (AGM approval confirmed via Screener AGM-outcome filing.)
Key Dates Timeline
- 📅 Announcement / Board Meeting: May 15, 2026
- 📅 Financial Year: FY2025-26 (ended March 31, 2026)
- 📅 Record Date: August 11, 2026 (Tuesday)
- 📅 Ex-Dividend Date: August 11, 2026
- 📅 AGM (approval): August 18, 2026 (Tuesday)
- 📅 Payment Date: on or before September 17, 2026
What "record date" means for you: to be eligible for this dividend, shares had to be in your demat account as on August 11, 2026. Because Indian settlement is now T+1, the ex-date and record date coincide, so shares needed to be bought on or before August 8, 2026 (the last trading day before ex-date) to qualify. The board outcome letter itself disclosed only the record date; the ex-date of August 11 is confirmed via exchange dividend data.
Dividend Yield Analysis
Yield at announcement (May 15, 2026):
₹10 ÷ ~₹2,693 close = 0.37%
Yield at latest price (early Sept 2026):
₹10 ÷ ~₹2,700 = ~0.37%
CMP and market cap (~₹19,100 crore) sourced from Screener / INDmoney, late-August to early-September 2026. 52-week range: ₹1,936.50 – ₹3,345.00.
Reality check — why the yield is so low: Ratnamani's ~0.37% yield is not the result of a falling share price or a one-off special. It is simply a low-yield, high-multiple growth stock. The company trades at a P/E of roughly 33–38x and deliberately retains most of its profit to fund expansion.
For context, the broad Indian market's median yield is roughly 0.24%–1.06%, and the Basic Materials sector average is around 1.6% (Simply Wall St / TipRanks). Ratnamani sits below the sector average — investors here are paid to wait for growth, not for income.
Dividend History Analysis
Ratnamani has paid dividends consistently for over a decade, but the trend has not been a straight line up. FY2025-26 marks the first reduction in years.
| Financial Year | Dividend / Share (₹) | Trend |
|---|---|---|
| FY2025-26 | 10.00 | ▼ Cut (-28.6%) |
| FY2024-25 | 14.00 | — Flat |
| FY2023-24 | 14.00 | ▲ Up |
| FY2022-23 | 12.00 | ▲ Up |
| FY2021-22 | 9.33 | — Flat |
| FY2020-21 | 9.33 | ▲ Up |
| FY2019-20 | 8.00 | ▲ Up |
| FY2018-19 | 6.00 | ▲ Up |
| FY2017-18 | 4.00 | ▲ Up |
| FY2016-17 | 3.67 | — |
Per-share dividend history sourced from TipRanks / exchange records; figures are as declared for each financial year. Older amounts reflect the company's split/face-value adjustments.
Classification: Consistent Payer with a growth bias — but now shows its first cyclical cut. Over the last decade the dividend rose strongly (roughly a mid-teens compounded growth rate), yet the payment has been tied to the earnings cycle rather than a fixed policy. Analysts had already flagged that Ratnamani's dividend history carries some instability, with at least one earlier cut. The FY26 reduction from ₹14 to ₹10 confirms that the payout follows profit, and profit has fallen.
Financial Performance Analysis
Consolidated FY26 (primary view):
- • Revenue from operations: ₹4,493.96 Cr (FY25: ₹5,186.47 Cr) — down 13.4%
- • Profit before tax: ₹706.34 Cr (FY25: ₹737.99 Cr) — down 4.3%
- • Net profit (owners): ₹482.55 Cr (FY25: ₹543.98 Cr) — down 11.3%
- • EPS: ₹68.85 (FY25: ₹77.27)
Standalone FY26:
- • Revenue from operations: ₹3,689.30 Cr (FY25: ₹4,876.14 Cr) — down 24.3%
- • Profit before tax: ₹583.13 Cr (FY25: ₹778.11 Cr)
- • Net profit: ₹433.96 Cr (FY25: ₹578.01 Cr) — down 24.9%
- • EPS: ₹61.91 (FY25: ₹82.46)
Operating leverage — read this carefully. On a consolidated basis, revenue fell 13.4% but PBT fell only 4.3%. That looks resilient, but it is flattered by non-operating income: consolidated other income more than doubled to ₹121.95 Cr (FY25: ₹59.62 Cr), largely treasury/interest gains on the company's large cash pile. Strip that out and the picture is weaker — consolidated segment operating results fell about 6.8% (to ₹696.56 Cr from ₹747.09 Cr).
The standalone business shows the real operating stress: revenue down 24.3% and profit down 24.9%, i.e. margins held roughly flat because cost of materials consumed fell in step (raw-material / steel-nickel price deflation), not because of pricing power. The gap between the sharp standalone decline and the milder consolidated decline is explained by growth in subsidiaries (notably the bearing-rings and pipe-spool businesses). Momentum has also softened into FY27 — Q1 FY27 net profit fell about 37.7% year-on-year to ₹82.16 Cr (Axis Direct / INDmoney).
Cash Flow Analysis
Cash is fact. Here it is strong:
- • Standalone Operating Cash Flow: ₹976.11 Cr (FY25: ₹520.99 Cr)
- • Standalone Net Profit: ₹433.96 Cr
- • OCF / PAT = 2.25x — excellent cash conversion
- • Capex (PP&E + CWIP): ₹300.01 Cr
- • Free Cash Flow ≈ ₹676.10 Cr (standalone)
- • Consolidated FCF ≈ ₹450.76 Cr (OCF ₹936.01 Cr – capex ₹485.25 Cr)
But understand where the cash came from. A big chunk of FY26 operating cash was a one-time working-capital release: as the business shrank, trade receivables fell by ₹489.12 Cr and inventories fell by ₹248.59 Cr. That converted lower sales into higher cash — good for this year's dividend cover, but not repeatable once the cycle turns and the company has to re-stock and re-extend credit to grow again.
How the dividend is funded: entirely out of current earnings and free cash flow — not from borrowings or asset sales. The ₹70.09 Cr dividend is a small fraction of both profit and FCF.
Receivables vs revenue: receivables fell faster than revenue, which is a positive collection signal — there is no build-up of unpaid sales masking weak cash. The quality of reported profit is backed by real cash. The main caveat is simply that the exceptional strength of FY26 operating cash flow is partly a de-growth artifact, not proof of a structural step-up.
Balance Sheet Strength
Liquidity (standalone, as at 31-Mar-2026):
- • Cash & cash equivalents: ₹65.54 Cr
- • Current investments: ₹644.32 Cr
- • Non-current investments: ₹175.84 Cr
- • Liquid cash + current investments ≈ ₹709.85 Cr
- • Total equity: ₹4,080.68 Cr
Debt position:
- • Standalone: virtually debt-free (only lease liabilities of ~₹13.3 Cr). Net cash of ~₹700 Cr+.
- • Consolidated gross borrowings: ₹304.27 Cr (FY25: ₹140.57 Cr) — roughly doubled, tied to subsidiary / Saudi (KSA) expansion.
- • Even so, the group remains net-cash positive (cash + current investments ~₹718 Cr > gross debt).
- • Debt-to-equity ~0.01x; company described as "almost debt free" (Screener).
Cash coverage of dividend ≈ 10.1x (liquid assets ₹709.85 Cr ÷ dividend ₹70.09 Cr). Reported ROE is around 16.9% (MarketsMojo, TTM basis); on FY26 year-end equity our computed consolidated ROE is closer to ~11.7%, and computed ROCE is roughly 14–15%. ROCE is not separately disclosed by the company and is an estimate. Promoters confirmed zero encumbrance / no pledged shares for FY26 — a clean, low-risk capital structure.
Dividend Sustainability Analysis
- • Payout ratio: ~14.5% of consolidated profit (~16.2% standalone) — very low, lots of headroom
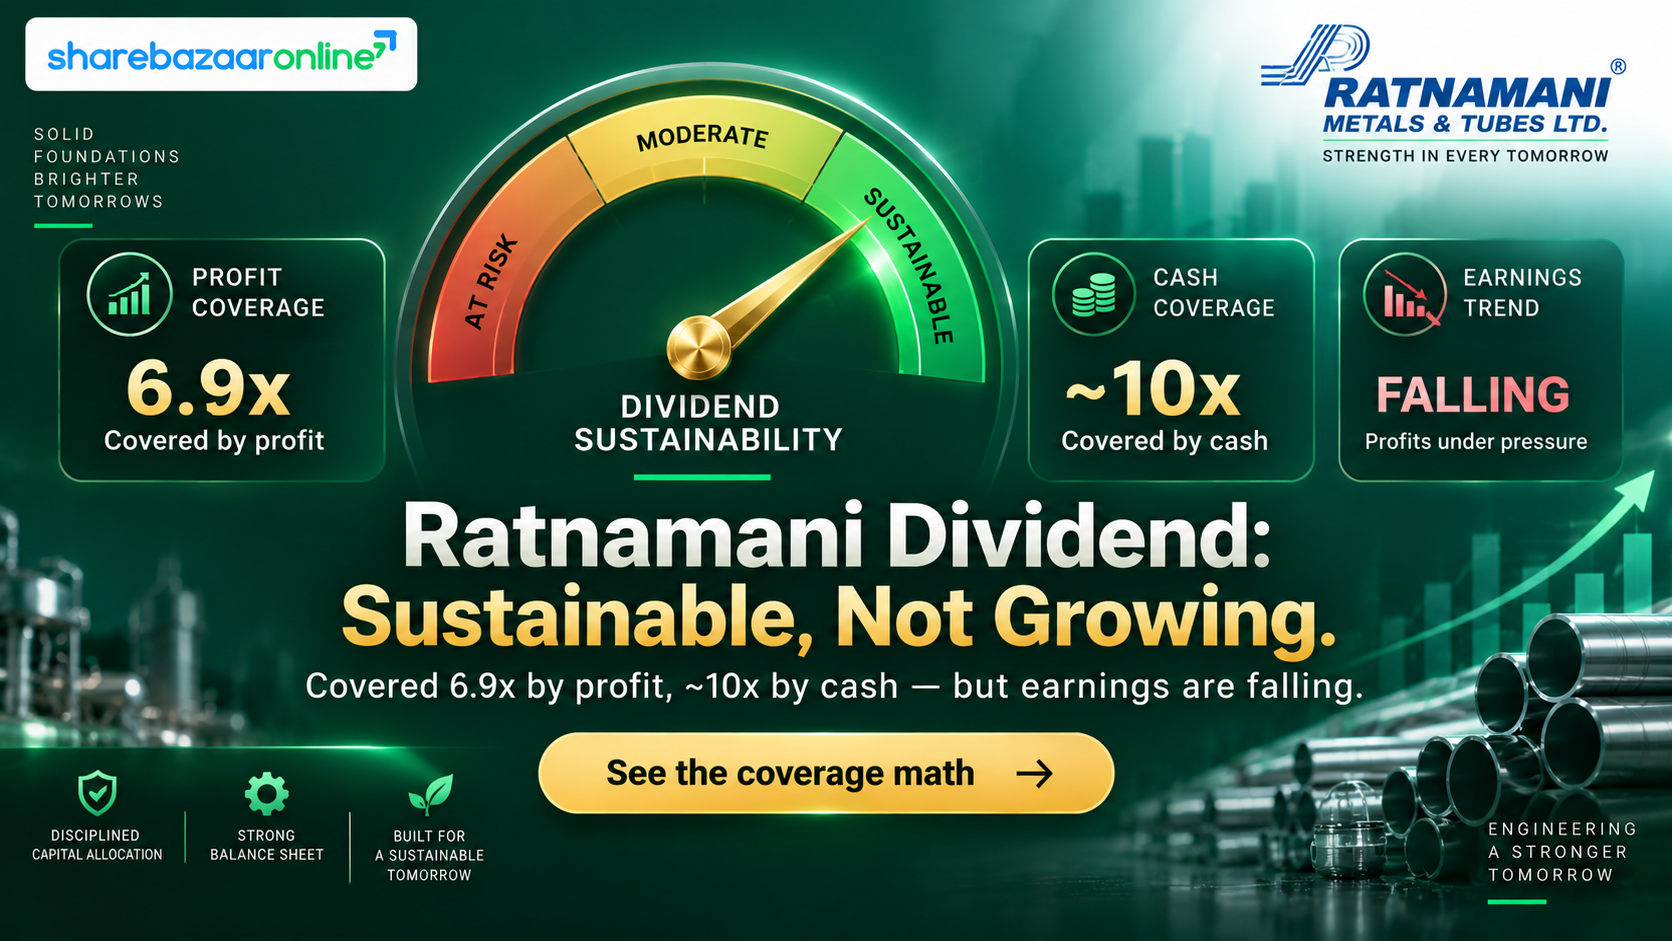
- • Dividend coverage: EPS ₹68.85 ÷ DPS ₹10 = 6.9x (consolidated)
- • FCF coverage: ~9.6x standalone / ~6.4x consolidated
- • Cash coverage: ~10.1x
- • Debt: net-cash at both levels
Verdict: SUSTAINABLE. The ₹10 dividend is comfortably covered by earnings, free cash flow and cash reserves several times over. The company can easily afford this payment even if profits fall further.
The nuance: "sustainable" is not the same as "growing." The cut from ₹14 to ₹10 shows management will flex the absolute rupee dividend down with earnings while keeping the payout ratio low to protect its expansion war-chest. Income investors should expect the dividend to track the profit cycle, not rise every year.
Peer Comparison
| Company | Latest Dividend / Sh | Dividend Yield | Payout Ratio | P/E |
|---|---|---|---|---|
| Ratnamani Metals & Tubes | ₹10.00 | ~0.37% | ~14.5% | ~33–38x |
| Maharashtra Seamless | ₹10.00 | ~1.5–1.6% | ~19% | ~12x |
| APL Apollo Tubes | ₹8.50 | ~0.40% | Not Disclosed by Company | High (growth) |
Peer figures sourced from Simply Wall St, TipRanks, Tickertape and INDmoney (2026). Approximate and for context only.
Takeaway: Among pipe/tube peers, Maharashtra Seamless is the income choice — roughly 4x Ratnamani's yield, a ~19% payout, and a much cheaper ~12x P/E. Ratnamani and APL Apollo are both low-yield "growth compounders" priced at premium multiples, where the dividend is a token return and the thesis rests on earnings expansion, ROCE and balance-sheet quality rather than cash payout.
Promoter Impact Analysis
- • Promoter holding: 59.77%
- • FII holding: ~10.7%
- • DII / Mutual Fund holding: ~19.1%
- • Public: ~10.4%
Shareholding as per latest available pattern (Bajaj Finserv / IIFL, 2026). Promoters (M.N. Sanghvi family) hold shares with zero encumbrance.
Who gets the ₹70.09 Cr?
- • Promoters: 59.77% × ₹70.09 Cr = ~₹41.90 Cr
- • Public + institutions: ~₹28.19 Cr
Because the payout ratio is only ~14.5%, the promoter family is not stripping cash out of the company. The bulk of profit is retained and reinvested, which aligns promoter and minority interests around compounding book value rather than maximising dividend income.
Taxation Analysis
How dividends are taxed in India:
- • Dividend is fully taxable in the hands of the investor at their income-tax slab rate.
- • The company deducts TDS at 10% if total dividend paid to a resident exceeds ₹5,000 in a financial year (higher / 20% without PAN).
- • TDS is only an advance tax; the final liability is your slab rate, adjusted at return filing.
Worked example (1,000 shares, 30% slab):
- • Gross dividend: 1,000 × ₹10 = ₹10,000
- • TDS @10% withheld: ₹1,000
- • Total tax @30% slab: ₹3,000
- • Net in hand: ₹7,000
- • Effective post-tax yield (@~₹2,700): ≈0.26%
Illustrative; not tax advice. Actual liability depends on your total income and slab.
Key Risks
- 1. Earnings-linked dividend cut already happening. The payout dropped from ₹14 to ₹10 (-28.6%). If profits keep sliding (Q1 FY27 PAT already -37.7% YoY), the rupee dividend can fall further, even though it remains "covered."
- 2. Demand / order-cycle sensitivity. Revenue is highly cyclical — standalone sales fell 24.3% in FY26. End-markets like oil & gas, refineries and power drive lumpy order flows.
- 3. Raw-material price volatility. Stainless steel, nickel and carbon-steel input costs swing margins sharply; FY26 profit held only because material costs fell with revenue, not from pricing power.
- 4. Rising consolidated debt from expansion. Group borrowings roughly doubled to ~₹304 Cr for subsidiary / Saudi (KSA) capacity; execution and demand risk on new capex could pressure returns.
- 5. Very low yield + premium valuation. At ~33–38x P/E and ~0.37% yield, the stock offers almost no income cushion; any earnings disappointment is felt entirely through the share price.
- 6. Working-capital normalisation. This year's bumper cash flow was aided by a one-off receivables/inventory release that reverses when the company grows again.
What To Monitor
- 1. Quarterly revenue & order book — whether the FY26 de-growth reverses, especially in the core Steel Tubes & Pipes segment (93% of revenue) and new export orders (e.g. the reported ~USD 286m subsidiary orders).
- 2. EBITDA margin trend — is profit protected by pricing/mix or only by falling input costs? Watch employee-cost and other-expense growth against revenue.
- 3. Next year's dividend vs earnings — does management restore ₹14 as profits recover, or keep the payout ratio pinned near ~15%?
- 4. Consolidated debt trajectory — whether Saudi / subsidiary capex keeps lifting borrowings and how quickly the new capacity earns its keep (ROCE on new investment).
- 5. Free cash flow quality — whether operating cash flow stays strong once working capital normalises with renewed growth.
Conclusion
Ratnamani Metals & Tubes' FY2025-26 final dividend of ₹10 per share (500%) is best understood as a disciplined, cash-rich, but reduced payout. The good news is unambiguous: the dividend is covered ~6.9x by earnings, ~9.6x by standalone free cash flow and ~10x by cash reserves, on a balance sheet that is effectively debt-free at the standalone level and net-cash at the group level. Auditors gave a clean opinion, and promoters hold 59.77% with no pledges.
The cautionary news is equally clear: the payout was cut 28.6% from ₹14 because profits fell (consolidated PAT -11.3%, standalone -24.9%), the headline profit resilience leaned on a doubling of treasury income, and this year's stellar cash flow was partly a de-growth effect that will normalise. At ~0.37% yield and a premium multiple, this is a growth stock that happens to pay a small dividend — not an income stock. The positives, negatives, risks and monitoring points are laid out above for you to weigh against your own goals.
Frequently Asked Questions
What dividend has Ratnamani Metals & Tubes announced for FY2025-26?
What is the dividend yield on Ratnamani shares?
What is the record date for the Ratnamani dividend?
What is the ex-dividend date?
When will the Ratnamani dividend be paid?
Who is eligible for the dividend?
How is the Ratnamani dividend taxed?
Is the Ratnamani dividend sustainable?
Why did Ratnamani cut its dividend from ₹14 to ₹10?
What is Ratnamani's dividend history?
How much dividend income do promoters receive?
What should investors monitor going forward?
Is Ratnamani a good dividend stock for income?
Disclaimer
This article is for informational and educational purposes only and does not constitute investment, financial, legal or tax advice, nor a recommendation to buy, sell or hold any security. Figures marked from the company filing are taken from Ratnamani Metals & Tubes Limited's Board Meeting Outcome and audited results dated May 15, 2026; market prices, shareholding, dividend history and peer data are from third-party sources (Screener, INDmoney, TipRanks, Simply Wall St, Tickertape, Bajaj Finserv and others) and may change. Computed ratios are estimates and may differ from other data providers' definitions. Investors should verify all figures independently and consult a SEBI-registered financial advisor before making any investment decision. ShareBazaar Online and the author are not liable for any loss arising from the use of this information.