
Dividend Snapshot
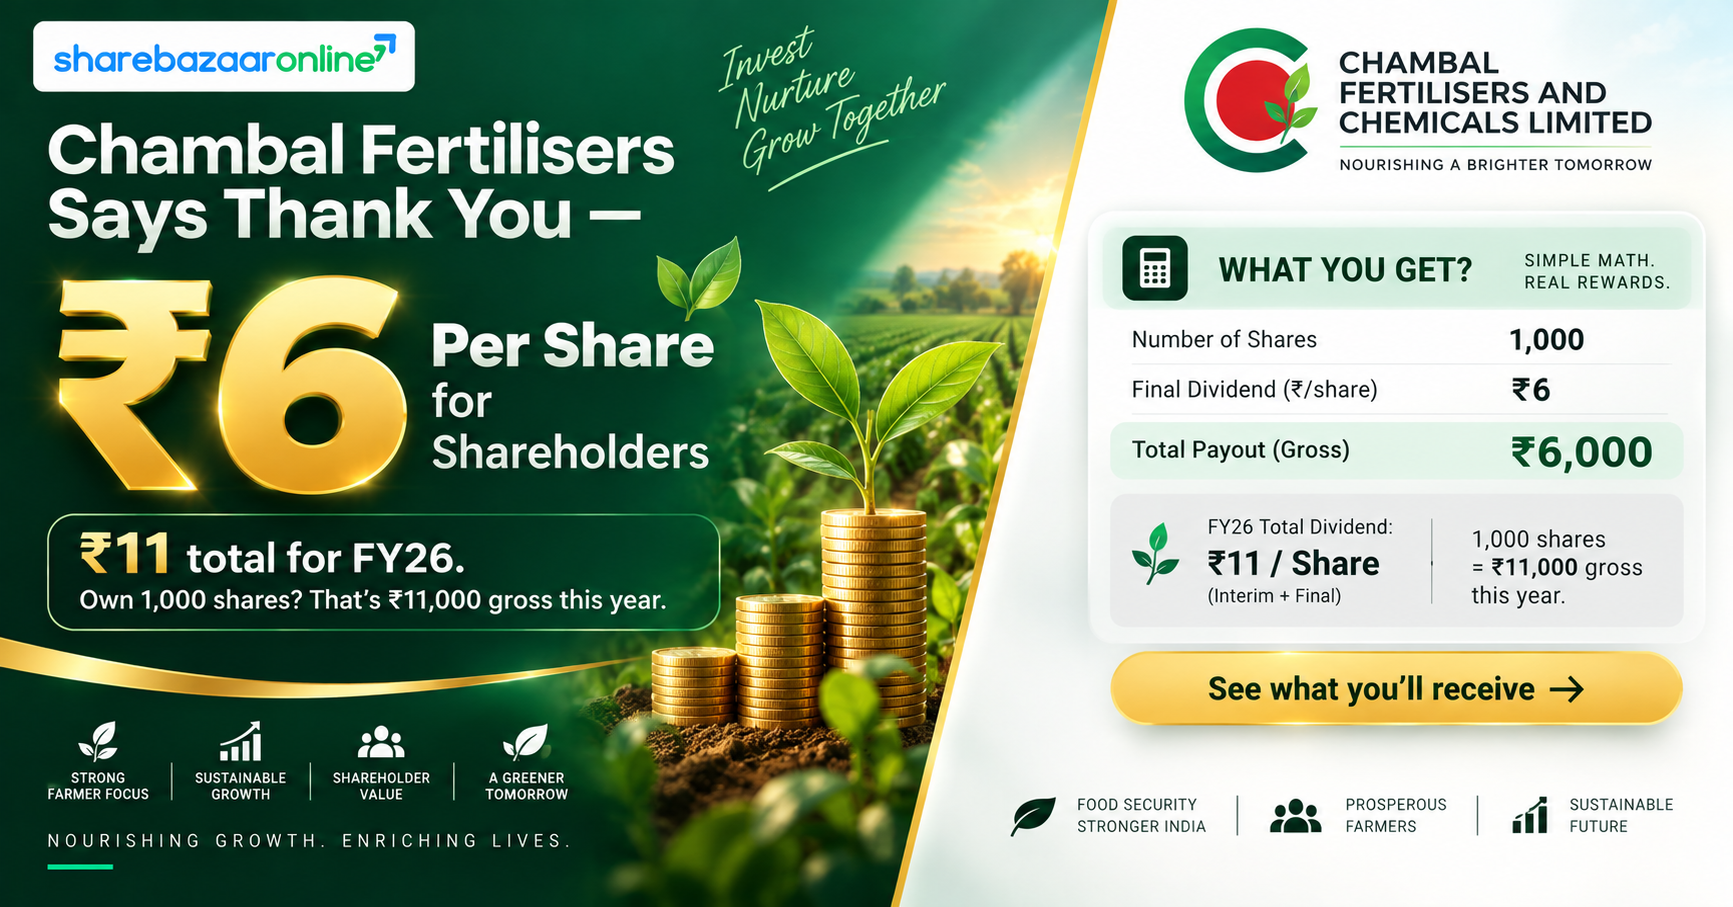
Chambal Fertilisers and Chemicals Limited (NSE: CHAMBLFERT | BSE: 500085) has declared a final dividend of ₹6.00 per equity share (60% of ₹10 face value) for the financial year ended March 31, 2026 (FY26). The dividend was recommended by the Board on 14 May 2026 and approved by shareholders at the AGM held on 1 September 2026. Combined with the ₹5.00 interim dividend paid earlier in the year, the total FY26 payout works out to ₹11.00 per share.
Final Dividend Per Share
₹6.00
60% on ₹10 face value
Final Dividend Yield
~1.41%
on 14-May-2026 close of ₹424.60
FY26 Total Dividend
₹11.00
₹5 interim + ₹6 final
Trailing 12-Month Yield
~2.68%
₹11 on latest CMP ~₹410
Record Date & Ex-Date
11-Aug-2026
Eligibility cut-off
Dividend Type
Final
FY2025-26
Note: The current market price (CMP) of ~₹410 is referenced from public market data as of early September 2026 (Source: 5paisa, Screener). All financial figures below are drawn from the company's audited FY26 results filed with BSE/NSE on 14 May 2026 unless a source is cited.
Dividend Announcement Summary
At its meeting on 14 May 2026 (14:30–16:05 IST), the Board of Directors of Chambal Fertilisers recommended a final dividend of ₹6.00 per share alongside its audited FY26 results. This is a company that primarily manufactures urea at its three plants in Gadepan, Rajasthan, and also markets DAP, MOP, NPK, speciality plant nutrients and crop-protection chemicals, with a phosphoric-acid joint venture (IMACID) in Morocco.
Company & Security Details
- Company: Chambal Fertilisers and Chemicals Ltd
- NSE Symbol: CHAMBLFERT
- BSE Code: 500085
- ISIN: INE085A01013
- CIN: L24124RJ1985PLC003293
- Face Value: ₹10 per share
Dividend Details
- Type: Final Dividend
- Amount: ₹6.00 per share (60%)
- Financial Year: FY2025-26
- Board Recommendation: 14 May 2026
- AGM Approval: 1 September 2026 (approved)
- Final Dividend Outflow: ~₹240.39 Cr
The filing carried an unmodified (clean) audit opinion from Price Waterhouse Chartered Accountants LLP on both standalone and consolidated results. The ₹6.00 final dividend was declared "subject to the approval of the shareholders" — an approval that has since been granted at the 41st AGM on 1 September 2026 (Source: company AGM outcome filing).
Key Dates Timeline
Announcement Date
14 May 2026
Board meeting & results filing
Record Date
11 August 2026
Shareholders on record eligible
Ex-Dividend Date
11 August 2026
Same as record date (T+1 regime)
AGM Date
1 September 2026
Dividend approved by shareholders
Payment Date
Within 30 days of AGM
By ~30 September 2026 (statutory)
Record date and AGM date are sourced from the company's Regulation 42 intimation to the exchanges (Source: exchange filing, July 2026). Because a final dividend is paid only after AGM approval, the exact credit date follows the AGM; the Companies Act requires payment within 30 days of declaration.
Dividend Yield Analysis
Yield tells you the cash return on your investment. For a final dividend, it matters which price you measure against. Here is how the ₹6.00 final dividend, and the full ₹11.00 FY26 payout, stack up.
Final Dividend Yield
- On announcement-day close (₹424.60): 1.41%
- On latest CMP (~₹410): 1.46%
₹6 ÷ price × 100
Trailing 12-Month Yield
- FY26 total ₹11 on CMP ~₹410: 2.68%
- Sector average yield: ~0.8% – 1.6% (Source: TipRanks/Simply Wall St)
Chambal's yield sits well above the fertiliser-sector average.
Yield Reality Check — why the yield looks attractive
The trailing yield of ~2.68% is genuinely above sector norms, but part of the reason is price weakness, not just generosity. The stock is down roughly 16% over the past year (from ~₹550 toward ~₹410) and sits near its 52-week low of ₹399.75 (52-week high ₹580.70) (Source: Value Research, 5paisa). When the price falls, the yield mechanically rises. That said, the dividend itself has grown — from ₹10 (FY25) to ₹11 (FY26) — so the higher yield is a genuine mix of dividend growth and a de-rated share price, not a distress signal.
Dividend History Analysis
| Financial Year | Interim | Final | Total (₹/share) |
|---|---|---|---|
| FY2025-26 | ₹5.00 | ₹6.00 | ₹11.00 |
| FY2024-25 | ₹5.00 | ₹5.00 | ₹10.00 |
| FY2023-24 | ₹4.50 | ₹3.00 | ₹7.50 |
| FY2022-23 | ₹4.50 | ₹3.00 | ₹7.50 |
| FY2021-22 | ₹4.50 | ₹3.00 | ₹7.50 |
| FY2020-21 | ₹3.00 | ₹4.50 | ₹7.50 |
Source: TipRanks / Simply Wall St dividend history. Interim/final split is grouped by the financial year to which the dividend relates.
Consistency & Trend
Chambal has been a long-standing dividend payer. Over the longer arc, the annual payout has climbed from roughly ₹1.90 in FY2014 to ₹11.00 in FY2026 — an average growth of around 15% a year over the past decade (Source: Simply Wall St). The step-up from ₹7.50 (FY21–FY24) to ₹10.00 (FY25) and ₹11.00 (FY26) reflects stronger urea-plant efficiency and profitability. However, the payout has also been volatile in the past, with at least one dividend cut in the last ten years, so it is best described as a consistent payer with a cyclical, earnings-linked element rather than a perfectly smooth grower.
Financial Performance Analysis
FY26 Headline Numbers (Consolidated)
- Revenue from Operations: ₹20,793.66 Cr (+24.9% YoY)
- Total Income: ₹20,920.51 Cr
- Net Profit (PAT): ₹1,953.27 Cr (+18.4% YoY)
- EPS (Basic/Diluted): ₹48.76
- Share of JV (IMACID) profit: ₹128.81 Cr
Standalone Comparison (FY26 vs FY25)
- Revenue: ₹20,793.66 Cr vs ₹16,646.20 Cr
- PAT: ₹1,949.67 Cr vs ₹1,656.79 Cr (+17.7%)
- EPS: ₹48.66 vs ₹41.35
- Other Equity: ₹9,786.64 Cr vs ₹8,133.81 Cr
Operating Leverage — where the growth leaked
Revenue jumped nearly 25%, but profit did not keep pace at the operating level. Estimated EBITDA rose only ~7.8% to about ₹2,679 Cr (from ~₹2,484 Cr), so the EBITDA margin compressed by roughly 200 basis points, from ~14.9% to ~12.9%. The main reason is visible in the cost lines: Purchases of Stock-in-Trade more than doubled to ₹7,784.85 Cr (from ₹3,426.28 Cr). A large part of FY26 revenue growth came from lower-margin traded (bought-out) fertilisers rather than higher-margin own-manufactured urea, which dilutes blended margins. Reported PAT still grew ~17.7%, but that was helped by a tax swing — a deferred-tax credit of ₹133.66 Cr in FY26 versus a deferred-tax charge of ₹347.73 Cr in FY25 — not purely by operating strength.
Cash Flow Analysis
Reported profit is an accounting opinion; cash is a fact. This is the most important section for a dividend, and it is where FY26 throws up a clear caution flag.
Operating Cash Flow vs Profit
- Net Profit (standalone): ₹1,949.67 Cr
- Operating Cash Flow (FY26): ₹138.67 Cr
- OCF in FY25 (for context): ₹1,394.84 Cr
- Cash conversion (OCF ÷ PAT): ~0.07x
Red flag: operating cash flow collapsed ~90% and covers only a fraction of reported profit.
Free Cash Flow
- Operating Cash Flow: ₹138.67 Cr
- Capex (PP&E + intangibles): ~₹892 Cr
- Free Cash Flow (FY26): ≈ –₹747 Cr (negative)
The FY26 dividend was not funded by current free cash flow.
Why cash flow was weak — receivables ballooned
The cash squeeze was driven by working capital, not losses. Trade Receivables on the balance sheet jumped to ₹2,075.20 Cr from ₹367.92 Cr — a ~5.6x rise — and inventories rose ₹483.96 Cr. In the cash-flow statement, the increase in trade receivables alone consumed ₹1,827.56 Cr. For a urea maker, a large chunk of receivables is typically subsidy dues from the Government of India that were outstanding at year-end. This is a timing issue rather than a solvency issue, but it means the dividend for FY26 was effectively funded from cash reserves and short-term borrowings rather than the year's own cash generation. If subsidy collections normalise in FY27, cash flow should recover — that is the single biggest thing to watch.
Balance Sheet Strength
Liquidity & Net Debt (Standalone)
- Cash & Cash Equivalents: ₹306.96 Cr
- Current Investments: ₹503.39 Cr
- Other Bank Balances: ₹236.45 Cr
- Total liquid assets: ~₹1,046.80 Cr
- Short-Term Borrowings: ₹963.07 Cr (nil in FY25)
Leverage & Returns
- Total Equity: ₹10,187.29 Cr
- Debt-to-Equity: ~0.09x (very low)
- Net position: near net-cash including current investments
- ROE: ~19–21% (~18.8% as reported by Screener)
- ROCE: ~20%+ (Company/Screener)
The balance sheet remains fundamentally strong: no long-term borrowings, high ROE/ROCE, and liquid assets roughly matching gross debt. The one change to note is that short-term borrowings rose from nil to ₹963.07 Cr in FY26 — again, a direct consequence of the working-capital build-up rather than structural leverage. Net of current investments, the company is close to debt-free.
Dividend Sustainability Analysis
Coverage Metrics
- Final dividend outflow: ~₹240.39 Cr
- FY26 total dividend outflow: ~₹440.72 Cr
- Dividend Payout Ratio (FY26 total ÷ PAT): ~22.6%
- Dividend Coverage (EPS ÷ DPS): ~4.4x
- Cash coverage (liquid ÷ FY26 dividend): ~2.4x
Verdict
On earnings, the dividend is comfortably covered — a low ~22.6% payout leaves ~77% of profit retained. On cash, FY26 was weak: FCF was negative and the payout leaned on reserves/short-term debt.
Classification: Sustainable on earnings, with a near-term cash-flow caveat (Moderately Sustainable until working capital normalises).
The key sustainability question is not "can profits fund it?" (they clearly can, 4.4x over) but "will cash generation recover?" A low payout ratio and strong ROE give plenty of headroom, and the company has a long payment record. The watch-item is the receivables/subsidy cycle: a repeat of FY26's cash squeeze in FY27 would mean continued reliance on borrowings to maintain payouts.
Peer Comparison
| Company | P/E | ROE | Div. Yield |
|---|---|---|---|
| Chambal Fertilisers | ~9.0 | ~18.8% | ~2.7% |
| Coromandel International | ~34 | ~15.6% | ~0.1–0.5% |
| Deepak Fertilisers | ~26 | good | ~0.7% |
| GSFC | ~9.3 | ~5.5% | ~1–2% |
Source: Screener, MarketsMojo, Univest, Simply Wall St (FY26/latest). Figures are approximate and change with price.
On this screen Chambal looks like a value-plus-quality outlier: it pairs one of the lowest P/E multiples (~9x) with the highest ROE (~18.8%) and the highest dividend yield (~2.7%) among these peers. Coromandel and Deepak trade at far richer multiples but yield very little. GSFC is similarly cheap but earns a much lower return on equity. The trade-off: Chambal is a urea-heavy, subsidy-linked, cyclical business, which is exactly why the market awards it a lower multiple and why its cash flows can be lumpy.
Promoter Impact Analysis
Shareholding Pattern (as of Jun 2026)
- Promoters: ~61.25%
- FIIs: ~15.1%
- DIIs / Mutual Funds: ~4–5%
- Public / Retail: ~18.3%
Source: Choice, Angel One, Kotak Neo
Promoter Dividend Income
- From final ₹6 dividend: ~₹147.2 Cr
- From FY26 total ₹11: ~₹269.9 Cr
61.25% of the ~₹440.72 Cr total FY26 outflow accrues to the promoter group.
With a high ~61% promoter holding, roughly ₹6 of every ₹10 distributed flows to promoters. This is normal for a promoter-led company and generally aligns promoter and minority interests — both benefit proportionally per share. The flip side of a cyclical, subsidy-linked cash cycle is that dividends funded partly by borrowings in a weak-cash year transfer value out of the company; minority holders should therefore weigh the buyback/retention alternatives discussed below. There were no new share encumbrances created on promoter holdings during FY26 (Source: SAST disclosure to exchanges).
Taxation Analysis
How dividends are taxed in India
Since April 2020, the Dividend Distribution Tax (DDT) has been abolished. Dividends are now taxable in the hands of the investor at their applicable income-tax slab rate. The company deducts TDS at 10% under Section 194 if the total dividend paid to a shareholder in a financial year exceeds ₹10,000 (this threshold was raised from ₹5,000 in Union Budget 2025, effective FY2025-26). If PAN is not furnished, TDS is 20%. The TDS is an advance — the final liability is settled at your slab rate when you file your return.
Worked Example — 1,000 shares, 30% slab
- Shares held: 1,000
- FY26 dividend received: 1,000 × ₹11 = ₹11,000 (gross)
- TDS @ 10% (as ₹11,000 > ₹10,000): ₹1,100 deducted at source
- Tax at 30% slab + 4% cess (31.2%): ₹3,432
- Net dividend in hand after tax: ₹7,568
- Effective post-tax yield (at CMP ~₹410 → investment ₹4,10,000): ~1.85%
For the ₹6 final dividend alone (₹6,000 on 1,000 shares), no TDS applies if it is below the ₹10,000 annual threshold, but the amount is still taxable at slab.
Key Risks
- Subsidy / receivables cycle: Trade receivables surged to ₹2,075 Cr from ₹368 Cr, driven largely by government subsidy timing. Delayed subsidy release directly squeezes cash flow and can force reliance on borrowings.
- Margin compression: EBITDA margin fell ~200 bps to ~12.9% as growth came from lower-margin traded fertilisers. A greater tilt toward trading over own-manufactured urea could keep blended margins under pressure.
- Policy dependence: Urea economics are set by the New Urea Policy, NBS rates and freight/energy norms. Any adverse change to subsidy or gas-pricing policy hits realisations.
- Input & energy cost volatility: Natural gas, ammonia and sulphur prices — plus geopolitics in the Middle East — swing the cost base. Indian fertiliser stocks have already reacted to such tensions in 2026.
- Cyclicality & monsoon: Demand depends on the agricultural cycle and monsoon; a weak or delayed monsoon dents volumes.
- Litigation: An income-tax penalty of ~₹96.9 Cr was upheld at the Commissioner (Appeals) level, which the company intends to contest (Source: exchange disclosures).
What To Monitor
- Operating cash flow recovery in FY27: Watch whether OCF rebounds from FY26's ₹138.67 Cr as subsidy dues are collected. This is the single most important dividend-health signal.
- Trade receivables trend: A fall back toward historical levels would confirm the FY26 spike was timing, not deterioration.
- New Technical Ammonium Nitrate (TAN) ramp-up: The company commenced TAN, Weak Nitric Acid and HDAN production at Gadepan in August 2026 — a diversification beyond subsidy-linked fertilisers. Track capacity utilisation and margins from this new stream.
- Short-term borrowings: Watch whether the ₹963 Cr of short-term debt is repaid as working capital unwinds, or becomes a recurring feature.
- Payout-ratio trajectory: With payout at only ~22.6%, there is room to raise dividends — monitor whether future increases are backed by cash, not just profit.
- Quarterly margins & urea policy: Q1FY27 already showed revenue down ~12% with PAT up ~10% — track how the FY27 urea policy and product mix shape margins.
Conclusion
Positives
- Dividend grown to ₹11 (FY26) from ₹10 (FY25)
- Low payout ~22.6%; strong ~4.4x earnings cover
- High ROE (~18.8%) at a low P/E (~9x)
- Very low leverage; near net-cash on current investments
- Above-sector dividend yield (~2.7% trailing)
- New TAN/HDAN capacity diversifies the revenue base
Negatives / Watch-outs
- FY26 operating cash flow collapsed ~90%
- Free cash flow was negative (~–₹747 Cr)
- Dividend leaned on reserves/short-term debt
- EBITDA margin compressed ~200 bps
- Heavy subsidy/receivables and policy dependence
- Share price near 52-week low; ~16% one-year fall
The ₹6 final dividend caps a year in which Chambal Fertilisers grew profits and rewarded shareholders more generously — while quietly running through its cash. On the numbers, the payout is well within earnings and the balance sheet is sturdy; the qualifier is that FY26's cash generation was unusually weak because of a large, likely temporary, subsidy-receivables build-up. Whether the strong-earnings/weak-cash pattern reverses in FY27 is the crux for income-focused investors. The positives, negatives, risks and monitoring points above are laid out so you can weigh them for your own situation.
Frequently Asked Questions
What dividend has Chambal Fertilisers announced for FY26?
What is the Chambal Fertilisers dividend yield?
What is the record date for the Chambal Fertilisers dividend?
What is the ex-dividend date?
When will the Chambal Fertilisers dividend be paid?
Who is eligible to receive this dividend?
How is the Chambal Fertilisers dividend taxed?
Is the Chambal Fertilisers dividend sustainable?
What is Chambal Fertilisers' dividend history?
What should investors monitor after this dividend?
How much dividend outflow does the ₹6 dividend represent?
How does Chambal's dividend compare with peers?
Disclaimer
This article is published by ShareBazaar Online for informational and educational purposes only and does not constitute investment, financial, legal or tax advice, nor a buy, sell or hold recommendation. Figures relating to the dividend and FY26 results are taken from Chambal Fertilisers and Chemicals Limited's audited filings dated 14 May 2026; market prices, ratios, shareholding and peer data are sourced from public providers (including Screener, Value Research, 5paisa, TipRanks, Simply Wall St, Choice and Angel One) and may change. Some ratios are our own estimates and are marked as approximate. Securities markets are subject to risk; past dividends and performance do not guarantee future outcomes. Please verify all data independently at nseindia.com / bseindia.com and consult a SEBI-registered advisor before investing. ShareBazaar Online is not liable for any loss arising from the use of this information.