
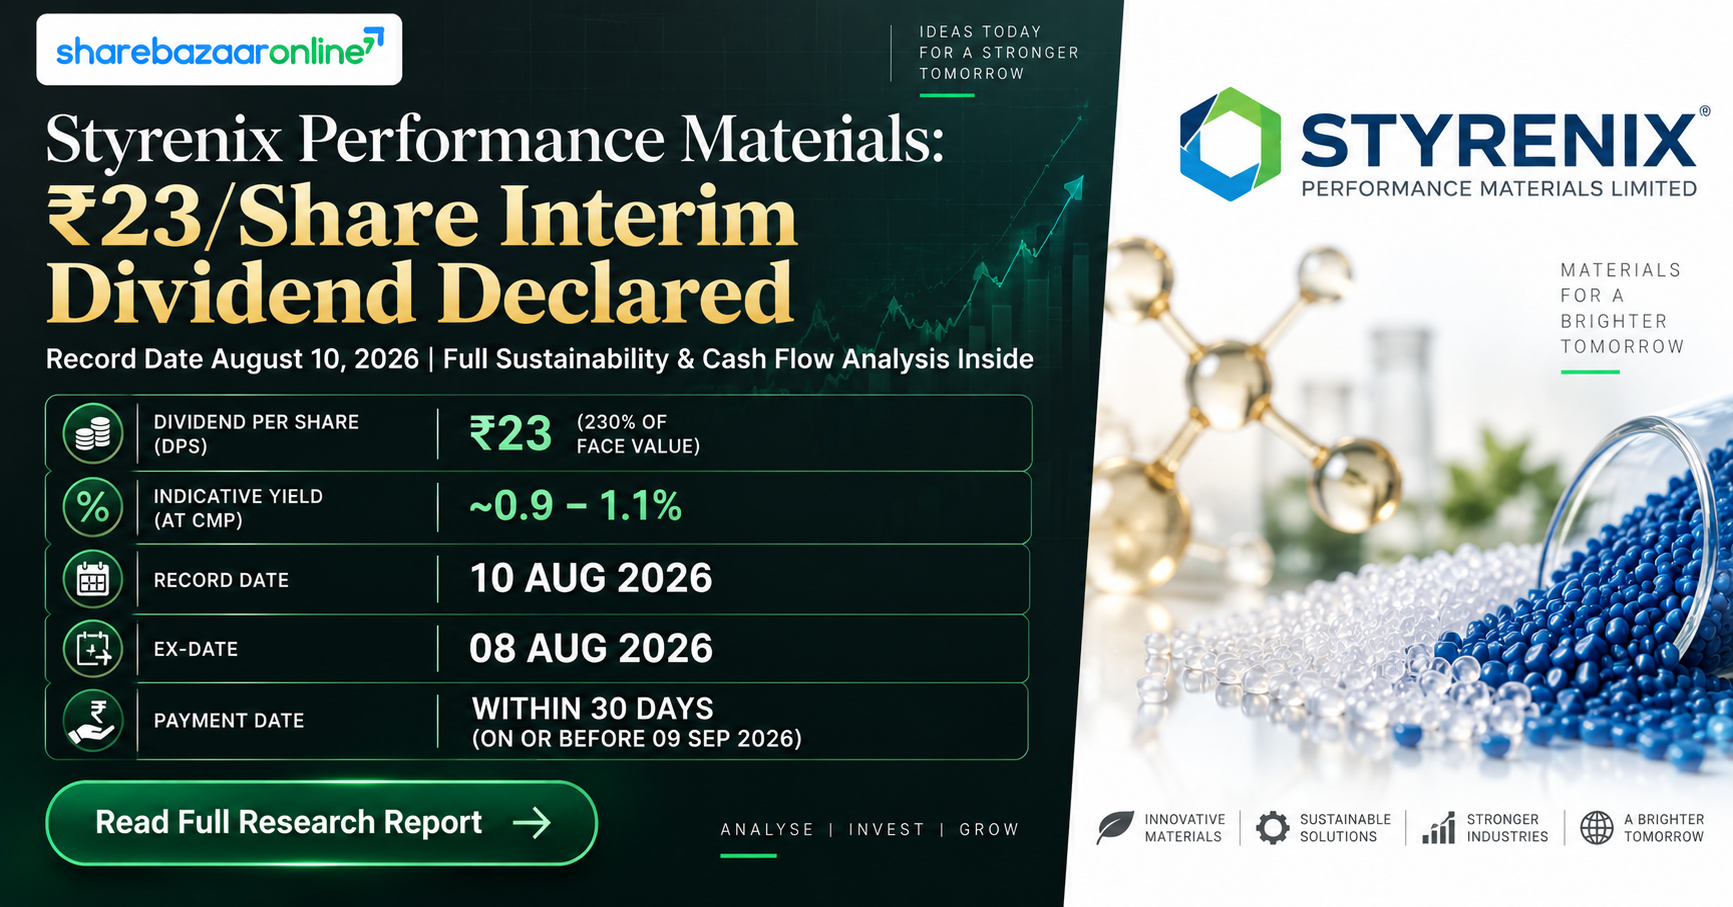
Dividend Snapshot
Company
Styrenix Performance Materials Limited
(Formerly INEOS Styrolution India Limited)
Dividend Declared
₹23 per share (230% of Face Value)
Interim Dividend for FY 2026-27
Record Date
Monday, August 10, 2026
Ex-Date (T+1 Inferred)
Monday, August 10, 2026
Inferred from T+1 settlement convention; confirm against official NSE/BSE circular
CMP on Announcement Date (04-Aug-2026)
₹2,488.60 (NSE)
Announcement-Day Dividend Yield
0.92%
₹23 ÷ ₹2,488.60
Face-value yield illusion check: The headline "230%" figure refers to the dividend as a percentage of the ₹10 face value, not the market price. On the actual announcement-day market price of ₹2,488.60, the real dividend yield works out to approximately 0.92% — a fraction of the eye-catching 230% headline number.
Dividend Announcement Summary
Styrenix Performance Materials Limited (NSE: STYRENIX, BSE: 506222), formerly known as INEOS Styrolution India Limited, informed exchanges on August 04, 2026 that its Board of Directors, at a meeting that commenced at 11:50 hours (IST) and concluded at 12:45 hours (IST), approved the unaudited standalone and consolidated financial results for Q1 FY2026-27 (quarter ended June 30, 2026) and declared an Interim Dividend of ₹23 per equity share (230%) on equity shares of ₹10 face value each, for the financial year 2026-27.
Filing Particulars
- NSE Symbol: STYRENIX
- BSE Scrip Code: 506222
- ISIN: INE189B01011
- CIN: L25200GJ1973PLC002436
- Regulation Cited: Regulation 30 & 33, SEBI (LODR) Regulations, 2015
Approving Authority
Signed by Chintan Doshi, Manager Legal & Company Secretary. Financial results signed off by Rakesh S. Agrawal, Chairman (DIN: 00057955). Auditors: Talati & Talati LLP (FRN 110758W/W100377) issued an unmodified Limited Review conclusion on both standalone and consolidated results.
Note on AGM approval status: As this is an Interim Dividend, it is declared directly by the Board and does not require shareholder/AGM approval before payment. It is distinct from the company's 53rd AGM scheduled for August 27, 2026, which pertains to approval of FY2025-26 annual accounts and other ordinary business, not this interim dividend.
Key Dates Timeline
Board Meeting / Announcement Date
August 04, 2026
Record Date
August 10, 2026 (Monday)
Ex-Date
August 10, 2026 (Inferred, T+1)
Payment Date
Not Disclosed by Company
Statutory outer limit under Companies Act, 2013 (Section 123/127): on or before September 03, 2026 (30 days from declaration)
Pre-publish flag: The ex-date shown above is inferred from the T+1 settlement convention followed on Indian exchanges (ex-date typically coincides with record date). This must be cross-verified against the official NSE/BSE corporate-action circular before publishing, as circulars occasionally specify a distinct ex-date.
Dividend Yield Analysis
Face Value Dividend %
230%
₹23 ÷ ₹10 face value
Real Market Yield (Announcement-Day CMP)
0.92%
₹23 ÷ ₹2,488.60
Live CMP Re-Verification Required
As of the most recently available closing price (₹2,009, 03-Sep-2026, NSE), the trailing dividend yield on this single tranche works out to approximately 1.15%. On a trailing-twelve-month basis (dividends of ₹77-₹95 paid across FY25-26 and this tranche), Screener.in lists the standing dividend yield at 2.69% against the current price. Because CMP moves daily, all yield figures in this article are price-dependent and must be re-verified against the live NSE/BSE quote immediately before publishing.
Yield Reality Check
The stock has fallen from a 52-week high of roughly ₹2,724-2,932 to the current ₹2,000-2,010 band — a decline of over 25% in the last year. Part of the trailing yield's rise versus a year ago is therefore a function of a falling share price rather than solely rising dividend generosity, even though the FY25-26 payout in absolute rupee terms was genuinely higher (₹54/share for the year) than in several earlier years. Investors should not read a rising yield in isolation as purely a sign of dividend strength.
Dividend History Analysis
| Ex-Date | Type | Amount (₹/share) | % of Face Value |
|---|---|---|---|
| 10-Aug-2026 (this dividend) | Interim | 23.00 | 230% |
| 05-Feb-2026 | Interim (2nd) | 23.00 | 230% |
| 21-Aug-2025 | Interim | 31.00 | 310% |
| 17-Dec-2024 | Interim | 31.00 | 310% |
| 12-Aug-2024 | Final | 28.00 | 280% |
| 12-Feb-2024 | Interim | 48.00 | 480% |
| 31-Oct-2023 | Interim | 22.00 | 220% |
| 02-Aug-2023 | Final | 24.00 | 240% |
| 24-Mar-2023 | Interim | 80.00 | 800% |
| 06-Jun-2022 | Interim | 105.00 | 1050% |
| 22-Oct-2021 | Special | 192.00 | 1920% |
| 05-Aug-2021 | Final | 10.00 | 100% |
| 31-Jul-2019 | Final | 2.00 | 20% |
| 01-Aug-2018 | Final | 4.00 | 40% |
| 02-Aug-2017 | Final | 4.00 | 40% |
Source: Exchange corporate-action filings, compiled via Trendlyne/NSE-BSE disclosures (Not Independently Verified in full against original circulars for pre-2021 entries). No stock splits or bonus issues identified in the disclosed history; equity capital held stable at ₹17.59 Cr across the disclosed period.
Consistency Classification: Irregular-to-Cyclical Payer, Trending Toward Multi-Tranche Regularity
Between FY2015-16 and FY2019-20, Styrenix paid modest annual final dividends of ₹2-4/share. FY2020-21 saw no dividend disclosed in the compiled history (a gap coinciding with pandemic-era caution), followed by a sharp step-up from FY2021-22 onward, including a one-off Special Dividend of ₹192/share in October 2021 — almost certainly linked to a one-time cash event and not representative of recurring capacity. Since FY2022-23, the company has shifted to a pattern of multiple interim tranches per year (2-3 tranches), with FY2025-26 aggregating ₹54/share and the current FY2026-27 already carrying a ₹23/share first tranche. No dividend cuts are evident in the post-FY2021 regime, though the per-tranche quantum has varied considerably (₹22 to ₹105), reflecting profit volatility rather than a smooth progression.
Financial Performance Analysis
Q1 FY2026-27 vs Q1 FY2025-26 (Consolidated, ₹ Cr)
| Particulars | Q1 FY27 (Jun-26) | Q1 FY26 (Jun-25) | YoY Growth |
|---|---|---|---|
| Revenue from Operations | 1,010.86 | 943.50 | +7.1% |
| Operating Profit (PBDIT) | 223.59 | 99.84 | +123.9% |
| OPM % | 22.1% | 10.6% | +1,150 bps |
| Net Profit | 138.30 | 51.92 | +166.4% |
| EPS (₹, Basic & Diluted) | 78.64 | 29.52 | +166.4% |
Operating Leverage: Revenue Grew 7%, Profit Grew 166% — Why?
Revenue growth of 7.1% YoY was modest, but operating profit more than doubled and net profit grew nearly 2.7x. This is a textbook operating leverage and base-effect story: OPM expanded from 10.6% to 22.1% (a jump of over 1,150 basis points), suggesting a combination of raw material cost tailwinds (styrenics/ABS feedstock pricing) and a low base in Q1 FY26, when margins were unusually compressed. Investors should treat the 166% profit growth headline with caution — it partly reflects mean-reversion from a weak prior-year quarter rather than a structurally new margin regime. The FY2025-26 full year told a more sobering story: consolidated PAT for FY26 declined 21.8% to ₹182.85 Cr versus ₹233.72 Cr in FY25, with a particularly weak December 2025 quarter (PAT down 65.7% YoY to ₹16.34 Cr) before the sharp Q1 FY27 recovery.
Standalone vs Consolidated
Standalone Q1 FY27 PAT was ₹137.32 Cr (EPS ₹78.09) against consolidated PAT of ₹138.30 Cr (EPS ₹78.64) — the two are closely aligned, indicating the company's Dubai (FZE) and Thailand step-down subsidiaries contribute only marginally to overall profitability at this stage, though the Thailand subsidiary alone reported quarterly revenue of ₹320.90 Cr per the auditor's "Other Matters" note, reviewed by other auditors.
Cash Flow Analysis
Consolidated Cash Flow, FY2023-24 to FY2025-26 (₹ Cr)
| Particulars | FY24 | FY25 | FY26 |
|---|---|---|---|
| Cash from Operating Activity (CFO) | 216 | 54 | 183 |
| Cash from Investing Activity | -88 | -85 | -171 |
| Free Cash Flow (FCF) | 178 | -435 | 26 |
| CFO/Operating Profit % | 105% | 40% | 77% |
Cash vs Profit Divergence — Flagged Prominently
FY2025-26 Free Cash Flow of just ₹26 Cr is sharply lower than reported net profit of ₹182.85 Cr, and FY2024-25 FCF was actually negative ₹435 Cr despite a healthy PAT of ₹233.72 Cr that year. This divergence is driven primarily by rising capital expenditure — capital work-in-progress jumped from ₹29 Cr (Mar-25) to ₹105 Cr (Mar-26), and fixed assets roughly tripled from ₹295 Cr (FY24) to ₹962 Cr (FY26) — consistent with market reporting of a planned ABS capacity expansion. Reported accounting profit has therefore been running well ahead of actual free cash generation over the past two years; investors relying on PAT alone would materially overstate the company's near-term cash-funding capacity for dividends.
How Is the Dividend Being Funded?
Given FY26 FCF of only ₹26 Cr against a full-year dividend outflow of approximately ₹95 Cr, the FY2025-26 dividend was funded predominantly through a combination of current-year operating cash flow (CFO of ₹183 Cr) and, to a lesser extent, balance-sheet cash/investment reserves, rather than being fully covered by free cash flow after capex. Borrowings also rose from ₹27 Cr (FY24) to ₹548 Cr (FY26), which may indicate the company is partly financing its capacity expansion (and possibly a portion of shareholder distributions) through debt rather than exclusively internal accruals — a pattern worth monitoring rather than a definitive verdict, as loan proceeds and dividend payments are not separately earmarked in the filings.
Balance Sheet Strength
Equity Capital (Mar-26)
₹17.59 Cr
Reserves (Mar-26, Consolidated)
₹1,349 Cr
Total Borrowings (Mar-26)
₹548 Cr
Up from ₹27 Cr in FY24 and ₹397 Cr in FY25
Book Value per Share
₹777
Total consolidated liabilities/assets have grown from ₹1,038 Cr (FY24) to ₹2,483 Cr (FY26), largely funded by a mix of retained reserves (which more than doubled to ₹1,349 Cr) and a steep rise in borrowings. The debt-to-equity ratio remains moderate in absolute terms (borrowings of ₹548 Cr against reserves + capital of roughly ₹1,367 Cr, i.e. under 0.4x), and independent sources describe the company's leverage as "reasonable." Cash and liquid investments stood at approximately ₹97 Cr (consolidated, Mar-26) — a figure to be read alongside the rising debt load, since near-term dividend cash coverage now leans more on ongoing operating cash generation than on a large standing cash buffer.
Dividend Sustainability Analysis
Earnings Coverage (FY26 PAT ÷ FY26 Div Outflow)
1.93x
OCF Coverage (FY26 CFO ÷ FY26 Div Outflow)
1.93x
FCF Coverage (FY26 FCF ÷ FY26 Div Outflow)
0.27x
Cash & Investments Coverage
1.02x
Verdict: Moderately Sustainable
On an earnings and operating-cash-flow basis, the FY2025-26 dividend outflow of approximately ₹95 Cr was covered close to 1.9 times over — a comfortable margin. However, the free cash flow coverage of just 0.27x is the standout concern: once the company's ongoing capacity expansion capex is accounted for, free cash generation fell well short of the dividend paid, and the shortfall appears to have been bridged by a mix of operating cash flow timing, existing reserves, and higher borrowings. Cash and investment coverage of the tranche is right at the 1x mark, offering limited cushion. Debt has risen meaningfully (from near-zero to ₹548 Cr over two years) alongside the capex cycle. Taken together — comfortable earnings coverage, but thin free-cash-flow coverage and rising leverage during an expansion phase — the dividend is classified as Moderately Sustainable rather than fully Sustainable, contingent on the capacity expansion translating into higher future cash generation.
Peer Comparison
| Company | CMP P/E | Dividend Yield | ROE | ROCE |
|---|---|---|---|---|
| Styrenix Performance Materials | 12.9x | 2.69% | 14.2% | 13.8% |
| Supreme Petrochem | 28.2x | 1.41% | 14.1% | 18.8% |
| Bhansali Engineering Polymers | ~15-20x (NIV) | ~2.5-3.3% (NIV) | ~18% (NIV) | ~24% (NIV) |
| Sector/Specialty Chemicals Median (NIV, aggregator-sourced) | 21.6x | Not Disclosed by Company | Not Disclosed by Company | Not Disclosed by Company |
NIV = Not Independently Verified from primary company/exchange filings; sourced from third-party aggregators with mixed vintage dates. Peer figures may not reflect the same reporting date as Styrenix figures.
Styrenix trades at a notably lower P/E (12.9x) than close listed peer Supreme Petrochem (28.2x), while offering a materially higher dividend yield (2.69% vs 1.41%). Return ratios are broadly comparable to Supreme Petrochem on ROE but trail Bhansali Engineering Polymers' reported ROCE. The lower valuation multiple alongside a higher yield may reflect the market pricing in the earnings volatility and elevated capex/leverage phase Styrenix is currently navigating, rather than being a straightforward "cheap and generous" signal.
Promoter Impact Analysis
Promoter Holding (Jun-2026)
46.24%
Estimated Promoter Dividend Income (This Tranche)
₹18.71 Cr
46.24% × ₹40.46 Cr total outflow
Promoter holding has declined sharply from 75% (through FY2021-22) to 62.73% (FY23-24) and further to 46.24% from FY2024-25 onward — a reduction of roughly 28.8 percentage points over three years, coinciding with a rise in DII holding from 4.99% to 17.43% over the same window. This is a material ownership shift that retail investors should note. On the current dividend tranche, promoters stand to receive an estimated ₹18.71 Cr, while the remaining 53.76% held by institutions and the public collectively receive approximately ₹21.75 Cr. Minority shareholders' proportionate share of this dividend event has effectively risen as promoter holding has diluted, though this also reflects promoter stake sales/dilution rather than fresh minority capital infusion.
Taxation Analysis
Under current Indian income-tax law, dividends received from domestic companies are fully taxable in the hands of the shareholder at their applicable slab rate under the head "Income from Other Sources." The company is required to deduct Tax Deducted at Source (TDS) under Section 194 of the Income-tax Act at 10% where the aggregate dividend paid to a resident shareholder in a financial year exceeds the prescribed threshold, which has been raised to ₹10,000 for FY2025-26 onwards. Shareholders whose total income is below the taxable threshold can avoid TDS by submitting Form 15G (individuals below 60) or Form 15H (senior citizens) to the company/registrar, provided eligibility conditions are met.
Worked Example: Retail Investor Holding 1,000 Shares, 30% Tax Slab
| Shares Held | 1,000 |
| Dividend per Share | ₹23.00 |
| Gross Dividend Received | ₹23,000.00 |
| TDS Deducted @10% (since ₹23,000 > ₹10,000 threshold) | ₹2,300.00 |
| Net Amount Credited to Bank | ₹20,700.00 |
| Final Tax Liability at 30% Slab (on full gross dividend, at return filing) | ₹6,900.00 |
| Net Dividend After Full Slab-Rate Tax | ₹16,100.00 |
| Pre-Tax Yield (on ₹2,009 CMP) | 1.15% |
| Post-Tax Effective Yield (30% Slab) | 0.80% |
The ₹2,300 TDS deducted is adjustable against final tax liability when filing the income-tax return; it is not an additional tax. Investors in lower slabs (5%/20%) will have lower final tax and can claim a TDS refund if TDS exceeds their actual liability.
Key Risks
1. Feedstock/Commodity Price Volatility: Styrenics margins are highly sensitive to crude-oil-linked feedstock (styrene, acrylonitrile, butadiene) prices; the swing in OPM from 4.8% (Dec-25) to 22.1% (Jun-26) illustrates this sensitivity.
2. Rising Leverage During Capex Cycle: Borrowings rose from near-zero to ₹548 Cr in two years; execution risk on the capacity expansion and interest-cost burden warrant monitoring.
3. Weak Free Cash Flow Coverage: FCF coverage of the FY26 dividend was only 0.27x; continued capex could pressure future dividend funding if operating cash flow doesn't scale up correspondingly.
4. Earnings Volatility: FY26 consolidated PAT fell 21.8% YoY, and quarterly PAT has swung from ₹16 Cr to ₹138 Cr within three quarters, making dividend quantum per tranche unpredictable.
5. Declining Promoter Holding: Promoter stake has fallen from 75% to 46.24% over roughly four years; continued dilution could affect strategic alignment and market perception.
6. Small-Cap Liquidity & Concentration: As a SEBI-classified small-cap with a single reportable business segment (Engineering Polymers), the company carries concentration risk versus diversified chemical majors.
What To Monitor
1. Free Cash Flow Trend: Watch whether FCF recovers meaningfully in FY2026-27 as capex from the expansion cycle tapers off.
2. Capacity Expansion Commissioning: Track progress and eventual ramp-up of the reported ABS capacity addition and its impact on volumes and margins.
3. Debt Trajectory: Monitor whether borrowings stabilize post-capex or continue rising, and the resultant interest cost trend.
4. Quarterly Margin Stability: Given the wide OPM swings seen over the past five quarters, sustained margin normalization would be a positive signal.
5. Promoter Holding Stabilization: Any further reduction (or stabilization) in promoter stake following the sharp fall to 46.24%.
6. Official Ex-Date/Payment Date Confirmation: Confirm the NSE/BSE circular for the exact ex-date and the company's actual payment date disclosure once announced.
Conclusion
Styrenix Performance Materials' ₹23-per-share interim dividend for FY2026-27 continues an established pattern of multiple annual payouts and arrives on the back of a strong Q1 FY27 profit recovery (consolidated PAT up 166% YoY). However, the headline 230% face-value figure translates to a modest real-world yield of under 1% on the announcement-day price, and the underlying cash-flow picture shows earnings running well ahead of free cash generation amid an active capex and leverage cycle. Coverage on earnings and operating cash flow is comfortable at roughly 1.9x, but free cash flow coverage is thin at 0.27x, placing the dividend in a Moderately Sustainable category. This article has presented the disclosed facts, computed ratios, and identified risk factors and monitoring points; it does not constitute a recommendation to buy, sell, or hold the stock. Readers should weigh the positives (consistent multi-tranche payouts, margin recovery, comfortable P/E versus peers) against the negatives (FCF weakness, rising debt, earnings volatility, falling promoter stake) in the context of their own investment objectives.
Frequently Asked Questions
What dividend has Styrenix Performance Materials announced?
What is the dividend yield on this Styrenix dividend?
What is the record date for the Styrenix interim dividend?
What is the ex-date for this dividend?
When will the dividend be paid?
Who is eligible to receive this dividend?
How is this dividend taxed for Indian investors?
Is the Styrenix dividend sustainable?
What is Styrenix's dividend history?
What should investors monitor going forward?
Does this interim dividend require shareholder/AGM approval?
Why did Styrenix's profit jump 166% in Q1 FY27?
How does Styrenix's dividend yield compare to peers like Supreme Petrochem?
What is the total dividend outflow for this tranche?
Disclaimer
This article is published by ShareBazaarOnline for general informational and educational purposes only. ShareBazaarOnline is not a SEBI-registered investment adviser or research analyst, and nothing in this article constitutes investment advice, a recommendation, or a solicitation to buy, sell, or hold any security. All figures, ratios, and computations presented are based on publicly available regulatory filings, exchange disclosures, and third-party financial data aggregators as of the date of publication, and may be subject to revision, restatement, or data lag; figures marked "Not Independently Verified (NIV)" or "Not Disclosed by Company" should be treated accordingly. Market prices and yields are point-in-time and change continuously; readers must independently verify live CMP and official corporate-action circulars from NSE/BSE before making any decision. Past dividend history and payout patterns are not indicative of future dividends. Investing in equity markets is subject to market risk, including possible loss of principal. Readers are strongly advised to consult a SEBI-registered investment adviser and read all offer documents carefully before making any investment decision.