
Dividend Snapshot
PTC India Limited (NSE: PTC | BSE: 532524 | ISIN: INE877F01012) has announced an interim dividend of ₹23 per equity share of ₹10 face value for Financial Year 2026-27, translating to a headline rate of 230%. The dividend was approved by the Board of Directors on 4th August 2026, alongside the company's unaudited Q1 FY27 financial results.
Dividend Details
- Dividend Type: Interim Dividend
- Dividend Per Share: ₹23.00
- Dividend %: 230% of ₹10 face value
- Financial Year: FY 2026-27
- Total Dividend Outflow (standalone basis): ≈ ₹680.82 Crore
Yield Snapshot
- Face Value Yield (headline): 230%
- Real Market Yield (on last available CMP ₹154.95, 2-Sep-2026 close): ≈14.84%
- Announcement-day Yield (on ≈₹181.02 reference price, 4-Aug-2026): ≈12.71%
- ⚠ CMP must be re-verified live before publishing — all yield figures are price-dependent and stale quickly.
Dividend Announcement Summary
The Board of Directors of PTC India Limited, at its meeting held on 4th August 2026 (commenced 4:30 PM, concluded 6:45 PM), approved payment of an interim dividend at the rate of 230% (₹23 per equity share of ₹10 each) for FY 2026-27. The Board simultaneously took on record the company's un-audited standalone and consolidated financial results for the quarter ended 30th June 2026, reviewed by statutory auditors T R Chadha & Co LLP, who issued an unmodified (clean) review report for both standalone and consolidated statements.
Q1 FY27 Standalone Highlights
- Revenue from operations: ₹4,659.73 Cr (up 20.8% YoY from ₹3,857.38 Cr)
- Net Profit: ₹70.67 Cr (down 32.6% YoY from ₹104.78 Cr)
- Basic EPS: ₹2.39 (vs ₹3.54 in Q1 FY26)
Q1 FY27 Consolidated Highlights
- Revenue from operations: ₹4,730.66 Cr (up 18.96% YoY)
- Net Profit (total): ₹112.08 Cr (down 53.9% YoY from ₹242.88 Cr)
- Profit attributable to owners: ₹97.99 Cr (down 49.8% YoY)
- Basic EPS: ₹3.31 (vs ₹6.59 in Q1 FY26)
Management / Board Notes
Interim dividends under the Companies Act, 2013 do not require shareholder approval at an AGM — the Board can declare and pay them directly, unlike final dividends. The Board separately recommended a final dividend of ₹5.50 per share for FY2025-26 (a distinct, prior-year payout) on 19th May 2026, which is pending shareholder approval at the 27th AGM scheduled for 30th September 2026, with a separate record date of 7th October 2026. This is not to be confused with the ₹23 interim dividend covered in this article.
Key Dates Timeline
Announcement Date
4th August 2026 (Board Meeting)
Record Date
Monday, 10th August 2026 (company-disclosed, per Regulation 42 of SEBI LODR)
Ex-Date
10th August 2026 — inferred to coincide with the Record Date under India's T+1 rolling settlement convention (ex-date = record date since 2023). Not Independently Verified against the official NSE/BSE corporate-action circular — confirm before publishing.
Payment Date
Not Disclosed by Company in this filing. Under Section 123/124 of the Companies Act, 2013, an interim dividend must statutorily be paid within 30 days of declaration — i.e., on or before 3rd September 2026 (statutory outer limit; actual bank credit date may be earlier).
AGM Approval Status
Not applicable. As an interim dividend, this payout is a Board-level decision and does not require shareholder ratification at an AGM.
Dividend Yield Analysis
The Face-Value Yield Illusion
Headlines describing this as a "230% dividend" refer strictly to the face value of ₹10 per share — not the market price. On PTC India's most recently available closing price of ≈₹154.95 (2nd September 2026), the real market dividend yield works out to approximately 14.84%, still an exceptionally high figure by market standards but materially different from the 230% headline number. Retail investors should always anchor yield expectations to the market yield, not the face-value percentage.
Yield on Announcement-Day Price
Using the reference price of ≈₹181.02 quoted around the 4th August 2026 announcement (Not Independently Verified — secondary aggregator source, not an official NSE closing bhavcopy), the yield works out to ≈12.71%.
Why the Yield Is Elevated
Two independent factors are compounding here: (1) this is genuinely the largest single dividend per share in PTC India's visible history, funded substantially from balance sheet reserves rather than a single quarter's profit (see Cash Flow Analysis); and (2) the stock price has declined roughly 11-14% over the trailing one year, which mechanically inflates the yield ratio. Both effects are real and should be read together, not in isolation.
Dividend History Analysis
Recent Dividend Record (Not Independently Verified in full — compiled from multiple secondary aggregators; FY attribution approximate)
| Record Date | Amount (₹/share) | Type |
|---|---|---|
| 10-Aug-2026 | 23.00 | Interim (this dividend, FY27) |
| 20-Feb-2026 | 3.00 | Interim (FY26) |
| 01-Aug-2025 | 6.70 | Final (FY25) |
| 05-May-2025 | 5.00 | Interim (FY25) |
| 19-Sep-2024 | 7.80 | Final (NIV) |
| 20-Sep-2023 | 7.80 | Final (NIV) |
| 16-Dec-2022 | 5.80 | Final (NIV) |
| 26-Nov-2021 | 2.00 | Final (NIV) |
| 10-Sep-2021 | 5.50 | Interim (NIV) |
| 23-Sep-2019 | 4.00 | Final (NIV) |
Note: A separate final dividend of ₹5.50/share for FY2025-26 has been recommended (19-May-2026) and is pending AGM approval on 30-Sep-2026 with record date 7-Oct-2026 — not included above as it has not yet been ratified.
Classification: Consistent Payer, Step-Change Year
PTC India has paid a dividend in every year visible in this history with no evident suspensions, qualifying it as a Consistent Payer. However, FY2026-27's opening interim dividend of ₹23/share is a sharp step-up from the ₹2–₹8/share range seen in prior years — roughly 3–10x larger than any individual historical payout in this table. This is not a "special dividend" in name, but its scale relative to history warrants the same scrutiny as one (see Sustainability Scorecard below). Screener.in reports FY26 dividend payout ratio at a healthy 42.8% of consolidated profit on a trailing basis, but that reflects dividends paid during FY26 against FY25/FY26 earnings, not this new FY27 interim payout.
Financial Performance Analysis
Revenue Growth, Margin Compression
Consolidated revenue grew a healthy 18.96% YoY in Q1 FY27, driven largely by the core power trading business (segment revenue ₹4,680.11 Cr) and higher electricity volumes traded (25,783 Million Units, up from 23,042 MU a year earlier). Yet operating profit margin (OPM) has compressed sharply — Screener.in data shows consolidated OPM falling to just 3.1% in Q1 FY27 from levels of 6–9% in comparable quarters over the past five years. This is a textbook case of revenue rising while profitability declines: power trading is structurally a thin-margin, high-turnover business, and rising purchase costs (up in step with revenue) have squeezed the spread.
Profit Decline Drivers
Consolidated net profit fell 53.9% YoY, substantially steeper than the revenue growth would suggest. Key contributors from the filing notes: (1) Other Income fell to ₹53.65 Cr from ₹93.60 Cr a year earlier (Q1 FY26 had benefited from an unusually large other-income base); (2) a prudential provision of ₹17.37 Cr was made against an APTEL order on Late Payment Surcharge recovery, pending legal resolution; (3) the base effect — Q1 FY26 profit itself included elevated other income and a large reversal in the impairment-of-financial-instruments line (a credit of ₹81.59 Cr) at the PFS subsidiary, which did not repeat at the same scale in Q1 FY27.
Standalone vs Consolidated Framing
Standalone results capture only the parent's core power-trading business. Consolidated results add PTC India Financial Services Limited (PFS, 64.99% held NBFC subsidiary) and share of profit from associate Hindustan Power Exchange Limited (22.62% held). The financing segment contributed ₹102.50 Cr of consolidated revenue and ₹55.40 Cr of segment result in Q1 FY27 — a meaningful share of group profitability that standalone-only readers would miss.
Cash Flow Analysis
The Central Finding: This Dividend Is Not Funded By a Single Quarter's Profit
The standalone dividend outflow of ≈₹680.82 Crore is nearly 9.6 times PTC India's standalone Q1 FY27 net profit of ₹70.67 Crore. Even measured against the far larger consolidated annual profit base, the outflow equals 95.0% of FY26 consolidated net profit (₹717 Cr) and 116.0% of trailing-twelve-month consolidated profit (₹587 Cr). In plain terms: this dividend cannot be paid out of current earnings alone — it is being funded from accumulated reserves and operating cash generated over prior periods, not from the profit reported in the quarter it was declared alongside.
Operating & Free Cash Flow (FY26, Consolidated)
- Cash from Operating Activity: ₹2,817 Cr
- Free Cash Flow: ₹2,813 Cr
- OCF Coverage of this dividend: 4.14x
- FCF Coverage of this dividend: 4.13x
On an annual free-cash-flow basis, the dividend is comfortably covered — the concern is purely about the mismatch with the single quarter it was declared in, not the company's underlying cash-generation ability.
How the Dividend Is Being Funded
Based on available disclosures, the dividend appears funded through a combination of: current-year operating cash flow (power trading generates strong working-capital-light cash generation once collections normalize) and cash reserves built up from prior asset monetisation — notably the ₹1,179 Cr divestment of PTC Energy Limited to ONGC Green (completed March 2025) and PFS's resolution recoveries from stressed accounts (Vento Power Infra: ≈₹115.61 Cr; NSL Nagapatnam settlement: ≈₹125 Cr) in FY25. There is no evidence in this filing of borrowings being raised to fund the dividend.
Receivables vs Revenue Growth
Screener.in's ratio data shows debtor days at 95 for FY26, down from 107 in FY25 and materially better than the 125–156 day range seen between FY22 and FY24 — a positive signal that collection discipline has improved even as revenue has grown, reducing working-capital drag on cash conversion.
Balance Sheet Strength
Deleveraging Trend (Consolidated)
- FY24 Borrowings: ₹4,327 Cr
- FY25 Borrowings: ₹2,962 Cr
- FY26 Borrowings: ₹1,769 Cr (down 40.3% YoY)
Consolidated group debt has fallen by roughly 59% over three years — a strong deleveraging trend that materially improves the group's capacity to sustain a large dividend without stressing its balance sheet.
Reserves & Net Worth
- Reserves (FY26, Consolidated): ₹5,685 Cr
- Equity Capital: ₹296 Cr
- Total Assets (FY26): ₹12,631 Cr
- Book Value per Share: ≈₹202 (Screener)
Cash & Investments
The standalone/consolidated cash-and-bank-balance line is Not Disclosed by Company in this quarterly results PDF in a directly extractable form. The balance sheet shows an "Investments" line of ₹941 Cr for FY26 (up sharply from ₹377 Cr in FY25), consistent with redeployment of divestment proceeds into interest-bearing instruments. Cash coverage of the dividend outflow could not be independently computed from this filing and is flagged Not Disclosed by Company — recommend pulling the FY26 audited annual report balance sheet for a precise cash-and-bank-balance figure before final publication.
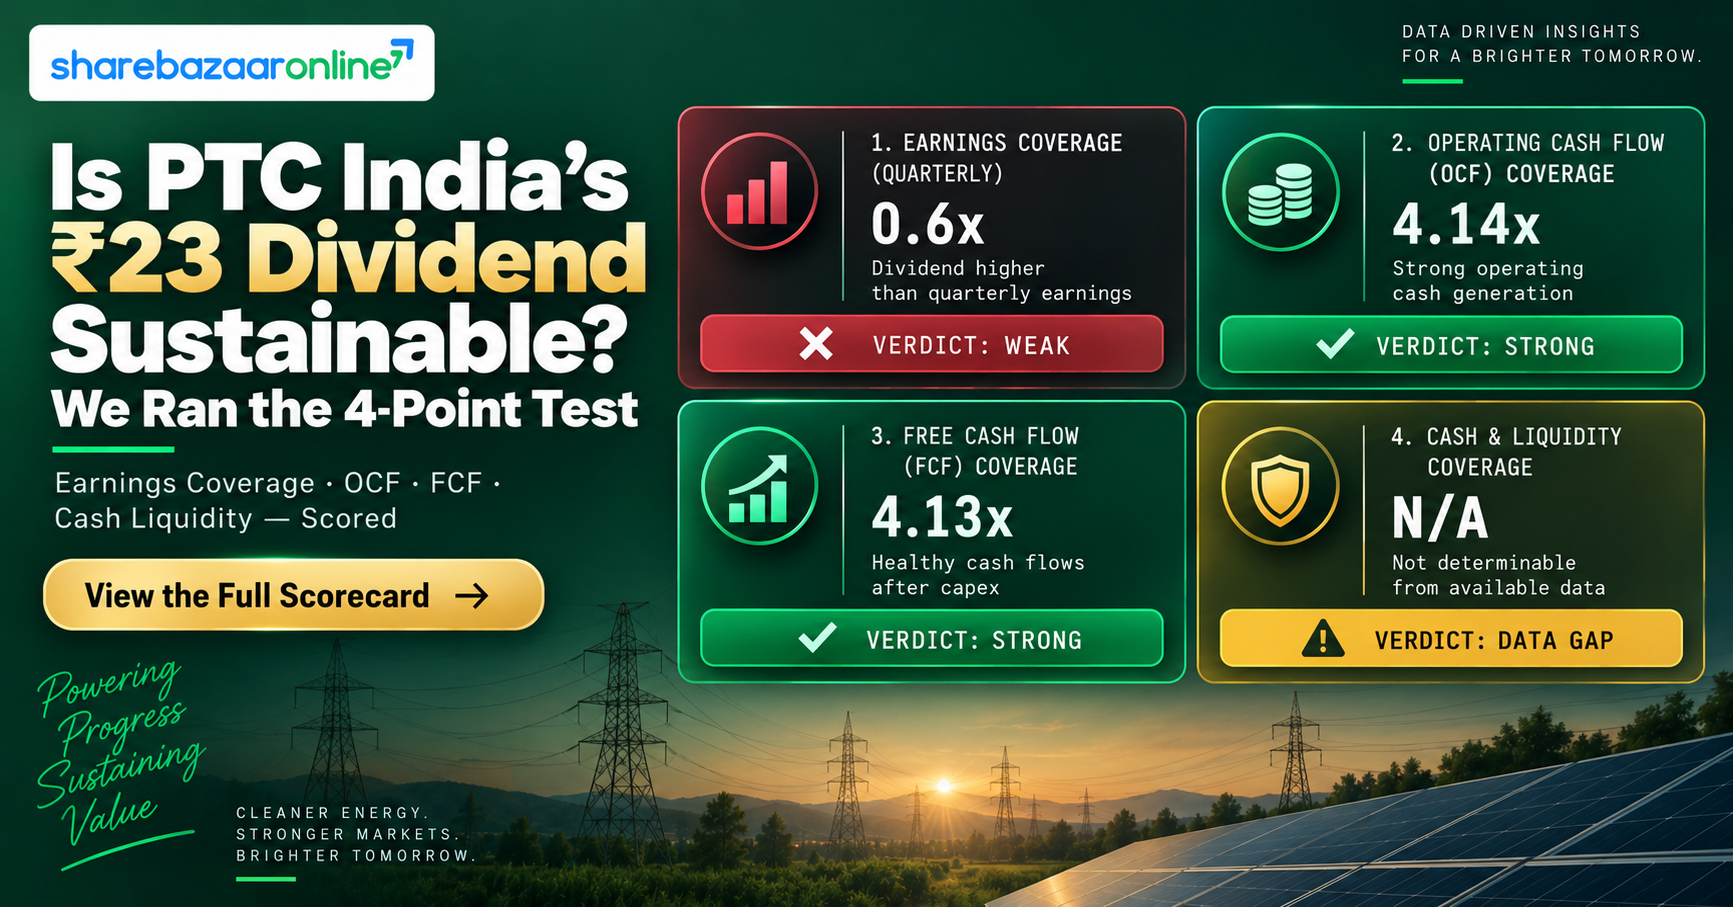
Dividend Sustainability Analysis
Test 1: Earnings Coverage
Fails on a single-quarter basis (9.6x oversized vs Q1 PAT); marginal on an annual consolidated basis (95–116% of FY26/TTM profit). Weak
Test 2: OCF Coverage
FY26 operating cash flow of ₹2,817 Cr covers this dividend outflow 4.14x. Strong
Test 3: FCF Coverage
FY26 free cash flow of ₹2,813 Cr covers this dividend outflow 4.13x. Strong
Test 4: Cash / Liquidity Coverage
Cannot be computed — cash & bank balance figure Not Disclosed by Company in this filing. Investments line of ₹941 Cr provides partial comfort but is not a direct liquidity proxy. Not Determinable from this filing
Overall Verdict: Moderately Sustainable
Three of four tests point to comfortable coverage on an annual cash-flow basis, backed by a genuinely deleveraging balance sheet. The one weak spot — earnings coverage on a quarterly basis — is real and material: this is not a dividend that current-quarter profits alone can repeat every quarter. Investors should treat the ₹23/share figure as reflecting a one-time distribution of accumulated cash strength rather than a new, sustainable run-rate, pending confirmation of the company's forward dividend policy.
Peer Comparison
Peer figures sourced from aggregator data of mixed vintage dates (Aug–Sep 2026) and marked NIV (Not Independently Verified) where a primary-source figure could not be confirmed. Cells left blank rather than estimated where data was unavailable.
| Company | Dividend Yield | P/E | ROE | Segment |
|---|---|---|---|---|
| PTC India Ltd | 14.8% (Screener) | 9.0x | 10.3% | Power Trading + NBFC |
| Power Finance Corp (PFC) | ≈5.1% (NIV) | ≈7–9x (NIV) | — | Power Sector NBFC |
| REC Limited | — | ≈5x (NIV) | — | Power Sector NBFC |
| IREDA | Nil (NIV) | ≈17x (NIV) | — | Renewable Energy NBFC |
Reading the Comparison
PTC India is not a pure-play against any single listed peer — it straddles power trading (no close listed comparator with the same business mix) and NBFC financing (comparable to PFC/REC/IREDA via its PFS subsidiary). Its current headline yield of 14.8% is well above the power-financier peer set's typical 4–5% range, but that comparison is somewhat apples-to-oranges since PFC and REC's yields reflect steadier, recurring payout policies rather than a step-up interim payment funded partly from reserves.
Promoter Impact Analysis
Promoter Dividend Income
- Promoter Holding (Jun-2026): 16.22%
- Promoter Dividend Income: ≈₹110.43 Cr
- Public/Minority Dividend Income: ≈₹570.39 Cr (83.78% of total)
Promoter Structure
PTC India is jointly promoted by four central PSUs — Power Grid Corporation of India (PGCIL), NTPC Limited, Power Finance Corporation (PFC) and NHPC Limited — each holding a modest slice of the 16.22% promoter stake. Because promoter holding here is relatively low for a PSU-promoted entity, the overwhelming majority of this dividend (≈83.8%) flows to institutional (FII 28.88%, DII 8.95%) and public shareholders (42.58%, plus 3.38% direct Government holding), rather than concentrating benefit in a single promoter family, as can happen at more closely-held companies.
Taxation Analysis
How Dividend Income Is Taxed in India
Since the Finance Act, 2020, dividends are taxable in the hands of shareholders at their applicable income-tax slab rate (the erstwhile Dividend Distribution Tax paid by companies was abolished). PTC India is required under Section 194 of the Income Tax Act, 1961 to deduct TDS at the prescribed rate (currently 10% for resident individuals) at the time of dividend payment, provided the dividend paid to a shareholder exceeds the prescribed threshold, which was raised to ₹10,000 per shareholder per financial year effective FY2025-26 onwards. Shareholders in the nil-tax bracket, or those wishing to avoid TDS, can submit Form 15G (non-senior citizens) or Form 15H (senior citizens) declarations to the company/registrar, subject to eligibility conditions.
Worked Example: Retail Investor, 1,000 Shares, 30% Slab
| Shares Held | 1,000 |
| Dividend Per Share | ₹23.00 |
| Gross Dividend | ₹23,000.00 |
| Tax/TDS @ 30% slab | ₹6,900.00 |
| Net Dividend Received | ₹16,100.00 |
| Effective Post-Tax Yield (on latest CMP) | ≈10.39% |
Since the gross dividend of ₹23,000 exceeds the ₹10,000 TDS threshold, the company will deduct TDS at the applicable rate at source; the shareholder must still declare the full gross dividend as taxable income and reconcile the TDS credit while filing their income tax return.
Key Risks
1. Dividend-earnings mismatch: This payout is 9.6x standalone quarterly profit and 95–116% of consolidated annual profit — a repeat at this scale every quarter is not sustainable from current earnings alone.
2. PFS regulatory non-compliance: As of 30 June 2026, subsidiary PFS did not meet the RBI's minimum 75% infrastructure exposure requirement for NBFC-IFC classification; remediation is targeted for 30 September 2026 with RBI's acknowledgement on record, but non-remediation carries classification risk.
3. Contingent litigation (APTEL/LPSC): An Appellate Tribunal for Electricity order directing payment under a PPA has resulted in a ₹17.37 Cr prudential provision; the company is contesting recovery from the counterparty, with outcome uncertain.
4. Margin compression in core trading: Consolidated OPM has fallen to 3.1% in Q1 FY27 from a historical 6–9% band, reflecting the thin-margin, volume-driven nature of the power trading business under rising purchase costs.
5. Leadership transition at PFS: Following the resignation of PFS's MD & CEO effective 30 June 2026, Mr. Rajiv Malhotra has been appointed only in an additional-charge capacity (1 July to 30 November 2026), creating near-term management continuity risk at the NBFC subsidiary.
6. Regulatory/licensing concentration: PTC's core trading business depends on its Category-I CERC trading license; any adverse regulatory action on power trading margins or market design would directly affect the segment that funds this dividend.
What To Monitor
1. PFS infrastructure-exposure remediation: Confirm whether the 75% minimum infrastructure exposure threshold is restored by the 30 September 2026 deadline.
2. FY25-26 final dividend AGM outcome: Track shareholder approval of the separate ₹5.50/share final dividend at the 27th AGM on 30 September 2026 and its 7 October 2026 record date.
3. Operating margin trajectory: Watch whether OPM stabilises or continues compressing below the 3.1% Q1 FY27 level over coming quarters.
4. APTEL/LPSC litigation resolution: Monitor the outcome of the appeal and whether the ₹17.37 Cr provision is released, enhanced, or crystallised as a loss.
5. Continued deleveraging: Track whether consolidated borrowings continue their multi-year decline (₹4,327 Cr → ₹2,962 Cr → ₹1,769 Cr) or begin rising again.
6. PFS permanent leadership appointment: Watch for a substantive (non-additional-charge) MD & CEO appointment at PFS before the November 2026 stopgap arrangement lapses.
Conclusion
PTC India Limited's ₹23 per share interim dividend for FY2026-27 is, by absolute size, the largest single payout in the company's recent history — and it is genuinely backed by a strengthened, deleveraged balance sheet and healthy multi-year free cash flow generation (4.1x annual coverage). At the same time, it is not covered by the profit of the single quarter alongside which it was declared, and represents 95–116% of a full year's consolidated earnings, meaning it draws meaningfully on accumulated reserves rather than being repeatable at this scale every quarter from current-year profit. The company's core trading segment shows margin pressure even as revenue and trading volumes grow, while its NBFC subsidiary carries a regulatory compliance item to resolve by end-September 2026. Investors evaluating this dividend should weigh both the genuine cash-flow strength and the earnings-coverage gap before drawing conclusions, and should independently verify all price-dependent figures against live market data before acting.
Frequently Asked Questions
What dividend has PTC India announced?
What is the real dividend yield on PTC India's stock?
What does the 230% dividend figure actually mean?
What is the record date for this dividend?
What is the ex-dividend date?
When will the dividend be paid?
Who is eligible to receive this dividend?
How is this dividend taxed?
Is this dividend sustainable going forward?
What is PTC India's dividend history?
What should investors monitor after this dividend?
Does this dividend require shareholder approval at an AGM?
How much will the dividend cost PTC India in total?
How much dividend income will PTC India's promoters receive?
Disclaimer
This article is published by ShareBazaarOnline for informational and educational purposes only. ShareBazaarOnline is not registered with SEBI as an investment adviser or research analyst, and nothing in this article constitutes a recommendation to buy, sell, or hold any security. All figures, ratios, and dates have been compiled from the company's regulatory filings and secondary public sources as cited, and are subject to change; several data points are explicitly flagged as Not Independently Verified (NIV) or Not Disclosed by Company. Share prices, yields, and market capitalisation figures are point-in-time and must be re-verified against live market data before use. Readers should consult a SEBI-registered investment adviser and independently verify all information, including with the company's official corporate announcements on NSE/BSE, before making any investment decision.