
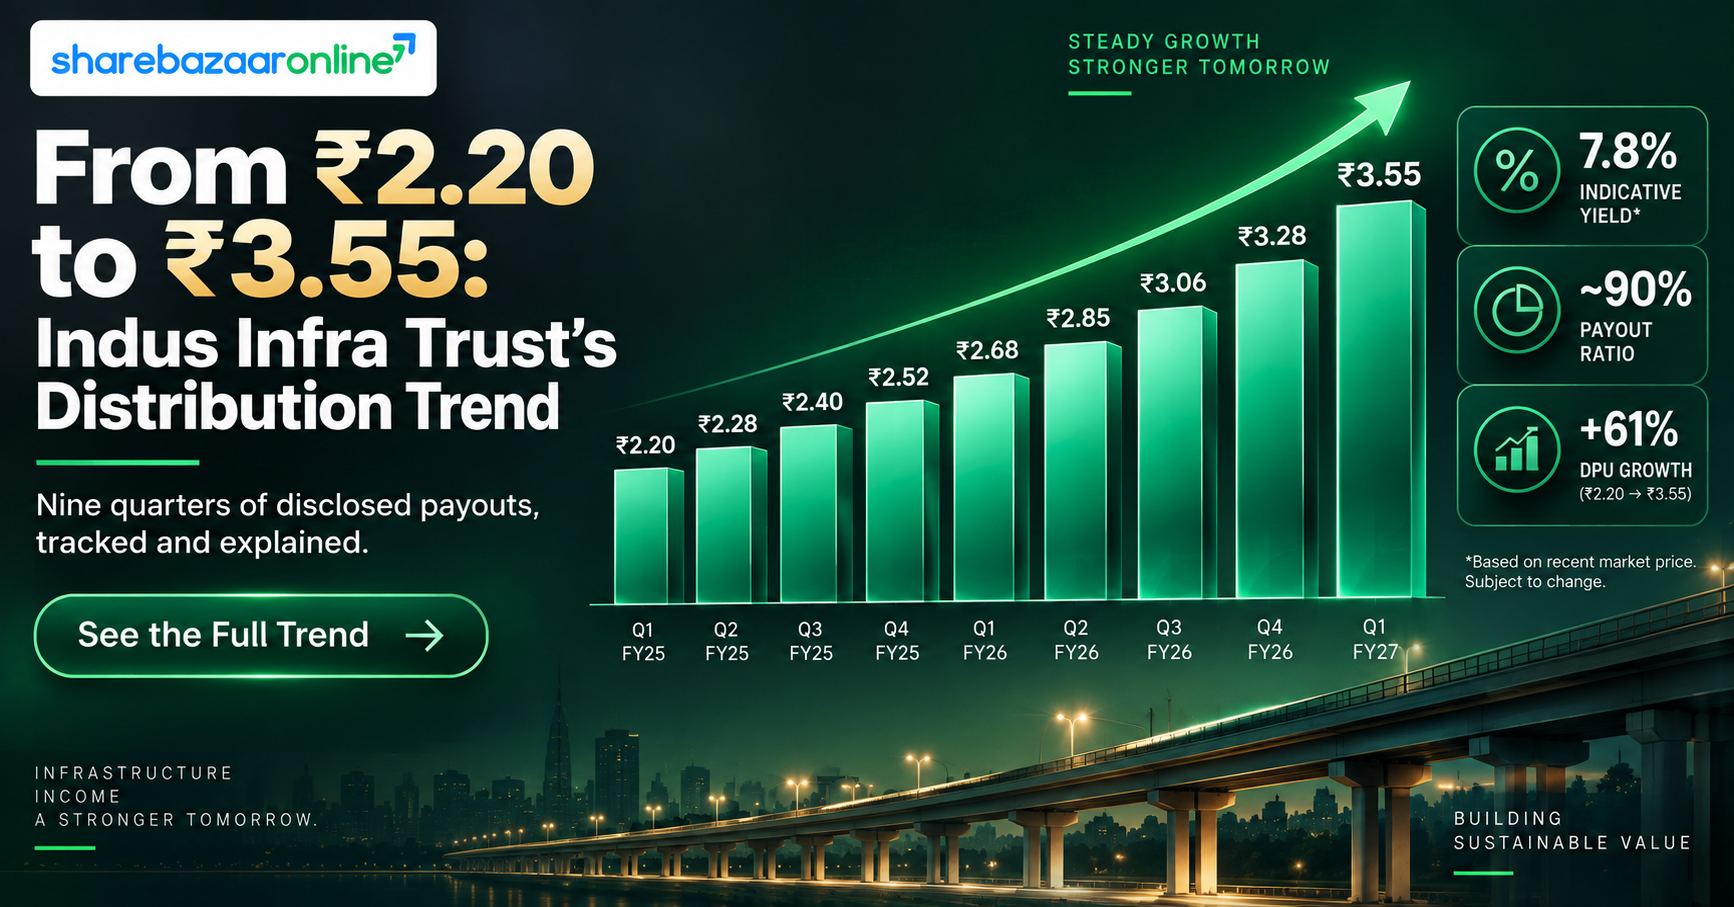
Distribution Snapshot: Indus Infra Trust
Total Distribution Per Unit
₹3.55
Interest ₹2.38 + Return of Capital ₹1.17 (no separate "dividend" line-item this quarter)
Quarter
Q1 FY27
Quarter ended 30 June 2026
Record Date
10 Aug 2026
Monday
Payment Date
On/before 17 Aug 2026
As disclosed by the Trust
Indus Infra Trust (formerly Bharat Highways InvIT) is a SEBI-registered Infrastructure Investment Trust, not a conventional equity company. What is commonly reported as its "dividend" is technically a unitholder distribution made up of interest income, dividend income and return of capital in varying proportions each quarter. This quarter's payout carries no dividend sub-component at all — a distinction that matters for how the payout is taxed and for why different data providers show wildly different "yield" numbers for the same distribution (see the Yield Analysis section below).
Distribution Announcement Summary
The Board of Directors of GR Highways Investment Manager Private Limited — the Investment Manager to Indus Infra Trust — approved the Trust's Q1 FY27 (quarter ended 30 June 2026) financial results and a unitholder distribution of ₹3.55 per unit at its meeting held on 5 August 2026. The distribution comprises ₹2.38 as interest income and ₹1.17 as return of capital. This is the fourth consecutive quarterly distribution disclosed by the Trust and follows ₹3.50 per unit paid for Q4 FY26 (quarter ended March 2026).
Entity & Identifiers
NSE Symbol: INDUSINVIT
BSE Code: 544137
ISIN: INE0NHL23019
Instrument Type: InvIT Units (not equity shares)
Corporate Background
Sponsor / Project Manager: Aadharshila Infratech Private Limited (GR Group)
Investment Manager: GR Highways Investment Manager Private Limited
Trustee: IDBI Trusteeship Services Ltd
Portfolio: Hybrid Annuity Mode (HAM) road/highway assets
What the disclosures say
Alongside the distribution announcement, the Trust's Q1 FY27 investor presentation and earnings call (6 August 2026) referenced the completion of a ₹1,700 crore Qualified Institutional Placement (QIP) and a preferential unit issue undertaken in June 2026, together with the acquisition of ULCCS Kasaragod Expressway Private Limited and 100% shareholding in KNR SPVs from KNR Constructions. Total units outstanding rose from roughly 44.29 crore (as of 31 March 2026) to 61.10 crore (as of 19 June 2026) following this capital raise — a unit-count increase of about 38% within a single quarter. This dilution has direct bearing on how per-unit metrics should be read going forward (see Sustainability section).
Key Dates Timeline
Board Approval / Announcement
5 August 2026
Ex-Date (Inferred)
7 August 2026*
*Friday, one trading day before the record date under T+1 settlement. Not separately confirmed in the Trust's public filings — treat as inferred, not company-stated.
Record Date
10 August 2026
Payment Date
On/before 17 August 2026
All four dates above have already elapsed as of the date of this analysis. Unitholders who held units on the record date of 10 August 2026 were the ones entitled to this distribution; the payment window closed by 17 August 2026 per the Trust's disclosure. This article is therefore a post-event, artifact-mode record of a distribution cycle that has already been completed.
Distribution Yield Analysis
Single-Quarter Yield (on CMP ₹134)
2.65%
₹3.55 ÷ ₹134, not annualized
Single-Quarter Yield (on announcement-day CMP ₹132.07)
2.69%
Estimated Trailing 4-Quarter Yield
~9.8%
₹13.12/unit (estimate) ÷ ₹134 — see caveat below
CMP Verification
Requires re-check before publish
₹134 was the 25-Aug-2026 close; live price should be re-verified on the day of publication since every yield figure here is price-dependent.
The "yield illusion" specific to this InvIT
Trackers currently show strikingly different "dividend yield" figures for Indus Infra Trust — Screener.in lists 3.15%, one aggregator shows 6.84%, another shows 12.55%, and a third shows 10.77%. This spread is not simply due to different reference dates. InvIT distributions are split into up to three components — interest, dividend and return of capital — and some data providers only pick up the "dividend" line-item while ignoring interest and return-of-capital, which typically make up the bulk of the payout. This quarter's ₹3.55 distribution, for example, has a ₹0 dividend component; a tracker that only counts the "dividend" field would show this quarter's payout as zero, understating the real cash return to unitholders. Readers comparing yield figures across websites for this Trust should check whether the source is using total distribution (interest + dividend + RoC) or only the dividend sub-component.
Trailing-yield caveat
The Trust has disclosed FY26 full-year distribution of ₹12.25/unit along with individually confirmed quarterly figures of ₹3.40 (Q3 FY26) and ₹3.50 (Q4 FY26). The split between Q1 FY26 and Q2 FY26 (which together account for the residual ₹5.35) has not been individually disclosed in the sources reviewed and is marked Not Disclosed by Company. The trailing 4-quarter figure of ~₹13.12/unit used above therefore rests on a proxy split of that residual and should be treated as an estimate, not a confirmed number, pending confirmation from the Trust's exchange filings.
Distribution History Analysis
| Period | DPU (₹) | Interest (₹) | Dividend (₹) | RoC (₹) |
|---|---|---|---|---|
| Q1 FY27 (Jun-26) | 3.55 | 2.38 | 0.00 | 1.17 |
| Q4 FY26 (Mar-26) | 3.50 | 1.01 | 0.00 | 2.49 |
| Q3 FY26 (Dec-25) | 3.40 | NIV | NIV | NIV |
| Q1+Q2 FY26 combined (residual) | 5.35 | Not Disclosed by Company (individual quarterly split unavailable) | ||
| Q4 FY25 (Mar-25) | 2.25 | 0.96 | 1.05 | 0.24 |
| Prior quarter (FY25) | 2.75 | 2.51 | 0.24 | 0.00 |
| Earlier quarter (FY25) | 2.20 | 1.66 | 0.30 | NIV |
Payer Classification: Consistent (Growing)
Every disclosed quarter since Q4 FY25 shows an unbroken sequence of distributions with no cuts or skipped quarters, and the per-unit amount has broadly risen from ₹2.20–2.75 in FY25 to ₹3.40–3.55 through FY26 and into Q1 FY27. As a young, listed-since-2024 InvIT, its distribution history is still short (roughly nine quarters of disclosed data), so this classification carries less statistical weight than it would for a company with a 10-year record.
Composition is shifting
The mix between interest, dividend and return-of-capital has varied meaningfully quarter to quarter — from a dividend-heavy Q4 FY25 payout to an interest/RoC-only structure in the two most recent quarters, with the dividend sub-component effectively at zero. This composition shift, which affects how each unitholder is taxed, appears to track the Trust's internal SPV-level income recognition rather than any policy change communicated to unitholders.
Financial Performance Analysis
FY26 (year ended 31 Mar 2026), Consolidated
Revenue: ₹677 Cr (down 9.1% YoY from ₹745 Cr)
Operating Profit: ₹483 Cr (OPM 71%)
Net Profit: ₹383 Cr (down 20.5% YoY from ₹482 Cr)
EPS: ₹8.64 (on pre-QIP weighted-average unit base)
Q1 FY27 (quarter ended 30 Jun 2026), Consolidated
Revenue: ₹285 Cr (up 51.6% QoQ)
Operating Profit: ₹214 Cr (OPM 75%)
Net Profit: ₹129 Cr (up 21.4% QoQ)
EPS: ₹2.12
Operating leverage read: revenue up, but interest cost is eating the gain
Q1 FY27 revenue jumped 51.6% quarter-on-quarter, largely reflecting the newly consolidated KNR SPV and ULCCS Kasaragod Expressway assets. But interest expense doubled in the same quarter — from roughly ₹46 Cr in Q4 FY26 to ₹92 Cr in Q1 FY27, a 100% QoQ jump — as the Trust drew on the higher borrowing limit approved via postal ballot in March 2026 to fund these acquisitions. Net profit growth of 21.4% QoQ, while positive, therefore trails the much steeper revenue growth, because a larger share of incremental operating profit is being absorbed by financing cost on newly added debt rather than flowing through to the bottom line.
Base-effect distortion in FY26 profit decline
FY26 net profit fell 20.5% YoY, but FY25's ₹482 Cr base included ₹111 Cr of other income (against ₹72 Cr in FY26), which appears to reflect a one-time or elevated gain rather than a recurring item. Stripping out the other-income differential narrows the underlying operating profit decline considerably, meaning the headline 20.5% PAT fall overstates the deterioration in the Trust's core annuity/toll-linked operating performance.
Cash Flow Analysis
Operating Cash Flow (FY26)
₹599 Cr
156% of reported Net Profit (₹383 Cr) — cash generation exceeds accounting profit
Free Cash Flow (FY26)
₹599 Cr
Treated as equal to CFO since no separate capex line is disclosed for this asset-light-at-SPV-level structure
OCF versus PAT: a rare case where cash beats profit
Unlike many dividend-paying companies where reported profit outruns actual cash generation, Indus Infra Trust's FY26 operating cash flow of ₹599 Cr comfortably exceeds its reported net profit of ₹383 Cr. This is a structural feature of HAM road annuity assets, where non-cash items and the timing of annuity receivables versus revenue recognition can push OCF above PAT rather than below it. This is a genuinely reassuring cash-quality signal on its own.
What actually funds this quarter's distribution
FY26 FCF of ₹599 Cr covered the FY26 full-year distribution outflow of an estimated ₹542.6 Cr (on the pre-QIP unit base) at roughly 1.10x — adequate but not generous headroom. However, the Financing Activity cash flow for FY26 was a large net outflow of ₹(1,167) Cr, reflecting both debt repayment/refinancing and distribution payouts, while Investing Activity showed a ₹699 Cr net inflow, likely from proceeds tied to the capital restructuring. Reading these three cash-flow lines together, the FY26 distribution appears funded primarily through current-period operating cash generation, not asset sales or a drawdown of the cash balance — a Sustainable funding signal for the historical period under review.
Forward math flags a coverage gap worth watching
If the just-declared ₹3.55 quarterly DPU is mechanically run-rated across a full year (×4) on the current post-QIP unit base of 61.10 crore units, the implied annualized distribution outflow is approximately ₹867.6 Cr — well above FY26's ₹599 Cr FCF, implying coverage of only ~0.69x on that basis. This is a mechanical extrapolation, not a Trust forecast, and it does not yet reflect a full year of cash flow from the newly acquired KNR SPVs and ULCCS Kasaragod Expressway assets, which were funded specifically to be "yield-accretive." Whether those new assets close this gap is the single most important number to track over the next two to three quarters.
Balance Sheet Strength
Borrowings (Mar-2026)
₹4,603 Cr
Up 114.7% YoY from ₹2,144 Cr (Mar-2025)
Total Assets (Mar-2026)
₹9,577 Cr
Up from ₹7,112 Cr a year earlier
Investments (balance sheet line)
₹145 Cr
Partial liquidity proxy only — full cash & bank balance is Not Disclosed by Company in the sources reviewed
Book Value / Unit
₹107
CMP/Book Value: 1.25x
Leverage is rising sharply, and this is the key balance-sheet story
Borrowings more than doubled year-on-year (up 114.7%) to fund the KNR SPV and ULCCS Kasaragod Expressway acquisitions. Unitholders approved a higher borrowings limit via postal ballot in March 2026 (99.99% approval), and the Trust separately raised ₹1,700 Cr via QIP alongside a preferential issue in June 2026 — suggesting management chose a mixed debt-and-equity funding structure for expansion rather than funding growth entirely through fresh unit issuance or entirely through debt. Whether this leverage step-up is prudent depends on whether the newly acquired assets' annuity cash flows scale in line with the added interest burden, which quarterly interest cost (already up 100% QoQ in Q1 FY27) is starting to reflect.
Liquidity coverage is thin on the disclosed proxy
Using the ₹145 Cr "Investments" balance-sheet line as a partial liquidity proxy against this quarter's ₹216.9 Cr distribution outflow gives a coverage ratio of only 0.67x. This should not be read as a definitive liquidity shortfall — the Trust's full cash and bank balances are not separately broken out in the data reviewed, and the distribution is, per the cash-flow analysis above, primarily funded from current operating cash generation rather than drawn-down reserves. But it does mean readers should not assume a large standing cash cushion behind this InvIT's payouts; treat this as a Not Disclosed by Company data gap that a desk should verify against the Trust's full balance sheet notes before publication.
Distribution Sustainability Analysis
Earnings Coverage (FY26)
Payout ~142% of PAT
FAILS this test on a pure PAT basis — expected for InvITs, since SEBI mandates distribution of at least 90% of Net Distributable Cash Flow (NDCF), a cash-based metric, not PAT
OCF Coverage (FY26)
PASSES (156% of PAT / ~1.10x of outflow)
FCF Coverage
FY26 actual: 1.10x | Forward run-rate: ~0.69x
Forward figure is a mechanical projection flagged separately above
Liquidity Coverage
Weak on disclosed proxy (0.67x)
Full cash balance NIV; treat cautiously
Classification: Conditionally Sustainable
On the FY26 historical record, the distribution was funded from genuine operating cash flow with adequate (if not generous) coverage. It fails the PAT-based earnings test, but that is a structural feature of the InvIT model rather than a red flag by itself, since InvITs are regulatorily required to distribute at least 90% of NDCF — a cash concept — regardless of accounting profit. What tips this into "Conditionally Sustainable" rather than a cleaner "Sustainable" rating is the forward-looking picture: the unit base has grown ~38% via the June 2026 QIP, borrowings have more than doubled, and interest cost has doubled quarter-on-quarter, all while the payout run-rate implied by this quarter's DPU would require materially higher NDCF than FY26 generated. The sustainability of the current distribution rate is therefore conditional on the newly acquired assets (KNR SPVs, ULCCS Kasaragod Expressway) delivering the annuity cash flows management has projected as "yield-accretive," which is not yet visible in a full reporting cycle of financials.
Peer Comparison
| InvIT | Latest Qtr DPU (₹) | Reported Yield (varies by source) | ROE | ROCE |
|---|---|---|---|---|
| Indus Infra Trust | 3.55 | 2.65% (single-qtr) / ~9.8% (est. trailing 4Q) | 7.92% (5.84% 3-yr avg) | 6.77% |
| IRB Infrastructure Trust | 1.70 | NIV (desk re-run required) | NIV | NIV |
| Powergrid InvIT | 3.00 | ~12.0% (single aggregator, unverified) | NIV | NIV |
| IndiGrid Infrastructure Trust | NIV | 2.0%–9.9% (sources conflict sharply) | NIV | NIV |
Peer yield figures above are drawn from secondary aggregators (rather than a primary keyword/financial database, which was unavailable this session) and diverge substantially between sources for the same InvIT — IndiGrid alone is quoted anywhere from 2.0% to 9.9% depending on the tracker, almost certainly reflecting the same interest/dividend/RoC-component conflation flagged for Indus Infra Trust above. These figures should be treated as indicative only and re-verified against each Trust's own exchange filings before being used in any comparative claim. ROE and ROCE for IRB, Powergrid and IndiGrid are marked Not Disclosed by Company as they could not be independently confirmed this session.
Sponsor Impact Analysis
Sponsor Group Holding
46.58%
28,45,98,789 units, as disclosed 19 Jun 2026
Sponsor Group Distribution Income (this qtr)
₹101.04 Cr
Out of total ₹216.91 Cr distributed
Nearly half the payout flows back to the sponsor ecosystem
The Sponsor Group — entities tied to GR Infraprojects / GR Group — held 46.58% of total units as of the most recent disclosed pattern, translating into an estimated ₹101.04 Cr of this quarter's ₹216.91 Cr total distribution flowing to sponsor-affiliated unitholders, versus ₹115.87 Cr to public unitholders. This is worth flagging plainly because Indus Infra Trust's asset-acquisition pipeline (KNR SPVs, ULCCS Kasaragod Expressway, and earlier ROFO assets) has also involved related-party transactions with GR Infraprojects, meaning the sponsor group sits on both sides of the Trust's capital allocation: as a seller of assets into the Trust and as a large recipient of unitholder distributions. Public unitholders approved these related-party asset acquisitions and the borrowings-limit increase with over 99.9% support in the March 2026 postal ballot, per the disclosed voting results, indicating broad unitholder alignment with this structure to date.
Taxation Analysis
InvIT distributions are taxed differently from a conventional equity dividend because each rupee distributed is classified into one of three buckets, each with its own tax treatment for a resident individual unitholder:
- Interest income — taxable in the unitholder's hands at their applicable income-tax slab rate; the Trust deducts TDS at 10% under Section 194LBA for resident unitholders (higher for non-residents, subject to treaty rates).
- Dividend income — taxable at slab rate (this quarter's distribution carries a ₹0 dividend component, so this bucket does not apply to the current payout).
- Return of Capital (RoC) — not taxed as income at the time of receipt; it instead reduces the unitholder's cost basis in the units, with tax effectively deferred until the units are eventually sold (as capital gains).
Worked example: 1,000 units, 30% tax slab
Gross interest component (₹2.38 × 1,000): ₹2,380
Gross Return of Capital (₹1.17 × 1,000): ₹1,170 (not taxed now; reduces cost basis)
Total gross cash distribution: ₹3,550
TDS deducted at source on interest (10%): ₹238
Tax liability on interest at 30% slab: ₹714 (TDS of ₹238 is adjusted as advance credit at return filing; balance ₹476 payable)
Net cash actually credited (after TDS): ₹3,312
This worked example is illustrative only, uses the disclosed component split for this specific quarter, and does not constitute tax advice. Actual TDS and effective tax outcomes vary by residency status, applicable tax treaty, and each investor's total income for the year; unitholders should consult a qualified tax advisor.
Key Risks
Rising leverage and interest burden
Borrowings rose 114.7% YoY to ₹4,603 Cr and quarterly interest cost doubled QoQ to ₹92 Cr; further debt-funded acquisitions could compress distributable surplus if annuity inflows lag interest cost growth.
Post-QIP dilution dynamics
Total units outstanding rose ~38% in a single quarter (44.29 Cr to 61.10 Cr); unless newly acquired assets contribute proportionate NDCF quickly, per-unit distribution could face downward pressure even if aggregate distributable cash rises.
Related-party concentration
A significant share of acquired assets (KNR SPVs, ROFO assets, prior GR Aligarh Kanpur Highway) have been sourced from sponsor-linked or ROFO counterparties, and the Sponsor Group holds 46.58% of units and receives a proportionate share of distributions.
Annuity receivable timing risk
HAM road assets depend on timely annuity payments from the National Highways Authority of India (NHAI) and state authorities; delays in annuity receipt can create short-term cash-flow mismatches even when underlying assets are performing.
Distribution composition volatility
The interest/dividend/RoC mix has changed materially from quarter to quarter with no explicit unitholder guidance, making post-tax cash flow harder for individual investors to predict quarter to quarter.
Thin disclosed liquidity buffer
The only disclosed balance-sheet liquidity proxy (Investments of ₹145 Cr) covers just 0.67x of a single quarter's distribution outflow, leaving limited visible cushion if operating cash flow were to dip in any given quarter.
What To Monitor
NDCF contribution from new assets
Whether KNR SPVs and ULCCS Kasaragod Expressway deliver the "yield-accretive" cash flows management has cited, closing the gap flagged in the forward FCF-coverage math above.
Interest cost trajectory
Whether the Q1 FY27 doubling of interest expense (QoQ) stabilizes or continues rising as further borrowings are drawn against the increased sanctioned limit.
Per-unit DPU trend post-dilution
Whether quarterly DPU on the enlarged 61.10 crore unit base holds near ₹3.55 or drifts lower as the full impact of the June 2026 unit issuance plays out across future quarters.
Credit rating trajectory
CRISIL and CARE rating updates (most recently in June 2026) for signs of stress or reaffirmation as leverage rises; a downgrade would raise future borrowing costs.
Further related-party acquisitions
Any additional ROFO or sponsor-linked asset purchases, and the pricing/valuation terms disclosed for each, given the sponsor's dual role as seller and large unitholder.
Individual quarterly DPU disclosure clarity
Whether the Trust begins disclosing full interest/dividend/RoC composition and prior-quarter comparisons more consistently, reducing the current cross-aggregator yield confusion.
Conclusion
Indus Infra Trust's Q1 FY27 distribution of ₹3.55 per unit continues an unbroken and generally rising sequence of quarterly payouts since its FY25 disclosures, funded on a historical (FY26) basis by operating cash flow that comfortably exceeded reported profit. At the same time, this is a Trust in the middle of a significant capital-structure transition: a ~38% single-quarter increase in units outstanding, a more than doubling of borrowings, and a doubling of quarterly interest cost, all undertaken to fund yield-accretive acquisitions whose full cash contribution has not yet shown up in a complete reporting cycle. The historical coverage picture is reasonably solid; the forward, post-dilution picture is mechanically tighter and depends on execution. Readers should also be alert to how differently various trackers report this InvIT's "yield," given the interest/dividend/return-of-capital composition issue detailed above. This analysis presents facts, computed ratios, and monitoring points only — it does not constitute, and should not be read as, a buy, sell, or hold recommendation.
Frequently Asked Questions
What distribution has Indus Infra Trust announced?
What is the distribution yield on this payout?
What was the record date for this distribution?
What was the ex-date for this distribution?
When was the distribution paid?
Who was eligible for this distribution?
How is this InvIT distribution taxed?
Is Indus Infra Trust's distribution sustainable?
What is Indus Infra Trust's distribution history?
What should investors monitor going forward?
Why do different websites show different dividend yields for Indus Infra Trust?
How many units does Indus Infra Trust have outstanding?
Disclaimer
This article is published by ShareBazaarOnline for general informational and educational purposes only. It is not investment advice, a research report under SEBI (Research Analysts) Regulations, or a recommendation to buy, sell, or hold any security or unit discussed. ShareBazaarOnline is not a SEBI-registered investment adviser or research analyst. Figures marked "Not Disclosed by Company" or "NIV" reflect data not independently verified at the time of writing; ex-date has been inferred under standard T+1 settlement convention and is not company-confirmed; and all CMP-dependent yield figures should be re-verified against live market prices before any decision is made. Past distribution history is not indicative of future distributions. Readers should consult a SEBI-registered investment adviser and a qualified tax professional before making any investment or tax-related decision. ShareBazaarOnline and its authors accept no liability for decisions made based on this content.