
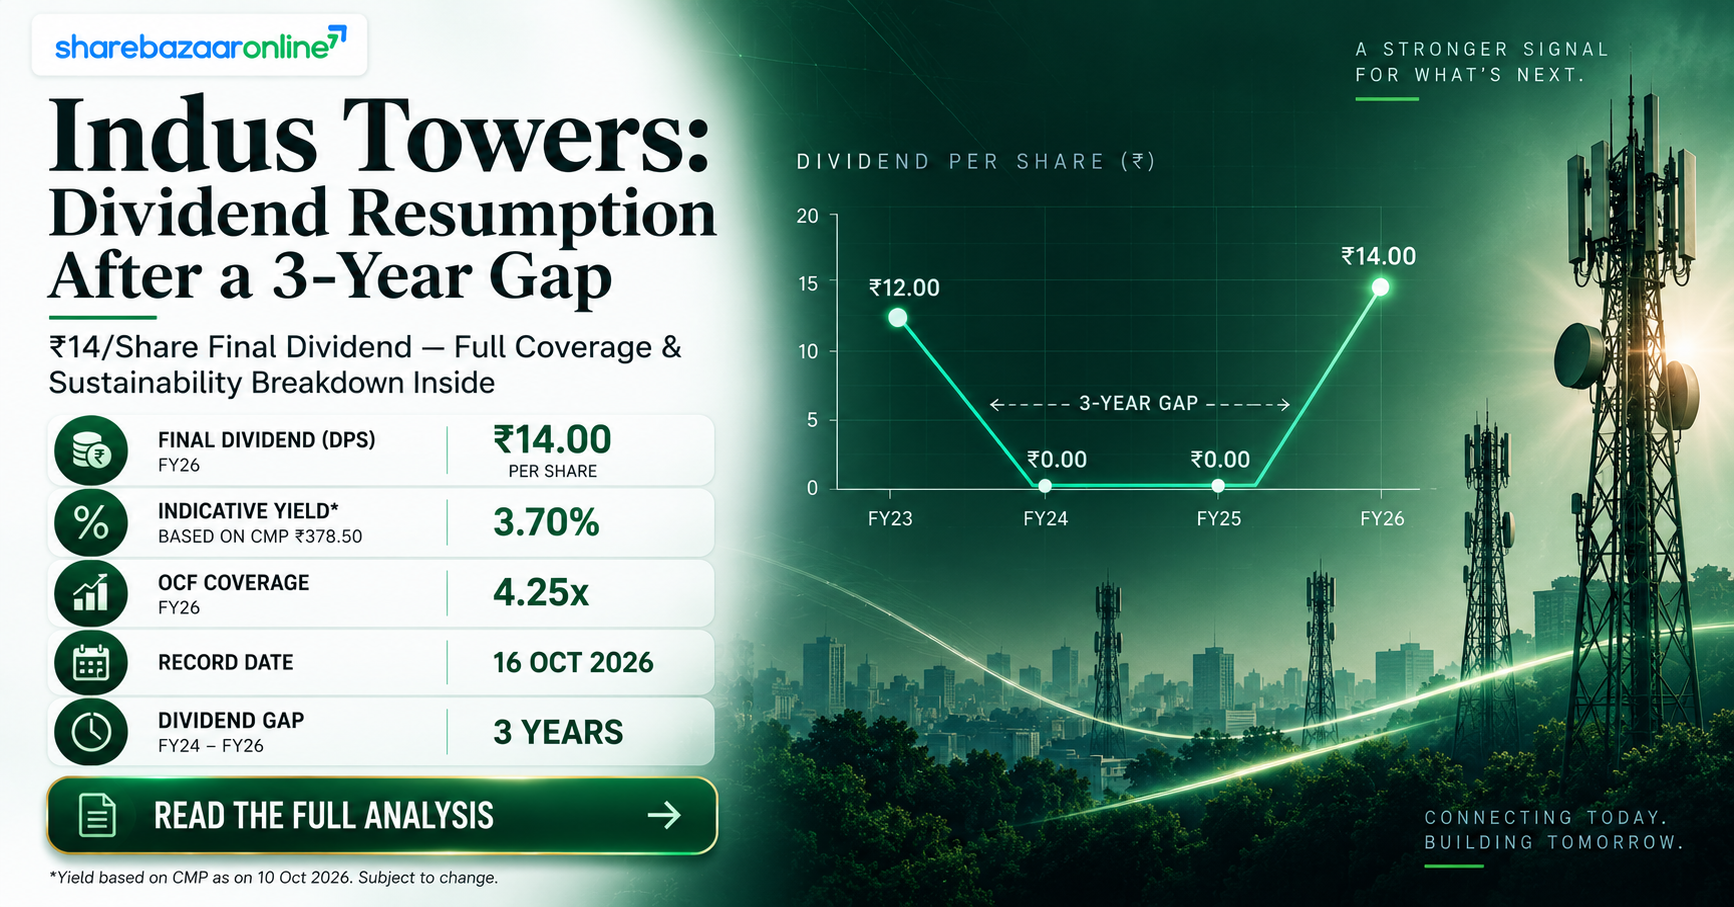
Dividend Snapshot
Company
Indus Towers Limited
NSE: INDUSTOWER | BSE: 534816 | ISIN: INE121J01017
Dividend Type
Final Dividend, FY2025-26
₹14.00 per equity share (140% of ₹10 face value)
Dividend Yield (on latest CMP)
3.70%
Calculated on ₹378.00 NSE close, 26 Aug 2026 — re-verify before publishing
Total Dividend Outflow
₹3,693.48 Cr
On 263.82 Cr triangulated shares outstanding
Dividend Announcement Summary
The Board of Directors of Indus Towers Limited, at its meeting held on 30 April 2026, recommended a Final Dividend of ₹14 per equity share of face value ₹10 each for the financial year ended 31 March 2026, subject to shareholder approval at the Annual General Meeting (AGM). The Board meeting commenced at 3:05 p.m. IST and concluded at 7:25 p.m. IST. The 20th AGM of the company was held on 19 August 2026, and the dividend, once approved, is payable within 30 days of that approval — by approximately 18 September 2026.
The Headline Number Needs Context
A "140% dividend" sounds dramatic, but 140% is calculated on the ₹10 face value, not on the price you actually pay to buy the stock. At the current market price of roughly ₹378, the same ₹14 payout works out to a 3.70% yield — a healthy but far less headline-grabbing number. Readers who anchor expectations to the "140%" figure without this context risk badly overestimating their actual cash return.
Key Dates Timeline
Board Recommendation
30 April 2026
AGM (Shareholder Approval)
19 August 2026
Ex-Date
10 August 2026
Record Date
11 August 2026 (Inferred, T+1)
Payment Date
On or before ~18 September 2026 (within 30 days of AGM approval, exact date Not Disclosed by Company)
Note: Indus Towers fixed the ex-date ahead of the AGM, which is a common practice for a recommended final dividend once the record date is set by the exchanges under the T+1 settlement cycle. Shareholders who held shares before the ex-date of 10 August 2026 were the ones in line to receive this dividend once shareholder approval was obtained. This ex-date/record-date sequencing is inferred from secondary market data and should be cross-checked against the company's exchange filing before publication.
Dividend Yield Analysis
Yield on Announcement-Day CMP (₹409.95, 30 Apr 2026)
3.42%
Yield on Latest CMP (₹378.00, 26 Aug 2026)
3.70%
The yield has risen from 3.42% to 3.70% between the announcement date and today — not because the dividend grew, but because the stock price fell roughly 7.8% over the same period, from ₹409.95 to ₹378.00. This is a textbook case of yield expansion through price decline rather than payout growth. Investors evaluating this stock purely on trailing yield should be aware that a rising yield figure can just as easily reflect a falling share price as it can reflect a generous, growing payout. Indus Towers shares have traded in a 52-week range of ₹312.55 to ₹481.50, so the yield an investor locks in depends heavily on the entry price.
Dividend History Analysis
| Ex-Date | Amount/Share | Type |
|---|---|---|
| 20 Jul 2017 | ₹4.00 | Annual |
| 19 Jul 2018 | ₹14.00 | Annual |
| 1 Nov 2018 | ₹7.50 | Quarterly |
| 7 May 2019 | ₹7.50 | Semi-Annual |
| 22 Aug 2019 | ₹3.65 | Quarterly |
| 19 Dec 2019 | ₹2.75 | Quarterly |
| 5 May 2020 | ₹4.10 | Quarterly |
| 5 Aug 2020 | ₹2.30 | Quarterly |
| 8 Feb 2021 | ₹17.82 | Semi-Annual |
| 13 May 2022 | ₹11.00 | Interim |
| FY23 – FY25 | ₹0.00 | No dividend declared |
| 10 Aug 2026 | ₹14.00 | Final (FY26) |
Classification: Resumption Payer
This is the single most important fact in Indus Towers' dividend story that a "declared 140% dividend" headline completely hides: the company paid no dividend for three consecutive financial years (FY2023, FY2024, FY2025) after its last payout in May 2022. The FY26 final dividend marks a resumption after a roughly four-year gap. The pause coincided with heavy provisioning against dues from Vodafone Idea, one of Indus Towers' largest customers, and management's decision to prioritise balance-sheet conservatism over shareholder payouts during that uncertainty. The FY26 resumption, backed by a 52% payout ratio, signals renewed board confidence in cash flow visibility — but a single year of resumption does not yet establish a consistent, multi-year payout trend.
Financial Performance Analysis
Revenue (FY26 vs FY25)
₹32,493 Cr vs ₹30,123 Cr
+7.87% YoY growth
Net Profit (FY26 vs FY25)
₹7,145 Cr vs ₹9,932 Cr
-28.06% YoY decline
Operating Leverage Broke Down — And the Reason Is a Base Effect, Not a Business Problem
Revenue grew a healthy 7.87%, yet profit fell 28.06% — a divergence that looks alarming until the FY25 base is examined closely. Indus Towers' Operating Profit (EBITDA) fell 13.74% YoY, from ₹20,650 Cr in FY25 to ₹17,813 Cr in FY26. The FY25 figure was inflated by an exceptional item: the Dec 2024 quarter alone recorded a net profit of ₹4,003 Cr against operating expenses of just ₹589 Cr — a highly unusual combination explained by a one-time write-back of provisions for doubtful receivables (previously provided against Vodafone Idea dues) as collections against past overdues came through. This one-off inflated the FY25 comparative base. Once that base-effect distortion is stripped out, FY26's underlying operating performance — revenue growth of ~8% with EBITDA margins holding near 55% — is broadly in line with the company's normal operating trajectory, not a genuine deterioration in the core tower-leasing business.
Cash Flow Analysis
Operating Cash Flow (FY26)
₹15,684 Cr
vs ₹19,645 Cr in FY25 (-20.16%)
Free Cash Flow (FY26)
₹7,786 Cr
vs ₹13,388 Cr in FY25 (-41.84%)
Cash Is the Real Test — And It Comfortably Clears the Bar
Despite the YoY decline (again distorted by the unusually strong FY25 base), OCF of ₹15,684 Cr covers this year's ₹3,693.48 Cr dividend outflow 4.25 times over, and Free Cash Flow of ₹7,786 Cr covers it 2.11 times over even after funding all capex. This dividend is being funded almost entirely through current-year operating cash generation, not through cash reserves, asset sales, or fresh borrowings. Debtor Days stood at 55 in FY26, an improvement from 58 in FY25 and materially better than the 93-100 day range seen in FY21-22 when Vodafone Idea receivables were most stretched — a sign that working-capital quality on the customer-collections side continues to normalise.
Balance Sheet Strength
Total Borrowings (Mar 2026)
₹21,127 Cr
vs ₹21,156 Cr in FY25 (broadly flat)
Debt-to-Equity Ratio
0.53x
On total equity of ₹39,646 Cr
Borrowings held essentially flat between FY25 and FY26 even as the company resumed dividend payouts, which is a reassuring sign that the payout is not being funded by taking on incremental debt. Note that reported "Borrowings" for a tower infrastructure company under Ind AS 116 typically includes lease liabilities recognised against long-term site leases, alongside conventional financial debt — the two are not separately disclosed in this dataset and are labelled accordingly. Balance sheet Investments stood at ₹4,316 Cr as of March 2026; a fully disaggregated cash-and-bank-balance figure was Not Disclosed by Company in the consolidated summary used for this analysis and should be sourced from the full FY26 Annual Report cash-and-bank-balance note before being cited as a standalone liquidity figure. ROCE stood at 19.5% and ROE at 18.6% for FY26 — both healthy, though down from the elevated (one-off-assisted) FY25 levels.
Dividend Sustainability Analysis
Earnings Coverage (EPS ÷ DPS)
1.93x
Dividend Payout Ratio
51.69%
OCF Coverage
4.25x
FCF Coverage
2.11x
Classification: Moderately Sustainable
Three of the four coverage tests — earnings, OCF, and FCF — are comfortably passed with healthy margin of safety. The payout ratio of roughly 52% leaves meaningful room for reinvestment and debt servicing. The reason this is classified "Moderately Sustainable" rather than "Sustainable" is track record, not current-year math: a single year of resumption after a three-year suspension does not yet constitute an established multi-year pattern, and the company's dividend policy remains sensitive to telecom-sector customer concentration risk (see Key Risks below). Investors should watch at least two to three more payout cycles before treating this as a dependable, recurring income stream.
Peer Comparison
| Company | Div. Yield | Payout Ratio | ROE | ROCE | Mkt Cap |
|---|---|---|---|---|---|
| Indus Towers | 3.70% | 51.69% | 18.6% | 19.5% | ₹99,966 Cr |
| HFCL Ltd | 0.14% | Not Disclosed by Company | 4.21% | Not Disclosed by Company | ₹22,670 Cr |
| Suyog Telematics | 0.10–0.14% | ~2–5% | Not Disclosed by Company | Not Disclosed by Company | ₹886–1,020 Cr |
Indus Towers has no true like-for-like listed peer in India — it is the dominant pure-play passive telecom tower infrastructure company by scale, with a market capitalisation roughly 4.4 times that of HFCL and over 90 times that of Suyog Telematics, the next-closest listed passive-infrastructure name. Both HFCL (a telecom products and network solutions company) and Suyog Telematics (a smaller passive-infrastructure operator) sit in the broader "Telecom" bucket used by exchanges and screeners but differ meaningfully in business model. On the specific metric that matters for this article — dividend yield — Indus Towers stands out clearly: its 3.70% yield is more than 25 times higher than either peer's sub-0.2% yield, reflecting its scale, cash generation, and maturity as a business relative to smaller, growth-reinvestment-focused peers in the same broad sector.
Promoter Impact Analysis
Promoter Holding (Jun 2026)
51.26%
Promoter Dividend Income
₹1,893.28 Cr
Of the total ₹3,693.48 Cr dividend outflow, the promoter group — led by Bharti Airtel, which holds a majority stake in Indus Towers following its 2024 on-market share acquisitions from Vodafone Group — is set to receive approximately ₹1,893.28 Cr, or 51.26% of the total payout. The remaining ₹1,800.20 Cr flows to FIIs (23.20% holding), DIIs (21.42% holding), and public/other shareholders (4.09% combined holding). Promoter holding has actually declined from around 68.99% in early FY24 to 51.26% currently, reflecting the ownership restructuring following Vodafone Group's stake sale, so this dividend cycle is more broadly distributed across institutional and public shareholders than in Indus Towers' pre-2024 dividend history.
Taxation Analysis
Under current Indian tax law, dividends received from domestic companies are fully taxable in the hands of the shareholder at their applicable income tax slab rate; the erstwhile Dividend Distribution Tax regime was abolished with effect from FY2020-21. Indus Towers is required to deduct TDS at 10% on dividend payments exceeding ₹5,000 in a financial year to a resident individual shareholder (higher rates apply for non-residents, subject to applicable tax treaty benefits, and for shareholders who have not furnished PAN). The TDS deducted is available as a credit against final tax liability when filing the income tax return; it is not the final tax paid unless it happens to match the marginal slab rate exactly.
Worked Example: 1,000 Shares, 30% Tax Slab
Gross Dividend (1,000 × ₹14)
₹14,000
Tax Payable @ 30% slab
₹4,200
Net Dividend in Hand
₹9,800
Post-Tax Effective Yield
2.59% (vs 3.70% pre-tax)
Note: TDS deducted by the company at the time of payment is typically 10%, not the shareholder's full slab rate. The ₹4,200 figure above represents the investor's final tax liability at a 30% slab after accounting for the dividend in their total taxable income, adjusted for TDS credit — the actual cash received at payment time will reflect the 10% TDS deduction, with the balance settled at the time of tax filing.
Key Risks
Customer Concentration Risk
A significant share of tenancy revenue is concentrated among a small number of telecom operators, including Vodafone Idea, whose financial health has historically driven Indus Towers' own provisioning and dividend decisions.
Track Record Risk on Dividend Consistency
A three-year dividend suspension (FY23-FY25) preceded this resumption; a single payout cycle does not yet establish a dependable multi-year pattern.
Base-Effect Earnings Volatility
One-off provision write-backs (as seen in FY25) can distort YoY comparisons; investors should track underlying operating trends rather than headline PAT growth alone.
Tenancy and Sharing-Factor Pressure
Industry consolidation among telecom operators can reduce the number of tenants per tower over time, pressuring the sharing-revenue model that underpins Indus Towers' economics.
Leverage from Lease Liabilities
Reported borrowings of ₹21,127 Cr likely include long-term site lease liabilities under Ind AS 116; the precise split between financial debt and lease obligations was Not Disclosed by Company in the data reviewed.
Regulatory and AGSR Overhang
The broader Indian telecom sector remains sensitive to regulatory dues, spectrum payment schedules, and AGR-related developments at operator level, which can indirectly affect tower tenancy economics.
What To Monitor
Dividend Continuity in FY27
Whether the board declares another payout next year will be the real test of whether this is a durable policy shift or a one-off resumption.
Tenancy and Colocation Additions
Net additions in towers and colocations each quarter, especially tied to 5G rollout pace across telecom operators.
Vodafone Idea Payment Trends
Collection trends and any fresh provisioning against dues from this key tenant, which directly affects both earnings and cash flow quality.
Debtor Days Trend
Currently at 55 days (FY26), improved from prior years; a reversal would be an early warning sign on receivables quality.
Capex Cycle for Energy and 5G Infrastructure
Ongoing investment in energy management, solar sites, and densification could pressure free cash flow available for future payouts.
Debt and Lease Liability Trajectory
Whether borrowings stay flat (as in FY26) or rise to fund growth and payouts simultaneously.
Conclusion
Indus Towers' FY26 Final Dividend of ₹14 per share marks the company's return to the dividend list after a three-year hiatus, translating into a 3.70% yield at current market prices against a face-value-based "140%" headline figure that overstates the actual cash return several times over. The payout is well-covered by both earnings (1.93x) and cash flow (OCF coverage of 4.25x, FCF coverage of 2.11x), funded from current-year operations rather than debt or asset sales, and arrives alongside broadly flat borrowings — all constructive signals. At the same time, the steep 28% YoY PAT decline is largely a base-effect artefact from an unusually strong FY25 comparative period rather than genuine business deterioration, though readers should independently verify this distinction rather than take the headline profit-decline number at face value. The single-year resumption after a multi-year suspension means this dividend's durability is not yet proven across cycles. This analysis presents the underlying data, computations, and context; it is not a recommendation to buy, sell, or hold the stock, and readers should form their own view or consult a SEBI-registered investment advisor.
Frequently Asked Questions
What dividend has Indus Towers announced?
What is the dividend yield on Indus Towers shares?
What is the record date for this dividend?
What was the ex-date for the Indus Towers FY26 dividend?
When will the dividend be paid?
Who was eligible to receive this dividend?
How is this dividend taxed for Indian investors?
Is Indus Towers' dividend sustainable?
What is Indus Towers' dividend history?
What should investors monitor going forward?
Why did Indus Towers' net profit fall 28% even though revenue grew?
How much will promoters receive from this dividend?
Disclaimer
This article is prepared for general informational and educational purposes only and does not constitute investment advice, a recommendation, or a solicitation to buy, sell, or hold any security. ShareBazaarOnline and its authors are not SEBI-registered investment advisors or research analysts. All figures are sourced from the company's exchange filing, Screener.in, NSE/BSE data, and secondary aggregators as cited, and are subject to revision; live market prices and yields require re-verification at the time of reading. Items not independently verified are marked "Not Disclosed by Company" or "NIV." Past dividend history and financial performance are not indicative of future results. Readers should conduct their own due diligence or consult a SEBI-registered investment advisor before making any investment decision.