
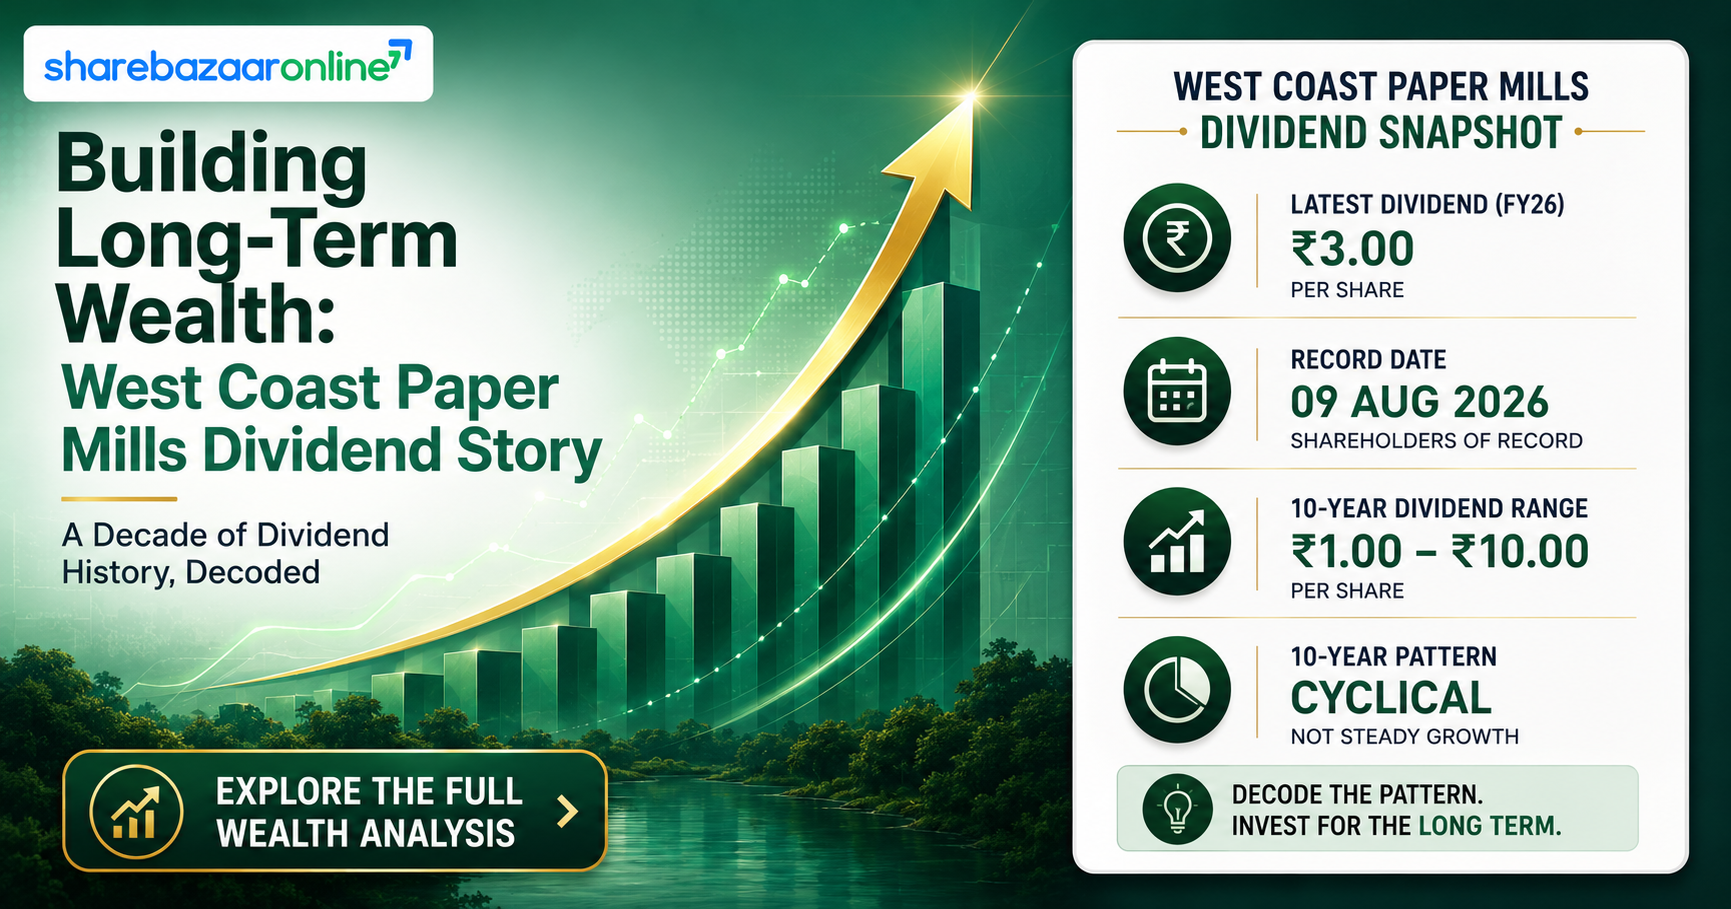
Dividend Snapshot
Company
West Coast Paper Mills Limited
NSE: WSTCSTPAPR | BSE: 500444 | ISIN: INE976A01021
Dividend Type
Final Dividend – FY 2025-26
Approved at the 71st AGM held on August 17, 2026
Dividend Per Share
₹3.00 (150% on Face Value of ₹2)
Real Dividend Yield (on CMP)
0.49%
Calculated on CMP of ₹608 as on 26-Aug-2026. Re-verify against live price.
Record Date
August 10, 2026
Total Dividend Outflow
₹19.81 Crore
Dividend Announcement Summary
West Coast Paper Mills Limited, one of India's oldest integrated paper and paperboard manufacturers, recommended a final dividend of ₹3 per equity share (150% of face value) for the financial year ended March 31, 2026, at its Board Meeting held on May 27, 2026. The Board simultaneously approved the audited standalone and consolidated financial results for Q4 FY26 and the full year, along with the re-appointment of three directors including Joint Managing Director Shri Virendraa Bangur.
This is a step-down from the ₹5 per share (250%) final dividend paid for FY 2024-25, reflecting a sharply lower profit base in FY26. The dividend, being a final dividend, required shareholder approval at the Annual General Meeting — the 71st AGM was held via video conference on August 17, 2026, where all 8 resolutions, including the dividend declaration, were passed.
Investors should note this is a headline face-value yield of 150% — a figure that sounds attractive but is calculated on the ₹2 face value, not the market price. On the CMP of ₹608 (26-Aug-2026), the real cash yield works out to a modest 0.49%. This face-value/market-yield gap is the single most common source of confusion in retail dividend coverage and is addressed in detail in the Yield Analysis section below.
Key Dates Timeline
Board Meeting / Announcement Date
May 27, 2026
Record Date
August 10, 2026
Book Closure Period
August 11 – August 17, 2026 (both days inclusive)
Ex-Date (Inferred, T+1 Settlement)
On or around August 7, 2026
This is a desk inference based on India's T+1 settlement cycle and the record date, not a direct company disclosure. Confirm against the official NSE/BSE corporate-action circular.
AGM Date & Outcome
71st AGM held August 17, 2026 – dividend resolution passed
Payment Date
On or after August 21, 2026 (as disclosed)
The company disclosed only the earliest permissible payment date. The statutory outer limit is 30 days from the AGM (by mid-September 2026). Confirm actual credit/dispatch date with your depository participant.
Dividend Yield Analysis
The Face-Value Yield Illusion: West Coast Paper Mills has declared a dividend of "150%". On the surface this looks like an extraordinary payout. In reality, the 150% figure is calculated on the ₹2 face value of the share — not on what an investor actually paid for the stock in the market. This is a standard but frequently misunderstood convention in Indian corporate disclosures.
Headline Yield (Face Value Basis)
150.00%
₹3 ÷ ₹2 face value × 100
Real Yield on CMP
0.49%
₹3 ÷ ₹608 (CMP, 26-Aug-2026) × 100
Approx. Yield Near Announcement
0.62%
₹3 ÷ ₹486.05 (closing price 25-May-2026, nearest verified data point to the 27-May-2026 announcement). Not an exact announcement-day close.
Prior Year Comparable Yield
₹5 FY25 dividend / historical yield ~1.03–1.04% at time of payment (Aug-Sep 2025)
Yield Reality Check: The real yield has fallen year-on-year — not primarily because the share price rallied sharply, but because the per-share dividend itself was cut from ₹5 to ₹3 (a 40% reduction) as FY26 standalone PAT fell 46% and consolidated PAT fell 54%. This is a case of a shrinking dividend on a broadly stable-to-rising share price, rather than a yield distortion caused by price movement alone. Investors should re-verify the live CMP before relying on the exact yield figure, since all yield calculations are inherently price-dependent and stale at the time of publication.
Dividend History Analysis
| Financial Year (Ex-Date) | Dividend/Share (₹) | % of Face Value | Type |
|---|---|---|---|
| FY26 (Aug 2026, record date) | 3.00 | 150% | Final |
| FY25 (Aug 14, 2025) | 5.00 | 250% | Final |
| FY24 (Aug 6, 2024) | 8.00 | 400% | Annual |
| FY23 (Aug 9, 2023) | 10.00 | 500% | Annual |
| FY22 (Aug 8, 2022) | 6.00 | 300% | Annual |
| FY21 (Sep 15, 2021) | 1.00 | 50% | Annual |
| FY19-20 (Mar 19, 2020) | 5.00 | 250% | Not Disclosed by Company (frequency) |
| FY19 (Jul 22, 2019) | 5.00 | 250% | Annual |
| FY18 (Aug 9, 2018) | 4.00 | 200% | Annual |
| FY17 (Aug 16, 2017) | 2.50 | 125% | Annual |
Source: third-party dividend trackers (TipRanks, cross-checked against company filings for FY25/FY26). NIV where marked; face-value consistency across the full 10-year span has not been independently re-verified against historical corporate-action circulars for any intervening bonus/split events — desk re-run recommended before publication if the full decade figure is cited.
Classification: Cyclical Payer. West Coast Paper Mills' dividend has moved in a wide band — from ₹1 (FY21, a pandemic-hit trough year) to ₹10 (FY23, a windfall year driven by exceptional pulp and paper pricing) and back down to ₹3 for FY26. This pattern tracks the company's underlying earnings cyclicality tightly rather than reflecting a smoothed, progressive dividend policy. There have been no outright dividend suspensions in the period reviewed, but the swings are large enough that investors should not extrapolate a "trend" from any single year's payout.
Financial Performance Analysis
Consolidated Revenue FY26
₹4,278.79 Cr (+5.33% YoY)
Standalone Revenue FY26
₹2,498.49 Cr (-0.51% YoY)
Consolidated PAT FY26 (Owners)
₹150.60 Cr (-53.6% YoY)
Standalone PAT FY26
₹153.53 Cr (-46.07% YoY)
Operating Leverage Breakdown: Revenue growth (consolidated +5.3%) and profit decline (-53.6%) moved in opposite directions in FY26 — a classic sign of margin compression rather than a demand problem. Consolidated EBITDA fell from ₹691.58 Cr to ₹527.32 Cr, and the EBITDA margin compressed by roughly 470 basis points, from 17.02% in FY25 to 12.32% in FY26. This points to cost-side pressure — higher input (pulp/wastepaper) and power & fuel costs, alongside weaker price realizations in the paper segment — rather than any fall in volumes sold.
Sequential Recovery Signal: Q4 FY26 alone showed a sharp turnaround versus the preceding quarters — consolidated PAT of ₹53.98 Cr in Q4 FY26 was up 82% over the comparative quarter and standalone PAT margin expanded to roughly 7% in Q4 versus roughly 3% in Q3, per the company's own press release. This suggests the worst of the margin compression may be behind the company, though one quarter is not a trend and should be watched into FY27.
Cash Flow Analysis
Consolidated OCF FY26
₹400.35 Cr
Up sharply from ₹99.21 Cr in FY25
Consolidated Free Cash Flow FY26
₹19 Cr
Recovered from -₹350 Cr in FY25, but still thin after a large capex cycle
Cash is fact, profit is opinion: Reported PAT fell 53.6% at the consolidated level in FY26, yet operating cash flow actually improved four-fold to ₹400 Cr from ₹99 Cr in FY25. This divergence is explained by working-capital unwinding — inventories released ₹67.72 Cr and trade receivables absorbed a smaller amount than the prior year — combined with a large non-cash depreciation charge of ₹248.31 Cr sitting above the profit line. This is a genuinely positive quality-of-earnings signal: the cash engine is stronger than the headline profit number suggests.
Free Cash Flow funding source: After ₹380.26 Cr of capital expenditure (property, plant, equipment and intangibles) during FY26, consolidated free cash flow was barely positive at ₹19 Cr. On a standalone basis, capex of ₹79.00 Cr against operating cash flow of ₹297.76 Cr left healthier headroom. The FY26 final dividend of ₹19.81 Cr is therefore funded primarily from current earnings and accumulated cash/liquid-investment reserves (₹1,189.78 Cr consolidated) rather than from incremental borrowing — consolidated borrowings actually fell from ₹456 Cr to ₹345 Cr during the year.
Receivables vs Revenue: Consolidated trade receivables rose from ₹350.25 Cr to ₹387.15 Cr (roughly +10.5%) against revenue growth of only 5.3%, a modest but not alarming divergence that debtor days data (33 days in FY26 versus 31 days in FY25) confirms is a minor, not a red-flag, deterioration.
Balance Sheet Strength
Consolidated Gross Borrowings (FY26)
₹345 Cr (down from ₹456 Cr in FY25)
Net Debt (Consolidated)
₹312.79 Cr
Cash & Equivalents (Consolidated)
₹32.21 Cr
Cash + Current Investments (Consolidated)
₹1,189.78 Cr
West Coast Paper Mills carries a comfortable balance sheet for a capital-intensive paper manufacturer. Net debt of roughly ₹313 Cr sits against a consolidated net worth (equity) of ₹4,186 Cr, implying a low net debt-to-equity ratio of approximately 0.07x. Book value per share stood at approximately ₹546, against a CMP of ₹608 — the stock trades at roughly 1.11x book value. The Group's total borrowings actually declined during FY26 even as it funded a large capex programme, indicating internal accruals largely financed growth capex rather than fresh leverage.
Dividend Sustainability Analysis
Test 1: Earnings Coverage
7.6x – 7.75x
EPS ÷ DPS (standalone & consolidated)
Test 2: OCF Coverage
20.19x
Consolidated OCF ₹400 Cr ÷ Dividend Outflow ₹19.81 Cr
Test 3: FCF Coverage
0.96x
Consolidated FCF ₹19 Cr ÷ Dividend Outflow ₹19.81 Cr — tight, driven by a heavy capex cycle
Test 4: Cash/Liquidity Coverage
60.05x
Cash + Current Investments ₹1,189.78 Cr ÷ Dividend Outflow
Verdict: Moderately Sustainable. Three of the four tests — earnings coverage, operating cash flow coverage, and liquid balance-sheet coverage — comfortably clear the dividend obligation, several times over. The only soft spot is free cash flow coverage, which sits just under 1x for FY26 because the company ran a large capital expenditure programme (₹380 Cr consolidated) during the year, largely toward the Cable/Optical Fibre backward-integration project referenced in management commentary. A sub-1x FCF coverage during a capex cycle is not automatically a red flag — it is a normal feature of investment-phase paper/cable manufacturers — provided the balance sheet (as here) has the liquidity cushion to absorb it, which it does.
The low payout ratio of ~13% of profits (compared to a 3-year average of ~10.5% flagged by independent data providers) also gives management considerable headroom; this is a conservative, earnings-linked dividend policy rather than a stretched one.
Peer Comparison
| Company | Dividend Yield | P/E | ROE (TTM) | ROCE | Market Cap |
|---|---|---|---|---|---|
| West Coast Paper Mills | 0.49% | 17.5x | 4.25% | 6.17% | ₹4,016 Cr |
| JK Paper | ~1.32% | ~21.2x | Not Disclosed by Company (NIV) | Not Disclosed by Company (NIV) | ~₹6,863 Cr |
| Andhra Paper (WCPM subsidiary) | ~1.36% | ~66.2x | Not Disclosed by Company (NIV) | Not Disclosed by Company (NIV) | ~₹1,551 Cr |
Peer figures sourced from third-party data providers as of late July 2026; cross-verify before publication. Andhra Paper is disclosed as a subsidiary of West Coast Paper Mills in Annexure I of the FY26 consolidated audit report.
On a pure yield basis, West Coast Paper Mills' 0.49% trails both JK Paper (~1.3%) and its own subsidiary Andhra Paper (~1.4%), largely because WCPM's FY26 dividend per share was cut more sharply in percentage terms than peers'. WCPM's P/E of 17.5x sits below JK Paper's ~21.2x, suggesting the market prices WCPM at a relative discount within the sector — potentially reflecting the sharper FY26 margin compression and the subsidiary-level operational disruption discussed under Key Risks.
Promoter Impact Analysis
Promoter Holding (Jun 2026)
56.58%
Promoter Dividend Income
₹11.21 Crore
Of the total ₹19.81 Crore dividend outflow, the SK Bangur Group promoter entities — holding a steady 56.58% stake — are estimated to receive approximately ₹11.21 Crore, with the remaining ₹8.60 Crore flowing to public, FII and DII shareholders. Promoter holding has remained essentially flat over the last three years (56.53% to 56.58%), with no pledging disclosed, and FII holding has steadily declined from over 8% in early FY24 to roughly 2.6% by June 2026, replaced largely by rising DII participation (from ~7% to over 13.6% in the same window) — a sign of increasing domestic institutional comfort with the stock even as the dividend itself was cut.
Taxation Analysis
Under the current Indian income-tax regime, dividends received from domestic companies are fully taxable in the hands of the shareholder at their applicable income-tax slab rate (there is no separate concessional dividend tax rate for individuals). The company is required to deduct TDS under Section 194 at 10% if the dividend paid to a resident individual shareholder exceeds ₹10,000 in a financial year (no TDS threshold benefit applies to NRI shareholders, who face TDS at rates prescribed for non-residents, subject to applicable DTAA relief).
Worked Example
Investor holding 1,000 shares of West Coast Paper Mills, dividend of ₹3/share, taxed at the 30% slab (plus applicable 4% Health & Education Cess):
| Gross Dividend (1,000 × ₹3) | ₹3,000.00 |
| Income Tax @ 30% slab | ₹900.00 |
| Health & Education Cess @ 4% of tax | ₹36.00 |
| Total Tax Liability | ₹936.00 |
| Net Dividend Received (in hand) | ₹2,064.00 |
| Effective Tax Rate on Dividend | 31.20% |
This example assumes no other deductions and reflects only the tax on dividend income; TDS deducted at source by the company (10% for resident individuals, if applicable) is adjustable against this final slab-rate liability while filing the income-tax return. Consult a qualified tax advisor for your specific situation.
Key Risks
Subsidiary Operational Disruption
The company disclosed a subsequent event: operations at subsidiary Andhra Paper's Kadiyam manufacturing facility were interrupted from April 27, 2026 by an illegal strike over contractual terms, leading management to announce a lockout from May 1, 2026 that remained ongoing as of the board meeting date. This is a live, unresolved industrial-relations risk at a material Group subsidiary.
Sharp Earnings Cyclicality
Consolidated PAT has swung from a FY23 peak of ₹1,087 Cr to ₹156 Cr in FY26 — an 86% decline over three years — reflecting the paper industry's exposure to global pulp prices and realizations, which can reverse the current earnings recovery narrative quickly.
Margin Compression Risk
A 470 bps EBITDA margin contraction in FY26 shows real vulnerability to input cost inflation (raw material, power and fuel) that management has only partially offset through pricing.
Thin Free Cash Flow Cushion
Consolidated FCF coverage of dividend outflow is barely above 1x for FY26; any further step-up in capex without a matching profit recovery could pressure the sustainability of future payouts.
Regulatory / Labour Code Transition
The company has flagged the transition to India's New Labour Codes (effective November 21, 2025) as an area still being assessed for accounting and operational impact across the Group.
Low Absolute Yield
At 0.49% on CMP, income-focused investors receive a modest cash return relative to peers, making the investment case dependent on capital appreciation and earnings recovery rather than yield alone.
What To Monitor
Resolution of the Kadiyam Lockout
Watch subsequent stock-exchange filings from Andhra Paper/WCPM on when the Kadiyam facility resumes normal operations and the estimated financial impact.
Q1 & Q2 FY27 Margin Trajectory
Confirm whether the Q4 FY26 margin recovery (EBITDA margin back up to ~19% consolidated in the June 2026 quarter per Screener data) sustains into the new fiscal year.
Pulp & Wastepaper Input Costs
Global pulp and domestic wastepaper price trends directly drive the company's raw material cost line and hence future dividend capacity.
Cable Division Capex Payback
Management has flagged the backward-integrated draw tower for the Optical Fibre plant as now stabilised; monitor whether this translates into segment profitability improvement.
Free Cash Flow Recovery
Track whether FY27 free cash flow comfortably exceeds the dividend outflow again, restoring the fourth sustainability test to a clear pass.
Shareholding Pattern Shifts
Continue tracking the FII-to-DII rotation in the shareholder base, which can influence stock liquidity and volatility around results.
Conclusion
West Coast Paper Mills' FY26 final dividend of ₹3 per share marks a meaningful reduction from the ₹5 paid a year earlier, mirroring a sharp fall in both standalone and consolidated profitability during a tough year for realizations and input costs in the paper sector. The headline "150%" figure, calculated on face value, translates to a real market yield of under 0.5% — modest by both historical and peer standards.
On the sustainability scorecard, the dividend is comfortably covered by earnings, operating cash flow, and the company's substantial liquid reserves; the sole caution flag is a thin free-cash-flow cushion during an active capex cycle, alongside an unresolved industrial dispute at subsidiary Andhra Paper's Kadiyam plant that bears watching. The data points here are presented for informational purposes only and do not constitute investment advice; readers should weigh the positives, negatives and monitoring factors above against their own research and risk appetite.
Frequently Asked Questions
What dividend has West Coast Paper Mills announced for FY26?
What is the real dividend yield on West Coast Paper Mills stock?
What was the record date for the West Coast Paper Mills FY26 dividend?
What was the ex-dividend date?
When was the dividend paid?
Who was eligible to receive this dividend?
How is this dividend taxed for Indian investors?
Is the West Coast Paper Mills dividend sustainable?
What is West Coast Paper Mills' dividend history?
Why did the dividend fall from ₹5 to ₹3 per share this year?
What should investors monitor going forward?
How much dividend income will promoters receive?
Disclaimer
This article is for informational and educational purposes only and does not constitute investment advice, a recommendation, or a solicitation to buy, sell, or hold any security. ShareBazaar Online is not a SEBI-registered investment advisor or research analyst. All figures, dates, and ratios presented are based on publicly available company filings, exchange disclosures, and third-party data sources believed to be reliable as of the date of publication, but their accuracy is not guaranteed and they may change without notice — particularly CMP-dependent yield figures, which should always be re-verified against live market prices. Readers should conduct their own independent research or consult a SEBI-registered financial advisor before making any investment decision. Past dividend performance is not indicative of future payouts.