
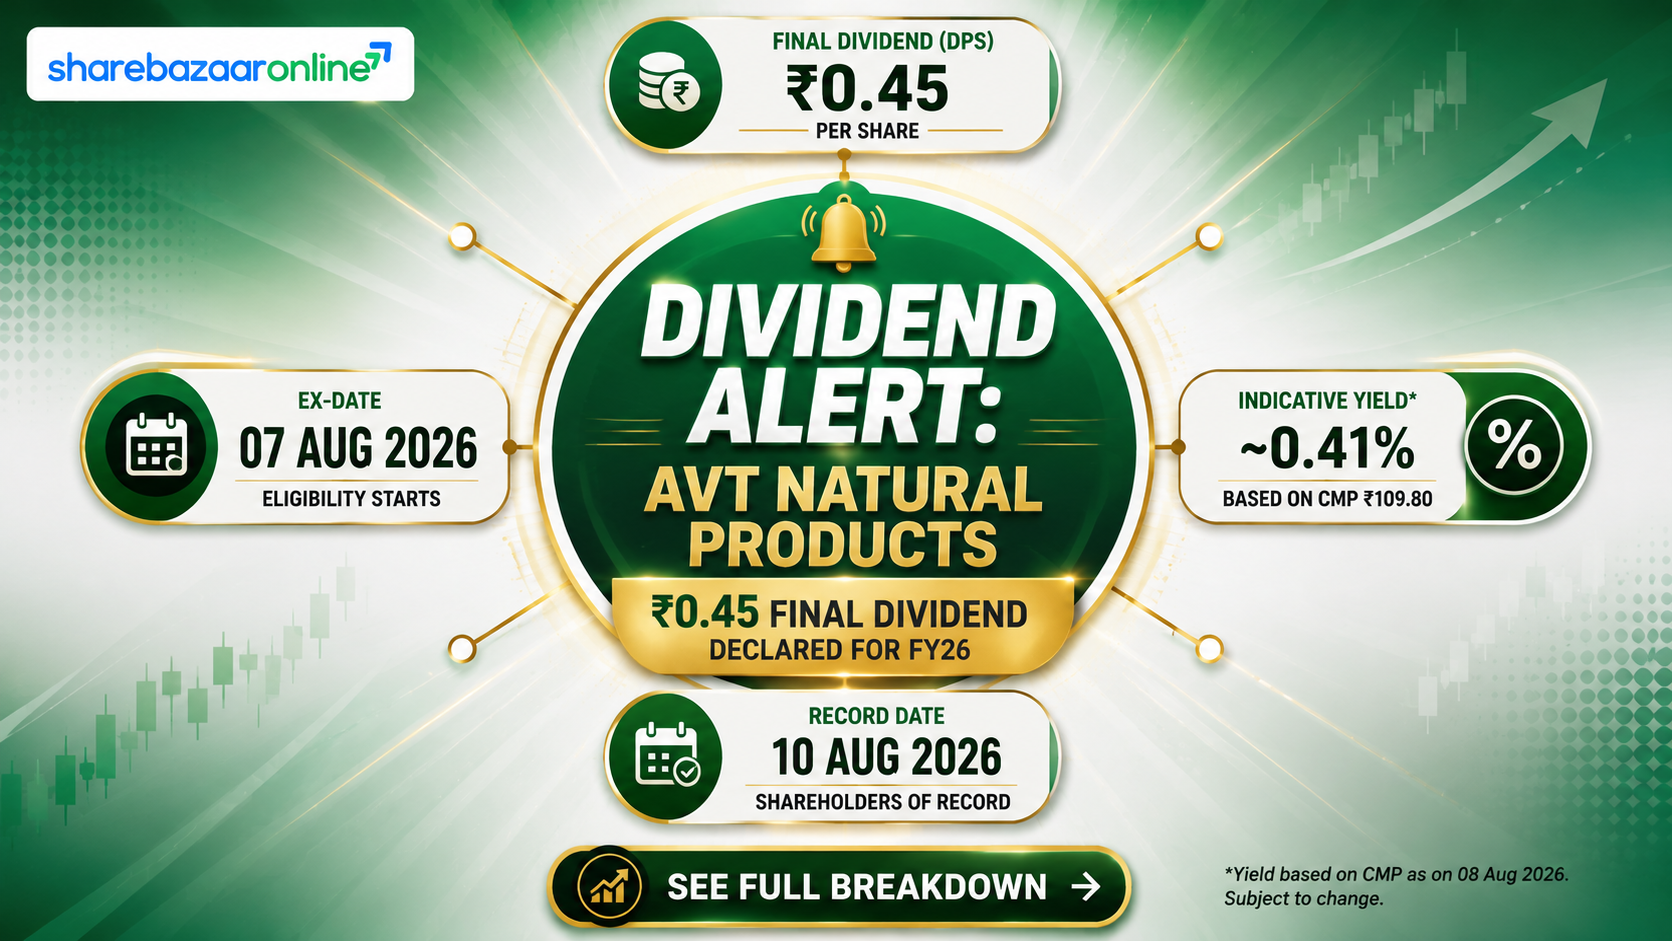
Dividend Snapshot
Company
AVT Natural Products Limited
NSE: AVTNPL | BSE: 519105 | ISIN: INE488D01021
Dividend Type
Final Dividend, FY 2025-26
Approved at the 40th AGM held August 17, 2026
Dividend Per Share
₹0.45
45% of face value ₹1 per equity share
Real Market Yield (Final Dividend)
0.52%
Computed on CMP ₹87.20 (25-Aug-2026 close), not the 45% face-value headline figure
Record Date
August 10, 2026 (already passed)
Payment Date
Not Disclosed by Company — statutory outer limit is 30 days from AGM (by September 16, 2026)
Dividend Announcement Summary
AVT Natural Products Limited, a part of the A.V. Thomas Group and a manufacturer of marigold oleoresins, spice oleoresins and value-added teas, recommended a final dividend of ₹0.45 per equity share (45% of face value ₹1) for FY 2025-26 at its board meeting held on May 28, 2026, alongside its audited full-year results. This came on top of an interim dividend of ₹0.35 per share (35%) already paid during the year, taking the aggregate FY26 dividend to ₹0.80 per share (80%).
Board Meeting Sequence
May 28, 2026 — Final dividend recommended along with FY26 audited results.
June 9, 2026 — Board fixed the record date and AGM date, and approved a board reshuffle.
August 17, 2026 — 40th AGM approved the final dividend.
Management Commentary
Management flagged that quarterly results carry inherent seasonality typical of the agri-extracts business, cautioning that any single quarter should not be read as indicative of the full-year trend.
Key Dates Timeline
Board Recommendation
May 28, 2026
Record Date Fixed / Book Closure Announced
June 9, 2026
Book Closure Period
August 11 – August 17, 2026 (both days inclusive)
Ex-Date (T+1 inference — not company-disclosed)
August 7, 2026 (last trading day before book closure)
Record Date
August 10, 2026
40th AGM (Dividend Approval)
August 17, 2026 — Approved
Payment Date
Not Disclosed by Company. Under SEBI LODR norms, final dividends must be paid within 30 days of AGM approval — implying an outer limit of September 16, 2026. This is a statutory ceiling, not a confirmed payment date.
Dividend Yield Analysis
The face-value yield illusion: AVT Natural's final dividend is described in disclosures as "45%." That percentage is calculated on the ₹1 face value, not on what an investor actually paid for the share. On the latest market price of ₹87.20 (Screener.in, close of August 25, 2026), the same ₹0.45 payout works out to a real yield of just 0.52% — roughly 87 times smaller than the headline percentage suggests.
Final Dividend Yield (Latest CMP)
0.52%
₹0.45 ÷ ₹87.20 × 100
Total FY26 Dividend Yield (Latest CMP)
0.92%
₹0.80 ÷ ₹87.20 × 100 — matches Screener.in's trailing yield figure
Announcement-Date Yield (28-May-2026) — Not Independently Verified
An exact NSE closing price for the announcement date could not be independently confirmed. Using the nearest available reference prices (₹67.78 on 11-May-2026 and ₹71.09 on 22-Jun-2026), the implied announcement-window yield range is approximately 0.63% – 0.66%. Desk should re-verify the exact May 28, 2026 closing price before publishing.
Dividend History Analysis
| Financial Year | Total DPS (₹) | Payout % | Basis |
|---|---|---|---|
| FY2026 | 0.80 | 19% | Company-disclosed (Interim ₹0.35 + Final ₹0.45) |
| FY2025 | 0.70 | 22% | Company-disclosed (Interim ₹0.30 + Final ₹0.40) |
| FY2024 | ~0.80 | 23% | NIV — derived from payout % × EPS |
| FY2023 | ~1.00 | 20% | NIV — derived from payout % × EPS |
| FY2022 | ~1.00 | 21% | NIV — derived from payout % × EPS |
| FY2021 | ~0.70 | 24% | NIV — derived from payout % × EPS |
| FY2020 | ~0.60 | 27% | NIV — derived from payout % × EPS |
| FY2019 | ~0.40 | 29% | NIV — derived from payout % × EPS |
| FY2018 | ~0.40 | 25% | NIV — derived from payout % × EPS |
| FY2017 | ~0.40 | 25% | NIV — derived from payout % × EPS |
| FY2016 | ~0.40 | 28% | NIV — derived from payout % × EPS |
Classification: Consistent Payer
AVT Natural has paid a dividend every year across this 10-year window, with no visible suspensions. The per-share amount has trended broadly upward, though it dipped in FY2024-25 after the FY2022-23 peak, tracking the earnings cycle rather than following a smooth staircase.
Corporate Actions Note
The company carried out a 1:1 bonus issue in 2013, outside this 10-year comparison window, so no Ind AS 33 restatement is required for the years shown above.
Financial Performance Analysis
Consolidated FY26 vs FY25
Revenue: ₹713.23 cr vs ₹558.86 cr (+27.6%)
Operating Profit: ₹90 cr vs ₹73 cr (+23.3%)
Net Profit: ₹64.81 cr vs ₹48.23 cr (+34.4%)
EPS: ₹4.26 vs ₹3.17
Standalone FY26 vs FY25
Revenue: ₹683.77 cr vs ₹522.04 cr (+31.0%)
Net Profit: ₹53.85 cr vs ₹38.07 cr (+41.5%)
Profit growth (+34.4% consolidated) outpaced revenue growth (+27.6%) this year, indicating genuine operating leverage rather than a base-effect illusion — operating profit margin held at roughly 13% versus 13% in FY25, a stabilisation after margin compression seen through FY24-FY25. The standalone entity — which is the entity that actually declares and pays this dividend — grew profit even faster (+41.5%), reflecting stronger performance at the parent versus overseas subsidiaries.
Caution Flag
Screener.in's automated checklist flags two structural concerns worth weighing alongside the strong FY26 print: 5-year sales CAGR of only 8.01%, and 3-year average ROE of 11.3% — both below what the FY26 headline growth numbers alone would suggest. Debtor days have also risen from 101 to 123, a working-capital signal explored in the Cash Flow section below.
Cash Flow Analysis
Reported profit is an opinion; cash is a fact — and AVT Natural's FY26 cash flow tells a more cautious story than its P&L. Consolidated operating cash flow (OCF) for FY26 was just ₹12 crore, against a reported net profit of ~₹65 crore — a conversion of only about 33% of operating profit into cash, down sharply from 149% two years earlier in FY24 and only a partial recovery from the negative ₹32 crore OCF recorded in FY25.
Free Cash Flow FY26
-₹11 crore
Negative for the second consecutive year (FY25: -₹42 cr)
Receivables Signal
Debtor Days: 101 → 123
Receivables are growing faster than revenue, tying up cash
How Is This Dividend Actually Funded?
With FY26 free cash flow negative at -₹11 crore against a total FY26 dividend outflow of ₹12.18 crore, the payout is not funded from free cash flow generated this year. It is being funded from the company's existing cash and investment balance (₹116 crore on the balance sheet) rather than fresh operating cash generation — a distinction investors should register even though the company remains solidly profitable on paper.
Balance Sheet Strength
Cash & Investments (FY26)
₹116 crore
Total Borrowings (FY26)
₹114 crore
Broadly flat vs ₹113 crore in FY25
Reserves & Surplus
₹544 crore
Book Value per Share
₹36.7
Debt has essentially held steady year-on-year even as dividends continued to be paid, which is a reassuring sign — the company is not visibly borrowing to fund shareholder payouts. Cash and investments of ₹116 crore cover the total FY26 dividend outflow of ₹12.18 crore nearly 9.5 times over, giving the balance sheet ample cushion even though current-year free cash flow was negative.
Dividend Sustainability Analysis
Earnings Coverage
5.32x (Consol) / 4.42x (Standalone)
EPS ÷ Total FY26 DPS — comfortably covered
OCF Coverage
0.98x
Operating cash flow barely covers the total FY26 payout
FCF Coverage
-0.90x
Negative — dividend not funded by this year's free cash flow
Cash/Liquidity Coverage
9.5x
Balance-sheet cash and investments comfortably cover the payout
Verdict: Moderately Sustainable
Earnings comfortably cover the dividend and the balance sheet has ample liquidity, so there is no near-term risk to the payout. However, two consecutive years of negative free cash flow — driven by rising debtor and inventory days rather than debt-funded capex — mean the dividend is currently being supported by the balance sheet rather than fresh cash generation. This is not automatically a red flag given the cash cushion, but sustained FCF weakness beyond FY27 would warrant a re-rating of this classification.
Peer Comparison
| Company | Div. Yield | ROE | Notes |
|---|---|---|---|
| AVT Natural Products | 0.92% | 12.2% | Agri-extracts, small-cap |
| Godrej Agrovet | 2.02% (NIV) | 23.3% (NIV) | Larger diversified agri-business peer |
| Agri/FMCG Sector (broad) | ~1.5-2.5% (NIV) | — | Indicative sector range only |
AVT Natural's dividend yield sits below larger diversified agri-business peers such as Godrej Agrovet, and its ROE of 12.2% also trails that comparison. This is consistent with AVT's smaller scale, higher earnings volatility from commodity input costs, and lower payout ratio (19% versus a wider 25-30% band typical among more mature agri-processors) — the company is retaining more of its earnings rather than distributing it, which supports a Sustainable-to-Moderate rating rather than a high-yield income profile.
Promoter Impact Analysis
Promoter Holding (A.V. Thomas Group)
75.00%
Promoter Dividend Income (Final Dividend)
₹5.14 crore
Of the total ₹6.85 crore final dividend outflow, the promoter group — chaired by Mr. Ajit Thomas — receives approximately ₹5.14 crore, with the remaining 25% public shareholding (FIIs, DIIs, and retail investors combined) sharing roughly ₹1.71 crore. Across the full FY26 payout of ₹12.18 crore, promoter dividend income totals approximately ₹9.14 crore. Promoter holding has remained unchanged at 75.00% for the past several quarters, indicating no recent pledging, dilution, or stake-building activity tied to this dividend cycle.
Taxation Analysis
Dividends from Indian companies are fully taxable in the hands of shareholders at their applicable income tax slab rate — there is no separate concessional dividend tax regime. Companies deduct TDS under Section 194 at 10% if the dividend paid to a resident individual exceeds ₹5,000 in a financial year (no TDS threshold trigger applies for most retail-sized holdings on this scale of payout). The final tax liability is settled by the shareholder while filing their income tax return, based on their actual slab.
Worked Example — AVT Natural Final Dividend
An investor holding 1,000 shares of AVT Natural Products receives the ₹0.45 per share final dividend as follows, assuming the investor falls in the 30% tax slab:
Gross Dividend: 1,000 shares × ₹0.45 = ₹450.00
Tax @ 30% slab: ₹135.00
Net Dividend in Hand: ₹315.00
Pre-tax yield: 0.52% | Post-tax effective yield: 0.36%
Key Risks
1. Negative free cash flow: Two consecutive years of negative FCF (-₹42 cr FY25, -₹11 cr FY26) mean the dividend currently draws on the balance sheet rather than fresh cash generation.
2. Rising working capital intensity: Debtor days climbed from 101 to 123 and the cash conversion cycle stretched to 327 days, tying up cash in the business.
3. Weak 5-year sales growth: Compounded sales growth of only 8.01% over five years lags the strong single-year FY26 print, raising the question of whether FY26 growth is sustainable or partly cyclical.
4. Commodity input volatility: As a processor of marigold, spice, and tea-derived extracts, margins are exposed to agricultural raw material price swings and currency movements on export revenue.
5. Low absolute ROE: 3-year average ROE of 11.3% is modest, and Screener's automated checklist flags this explicitly as a structural concern.
6. Concentrated promoter holding: At 75% promoter ownership, free-float liquidity is thin, which can amplify price volatility around corporate action dates.
What To Monitor
1. FCF trajectory in FY27: Whether free cash flow turns positive as receivables and inventory normalise will determine if the "Moderately Sustainable" rating can be upgraded.
2. Debtor and inventory days trend: Continued deterioration beyond the current 123 debtor days / 348 inventory days would be a cash-flow warning sign.
3. Payment date confirmation: The actual payment date for this final dividend, expected by September 16, 2026 at the latest.
4. Q1 FY27 performance: The company's board already approved Q1 FY27 unaudited results on August 14, 2026, with consolidated PAT of ₹31.10 crore — a strong start worth tracking against the full-year trajectory.
5. New CEO execution: Mr. K. Nandakumar's five-year term as Manager and CEO began May 28, 2026; his operational strategy will shape margin and growth trends going forward.
Conclusion
AVT Natural Products' ₹0.45 final dividend — an 80% total FY26 payout of ₹0.80 per share when combined with the earlier interim dividend — reflects a company delivering strong reported profit growth (consolidated PAT up 34.4%) with earnings comfortably covering the payout at over 5 times. At the same time, the real market yield of 0.52% on the final tranche is far more modest than the 45% headline figure implies, and two straight years of negative free cash flow mean the dividend currently draws on the company's cash reserves rather than the year's own cash generation. Shareholders eligible as of the August 10, 2026 record date should note this is informational analysis only — not a recommendation to buy, sell, or hold the stock.
Frequently Asked Questions
What dividend has AVT Natural Products declared for FY26?
What is the dividend yield on AVT Natural Products' final dividend?
What was the record date for AVT Natural Products' final dividend?
What was the ex-date for this dividend?
When will the final dividend be paid?
Who was eligible to receive this dividend?
How is this dividend taxed for Indian investors?
Is AVT Natural Products' dividend sustainable?
What is AVT Natural Products' dividend history?
What should investors monitor going forward?
How much dividend income does the promoter group receive?
What is AVT Natural Products' dividend payout ratio?
Disclaimer
This article is for informational and educational purposes only and does not constitute investment advice, a recommendation, or a solicitation to buy, sell, or hold any security. ShareBazaar Online is not a SEBI-registered investment adviser or research analyst. All figures are based on publicly available company filings, exchange disclosures, and third-party financial data sources believed to be reliable but not independently audited by us; figures marked "Not Disclosed by Company" or "NIV (Not Independently Verified)" should be cross-checked before relying on them. Past dividend performance is not indicative of future payouts. Readers should consult a SEBI-registered financial advisor and review official NSE/BSE filings before making any investment decision. Live CMP and yield figures should be re-verified before publication as market prices change continuously.