
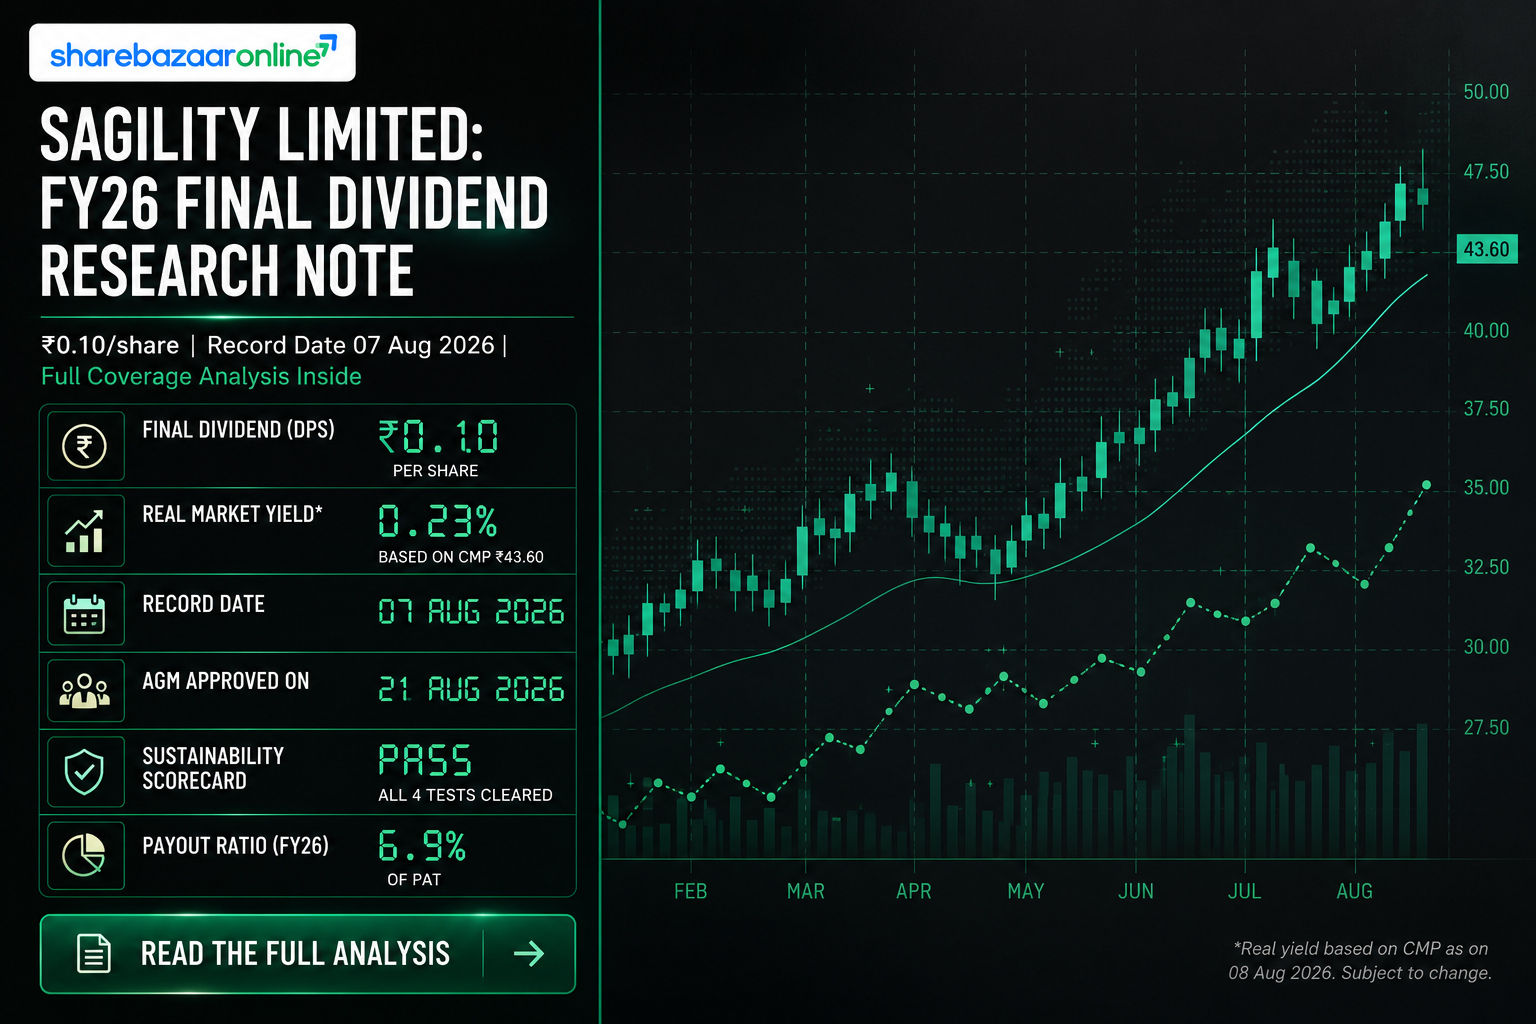
Dividend Snapshot
Company
Sagility Limited
NSE: SAGILITY | BSE: 544282 | ISIN: INE0W2G01015
Dividend Type
Final Dividend
For Financial Year 2025-26 (year ended 31 March 2026)
Dividend Per Share
₹0.10 per equity share
On face value of ₹10 each (1% of face value)
Dividend Yield (on latest CMP)
0.23%
Computed on CMP ₹43.23 (24-Aug-2026 close) — re-verify before publish
Record Date
7 August 2026
Already elapsed as of this update
Payment Date
On or before 18 September 2026
Statutory outer limit disclosed by company; exact credit date not disclosed
Dividend Announcement Summary
The Board of Directors of Sagility Limited, at its meeting held on 12 May 2026, recommended a final dividend of ₹0.10 per equity share of face value ₹10 each for the financial year ended 31 March 2026. The recommendation was made alongside the audited standalone and consolidated financial results for Q4 FY26 and the full year, and was explicitly stated to be subject to shareholder approval at the company's Annual General Meeting.
Shareholder Approval Status
Approved at the company's 5th Annual General Meeting held on 20 August 2026 (conducted via video conferencing), where shareholders adopted the FY26 financial statements and confirmed the final dividend.
Context: Second Dividend of FY26
This final dividend follows an earlier interim dividend of ₹0.05 per share declared on 29 October 2025 for FY26 — making this Sagility's first-ever full-year dividend cycle as a listed company (IPO: November 2024).
Management Commentary (Q4 & FY26 Results, 12 May 2026)
Management reported consolidated Q4 FY26 net profit growth of 41.2% YoY to ₹257.7 crore on revenue of ₹2,024.2 crore (up 29% YoY). For the full year, revenue grew 29.1% YoY to ₹7,192.9 crore and net profit grew 71.5% YoY to ₹924.8 crore. On the earnings call, management guided to low double-digit constant-currency revenue growth and an adjusted EBITDA margin of 24–25% for FY27, and reiterated its plan to fully repay current debt by the end of FY27. Despite the strong numbers, the stock declined 4.24% on results day amid concerns over flattish EBITDA margins.
Key Dates Timeline
Board Recommendation
12 May 2026
Record Date (fixed by company, 09 Jul 2026 intimation)
7 August 2026
Ex-Date (Inferred)
6 August 2026
Under India's T+1 settlement, the ex-date is inferred as one trading day before the record date. This is an analytical inference, not a figure disclosed by the company or exchanges — verify against the official NSE/BSE corporate-action circular.
AGM Date (Shareholder Approval)
20 August 2026
Approved via video conferencing
Payment Date
On or before 18 September 2026
Statutory outer limit (30 days from AGM declaration); exact disbursal date is "Not Disclosed by Company"
Status as of this update
Record date elapsed; payment pending
Dividend Yield Analysis
The face-value yield illusion: Sagility's final dividend is often quoted as "1%" in exchange filings — but that figure is calculated on the ₹10 face value, not on what an investor actually pays for the stock. On the market price, the real yield is far smaller.
Declared "Dividend %" (on Face Value)
1.00%
₹0.10 ÷ ₹10 face value
Real Dividend Yield (on Latest CMP)
0.23%
₹0.10 ÷ ₹43.23 (24-Aug-2026 close)
Yield on Announcement-Day CMP
0.23%
₹0.10 ÷ ₹43.09 (12-May-2026 close)
Total FY26 Yield (Interim + Final)
0.35%
(₹0.05 + ₹0.10) ÷ ₹43.23
Why the yield is low despite a growing business: Sagility is not a mature cash-return story yet. It listed in November 2024, carries residual acquisition-related debt from its buyout history, and has chosen to retain the overwhelming majority of profit (payout ratio under 8% for the full year) to fund debt repayment and reinvestment. The low yield reflects a growth/deleveraging phase, not distress — the coverage metrics below confirm the dividend itself is comfortably affordable.
Dividend History Analysis
Complete Dividend Record (since IPO, Nov 2024)
| Type | Announced | DPS | FY |
|---|---|---|---|
| Interim Dividend | 29-Oct-2025 | ₹0.05 | FY2025-26 |
| Final Dividend | 12-May-2026 | ₹0.10 | FY2025-26 |
Classification: New Dividend Payer. Sagility paid no dividends in FY2022-23, FY2023-24 or FY2024-25 — consistent with a recently-listed, private-equity-backed company that used post-listing cash flow to deleverage first (borrowings fell from ₹2,896 crore in FY23 to ₹1,111 crore in FY26). FY2025-26 marks the company's first dividend-paying year, with two payouts (interim + final) totalling ₹0.15/share. There is no 10-year history to review, and no special dividends, cuts, or suspensions to date — a 10-year trend classification (Consistent/Cyclical/Irregular) cannot be meaningfully applied yet; this should be treated as "Track Record: Not Yet Established" rather than forced into a legacy category.
Financial Performance Analysis
Revenue FY26 (Consolidated)
₹7,192.9 Cr
+29.14% YoY (FY25: ₹5,569.9 Cr)
Net Profit FY26 (Consolidated)
₹924.8 Cr
+71.53% YoY (FY25: ₹539.1 Cr)
Operating Margin (OPM)
25% (FY26) vs 23% (FY25)
Margin expanded, not compressed
EPS FY26 (Consolidated)
₹1.98
TTM EPS: ₹2.12
Operating leverage check: Revenue grew 29.1% while PAT grew 71.5% — profit growth outpaced revenue growth, the opposite of margin compression. This was driven by (a) operating margin expansion of roughly 200 basis points as fixed delivery-centre costs were spread over higher volumes, and (b) a sharply lower interest burden as borrowings were paid down from ₹2,532 crore (FY24) to ₹1,111 crore (FY26), cutting annual interest cost from ₹185 crore to ₹99 crore. A portion of the FY26 PAT growth also reflects a favourable base effect against FY25, which had absorbed higher finance costs and depreciation from Sagility's 2022 leveraged-buyout-linked balance sheet. Investors should treat the 71.5% PAT growth rate as partly structural (margin gains, deleveraging) and partly base-effect driven, rather than expecting it to repeat at the same magnitude every year.
Cash Flow Analysis
Reported profit is an opinion; cash is a fact. Sagility's FY26 cash generation comfortably backs its reported profit — this is a genuine positive finding, not a red flag.
Operating Cash Flow (OCF) FY26
₹1,203 Cr
OCF-to-PAT Conversion
130.1%
OCF exceeds reported PAT — a high-quality earnings signal
Free Cash Flow (FCF) FY26
₹1,011 Cr
FCF Coverage of Final Dividend Outflow
21.6x
Receivables vs. revenue growth: Debtor days improved sharply from 183 days to roughly 91 days over FY24-FY26 even as revenue grew strongly — receivables are not growing faster than sales, which supports the quality of the OCF number rather than masking a working-capital drag.
Funding source of the dividend: The final dividend of ₹46.8 crore is funded entirely out of current-year operating cash flow and cash reserves — not from asset sales or fresh borrowings. Cash from financing activities was a net outflow of ₹501 crore in FY26 (largely debt repayment), confirming the company is a net repayer, not a net borrower, even while paying dividends.
Balance Sheet Strength
Total Borrowings (Mar-2026)
₹1,111 Cr
Down from ₹2,896 Cr in FY23
Cash Position (End Q4 FY26)
₹903.8 Cr
Net Debt
₹207.2 Cr
Borrowings less cash position
Reserves & Surplus (Mar-2026)
₹4,980 Cr
Management has publicly guided to fully repaying current debt by the end of FY27. A near-zero net-debt balance sheet, combined with strong OCF generation, materially reduces the risk that future dividends would need to compete with debt-servicing obligations for cash.
Dividend Sustainability Analysis
Test 1: Earnings Coverage
19.8x (EPS ₹1.98 ÷ Final DPS ₹0.10)
Result: Pass — comfortable
Test 2: OCF Coverage
130.1% OCF-to-PAT
Result: Pass — cash-backed
Test 3: FCF Coverage
21.6x (FCF ₹1,011 Cr ÷ Final Outflow ₹46.8 Cr)
Result: Pass
Test 4: Cash/Liquidity Coverage
19.3x (Cash ₹903.8 Cr ÷ Final Outflow ₹46.8 Cr)
Result: Pass
Overall Verdict
Sustainable
All four tests clear comfortably, and the payout ratio for the final dividend is just 5.06% of PAT (7.59% for the full FY26 dividend). The main forward risk to sustainability is not affordability but policy: as a newly dividend-paying, deleveraging company, Sagility's board could reasonably choose to raise, hold flat, or pause the payout ratio in future years depending on capex, M&A (it recently agreed to acquire CareSeed), and debt-repayment priorities. Investors should read the current low payout as a capital-allocation choice, not a cash constraint.
Peer Comparison
| Company | Div. Yield | Payout Ratio | ROE | ROCE |
|---|---|---|---|---|
| Sagility Ltd | 0.23% (final) / 0.35% (FY26 total) | 7.59% (FY26) | 10.6% | 13.4% |
| Indegene Ltd (NIV) | ~0.35-0.40% | ~11-12% | ~16% | Not Disclosed by Company |
| Inventurus Knowledge Solutions (IKS Health) (NIV) | Not Disclosed by Company | Not Disclosed by Company | ~37% (FY24, brokerage estimate) | Not Disclosed by Company |
Within the India-listed healthcare BPM/RCM peer set (Sagility, Indegene, IKS Health), Sagility's dividend yield is broadly in line with Indegene's and modest relative to the sector's growth-first capital allocation norm. IKS Health, a faster-growing and structurally higher-margin peer, has not established a comparable dividend track record. ROE across the peer set is influenced by differing capital structures — Sagility's ROE is depressed relative to IKS Health partly because of residual leverage from its 2022 buyout-linked balance sheet, which is actively being unwound. Peer figures marked NIV (Not Independently Verified) are sourced from broker estimates and financial data aggregators rather than company filings and should be treated as indicative.
Promoter Impact Analysis
Promoter Holding (Mar-2026)
50.95%
Sagility B.V. (down from 82.39% in Mar-2025 after OFS/block-deal stake sales through the year)
Promoter Dividend Income (Final Dividend)
₹23.84 Cr
50.95% of ₹46.8 Cr total final outflow
Promoter Dividend Income (Total FY26)
₹35.76 Cr
Interim + Final combined
Institutional Holding (Mar-2026)
FII 10.02% + DII 22.28%
Because the dividend is paid uniformly per share, minority shareholders receive proportionate benefit alongside the promoter — there is no differential-class dividend structure here. The more material governance datapoint for minority holders is the sharp fall in promoter holding (82.4% to 50.9% within a year) via OFS and block deals, which has materially expanded the free float and institutional ownership base rather than concentrating dividend benefit.
Taxation Analysis
Under India's current tax regime, dividends are fully taxable in the hands of the shareholder at their applicable income-tax slab rate; the Dividend Distribution Tax regime was abolished with effect from FY2020-21. Sagility, like other listed companies, is required to deduct TDS at 10% under Section 194 of the Income-tax Act on dividend payments exceeding ₹5,000 in a financial year to a resident individual shareholder (higher rates apply for non-residents/NRIs, subject to applicable DTAA benefits, and for shareholders who have not furnished PAN).
Worked Example: Resident Individual in the 30% Tax Slab
| Shares held | 1,000 |
| Illustrative dividend rate used | ₹10 per share |
| Gross Dividend | ₹10,000 |
| Tax @ 30% slab | ₹3,000 |
| Net Dividend Received | ₹7,000 |
Note: this worked example uses an illustrative ₹10/share rate purely to show the tax mechanics clearly. On Sagility's actual final dividend of ₹0.10/share, the same investor holding 1,000 shares would receive a gross dividend of ₹100, taxed ₹30 at the 30% slab, for a net receipt of ₹70 — before TDS thresholds even apply, since ₹100 is well below the ₹5,000 TDS trigger.
Effective yield after tax varies by slab: a shareholder in the 30% bracket effectively receives 0.16% net yield (on the 0.23% gross final yield), while a shareholder in the 5% bracket retains closer to 0.22%. This information is general in nature; investors should consult a qualified tax advisor for their specific circumstances.
Key Risks
1. Client and geography concentration
Sagility serves exclusively US healthcare payer/provider clients; any US healthcare-policy shift, reimbursement change, or client-side budget tightening directly affects revenue.
2. Currency risk
Revenue is dollar-denominated while a large share of costs are rupee-denominated; INR/USD volatility affects reported margins.
3. Newly established dividend policy
With only two payouts in its history, there is no multi-year track record to confirm the board's long-run payout intent or consistency.
4. Ongoing promoter stake reduction
Promoter holding fell from 82.4% to 50.9% within a year through OFS and block deals; further large-block sell-downs could pressure the stock price independent of fundamentals.
5. Wage and labour-cost inflation
The company already absorbed a one-time ₹32.8 crore exceptional charge in Q3 FY26 linked to India's new labour codes; further regulatory changes could add cost pressure in a people-intensive BPM model.
6. Competitive and technology disruption
AI-led automation is reshaping healthcare BPM economics; Sagility must keep pace with technology-enabled competitors such as IKS Health and larger diversified IT-BPM players.
What To Monitor
1. Debt repayment progress
Track whether the company stays on schedule to fully repay current debt by end of FY27, as guided by management.
2. Payout ratio trajectory
Watch whether the board raises the payout ratio (currently ~7.6% of PAT) once debt is fully repaid, or continues to prioritize reinvestment/M&A.
3. Integration of CareSeed acquisition
Monitor execution on the recently announced CareSeed acquisition and its impact on the Medicare Advantage/Stars capability set.
4. EBITDA margin trend
FY27 guidance of 24-25% adjusted EBITDA margin versus FY26 actuals; margin flatness was the market's key post-results concern.
5. Client addition and concentration
17 new clients were added in FY26; track top-5/top-10 client revenue concentration trends going forward.
6. Further promoter stake sales
Any additional OFS or block-deal disclosures from Sagility B.V. that could affect stock supply/demand dynamics.
Conclusion
Sagility Limited's ₹0.10 final dividend for FY2025-26 — its second dividend as a listed company — is small in absolute yield terms (0.23% on CMP) but is comfortably covered on every sustainability test: earnings coverage of nearly 20x, OCF exceeding PAT, and cash reserves of over 19x the payout amount. The company is using the bulk of its rapidly growing profit (PAT +71.5% YoY) to deleverage rather than distribute, which is a reasonable capital-allocation choice for a recently-listed company working through a leveraged acquisition history. Readers evaluating this dividend should weigh the low current yield against the underlying business momentum, ongoing deleveraging, and the fact that dividend policy at Sagility is still in its formative years. This analysis presents facts, computations and risk factors for informational purposes; it is not a recommendation to buy, sell or hold the stock.
Frequently Asked Questions
What final dividend has Sagility Limited announced for FY26?
What is Sagility's dividend yield on this final dividend?
What was the record date for Sagility's FY26 final dividend?
What was the ex-dividend date?
When will the dividend be paid?
Who is eligible for this dividend?
How is Sagility's dividend taxed for investors?
Is Sagility's dividend sustainable?
What is Sagility's dividend history?
What should investors monitor going forward?
How much did the total FY26 dividend outflow amount to?
How much dividend income does the promoter receive?
How does Sagility's dividend yield compare with peers?
Disclaimer
This article is published by ShareBazaar Online for informational and educational purposes only. It is not investment advice, and does not constitute a recommendation to buy, sell, or hold any security. ShareBazaar Online is not a SEBI-registered investment adviser or research analyst. All figures are sourced from company filings, stock exchange disclosures, screener.in, and other publicly available data as cited; figures not independently verifiable from primary sources are marked "NIV" or "Not Disclosed by Company". Market prices, dividend yields, and financial ratios are subject to change and should be independently re-verified before making any investment decision. Past dividend payments are not indicative of future dividend policy. Please consult a SEBI-registered investment adviser and a qualified tax professional before making any investment or tax-related decision.