
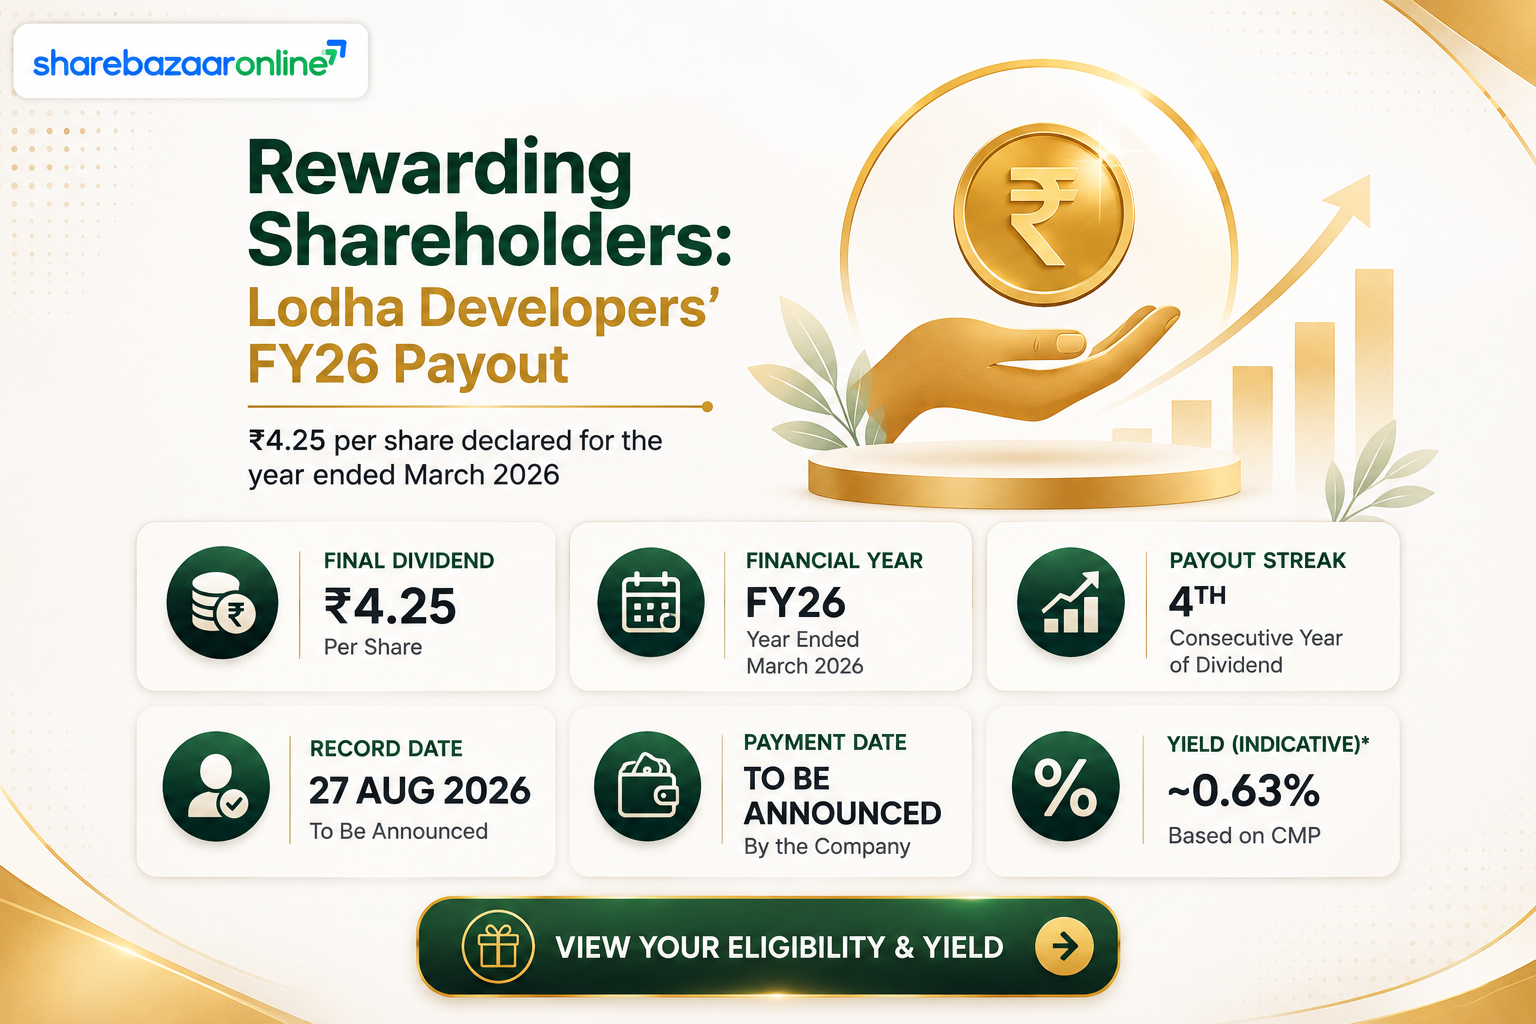
Dividend Snapshot
Company
Lodha Developers Limited (formerly Macrotech Developers Limited)
NSE: LODHA • BSE: 543287 • ISIN: INE670K01029
Dividend Declared
₹4.25 per equity share (42.5% of ₹10 face value) — Final Dividend, FY 2025-26
Approved by shareholders at the 31st AGM held on August 14, 2026
Face-Value Yield
42.50%
Calculated on ₹10 face value — not the real yield an investor earns
Real Yield on CMP (₹1,258, Aug 24, 2026 close)
0.34%
(₹4.25 ÷ ₹1,258) × 100 — re-verify against live price before acting
Record Date: August 7, 2026 (already elapsed) • Ex-Date: August 7, 2026 (T+1 settlement inference; company circular not separately sighted) • Payment: statutory outer limit is 30 days from AGM conclusion (August 14, 2026), i.e. on or before September 13, 2026 — exact company-confirmed date is Not Disclosed by Company.
Dividend Announcement Summary
The Board of Directors of Lodha Developers Limited, at its meeting held on April 24, 2026, recommended a final dividend of ₹4.25 per equity share (42.5% of the ₹10 face value) for the financial year ended March 31, 2026, alongside approval of the company's audited consolidated and standalone results for Q4 and full-year FY26. The recommendation was subject to shareholder approval, which was obtained at the company's 31st Annual General Meeting held on August 14, 2026, where all six resolutions on the agenda — including the dividend and the statutory auditor appointment — were passed.
Same Board Meeting Also Covered
- Audited consolidated & standalone FY26 results (unmodified auditor opinion, MSKA & Associates LLP)
- Re-appointment of Mr Lee Polisano as Independent Director for a second 5-year term
- Appointment of Mr Akhil Gupta as an Additional (Non-Executive, Independent) Director
- Designation of Mr Satish Shenoy as Chief Operating Officer – Construction Management, a Senior Management Personnel
Dividend Type & Approval Path
This is a Final Dividend, which under the Companies Act, 2013 requires shareholder approval at the AGM before it becomes payable — unlike an interim dividend, which the Board can approve unilaterally. That approval has already been obtained.
Key Dates Timeline
Board Recommendation
April 24, 2026
AGM (Shareholder Approval)
August 14, 2026
Record Date
August 7, 2026
Ex-Date (T+1 inference)
August 7, 2026
Payment Date
On or before September 13, 2026 (statutory 30-day outer limit from AGM conclusion) — specific date Not Disclosed by Company in the source filing reviewed
Note: the record date preceded the ex-date/record date convention under India's T+1 rolling settlement, meaning the record date and ex-date typically coincide for a T+1 market. This has already elapsed as of the article's last update; shareholders who held LODHA shares in their demat account as of August 7, 2026 are the ones entitled to this dividend.
Dividend Yield Analysis
The headline "42.5% dividend" is a face-value figure, not a market yield. It is calculated on the ₹10 paid-up face value of the share, not on what an investor actually pays to buy it on the exchange. At the closing market price of ₹1,258 (August 24, 2026), the real, investable dividend yield works out to just 0.34% — roughly 125 times smaller than the headline percentage suggests. This gap is the single most common source of confusion in retail dividend coverage and is worth internalising before comparing "dividend %" figures across companies with different face values.
Real Yield Calculation
(₹4.25 ÷ ₹1,258) × 100 = 0.34%
CMP as of August 24, 2026 close (Screener.in). Re-verify against the live NSE/BSE quote before making any decision, since price moves daily and this yield figure is time-stamped.
Yield on Announcement-Date CMP
Not Independently Verified — the exact NSE closing price on April 24, 2026 was not confirmed against an authoritative source at the time of writing. Readers can compute this themselves as (₹4.25 ÷ announcement-day CMP) × 100.
Why the Yield Looks Low for a Real Estate Major
Lodha's sub-0.5% yield is not unusual for its peer set. Listed Indian real estate developers generally retain the bulk of profits to fund land acquisition and construction rather than distribute cash, since growth capital needs in this capital-intensive sector are high. Sector dividend yields across major listed developers (DLF, Oberoi Realty, Godrej Properties, Prestige Estates) cluster in the 0%–0.8% range — investors buying real estate stocks for income alone are, sector-wide, likely to be disappointed; the appeal here is typically capital appreciation, not payout.
Dividend History Analysis
| Financial Year | Dividend Per Share | Payout Ratio | Type |
|---|---|---|---|
| FY2015–FY2022 | Nil | 0% | No dividend paid (pre- and early post-IPO years) |
| FY2023 | ₹1.00 | ~20% | Final (paid October 15, 2023) |
| FY2024 | ₹2.25 | ~14% | Final (paid September 22, 2024) |
| FY2025 | ₹4.25 | ~15% | Final (paid September 28, 2025) |
| FY2026 | ₹4.25 | 12.38% (consolidated) | Final (this dividend) |
Classification: Reinstated & Recently Flattened Payer
Lodha paid no dividend for its first several years as a listed/pre-listed entity, initiating payouts only from FY2023 — two years after its 2021 IPO. From there, the per-share dividend rose sharply for two consecutive years (from ₹1.00 to ₹2.25 to ₹4.25) before holding flat at ₹4.25 in FY2026. No special dividends, cuts, or suspensions feature in this short track record.
What the Flat FY26 Payout Signals
Holding the per-share dividend unchanged even as consolidated PAT rose 24% year-on-year means the payout ratio actually declined — from roughly 15% in FY25 to 12.38% in FY26. This is consistent with a growth-stage developer prioritising retained capital for land and construction over a rising payout, a pattern worth watching for a possible step-up (or continued flatness) in future years.
Financial Performance Analysis
Consolidated FY26 vs FY25 (₹ crore)
| Revenue from Operations | 16,676 (vs 13,780) |
| EBITDA (approx., PBT+Finance Cost+Dep.) | 5,373 (vs 4,377) |
| Net Profit (total, incl. NCI) | 3,431 (vs 2,767) |
| Net Profit (attributable to owners) | 3,428 (vs 2,764) |
Growth Rates, FY26 vs FY25
| Revenue Growth | 21.02% |
| EBITDA Growth (approx.) | 22.77% |
| PAT Growth | 24.00% |
| Operating Margin (co.-disclosed) | 33.89% (vs 36.03%) |
Operating Leverage: A Closer Look
At first glance, profit outgrowing revenue (24% vs 21%) looks like healthy operating leverage. But EBITDA growth (22.77%) barely outpaced revenue growth, and the company's own disclosed operating margin actually contracted by over 200 basis points, from 36.03% to 33.89%. The driver: "Other Expenses" in the consolidated P&L grew roughly 30% year-on-year (₹13,002 million vs ₹9,986 million) — materially faster than the 21% revenue growth — while cost of projects grew broadly in line with revenue. The PAT-level growth beating EBITDA growth is explained largely by a lower effective tax rate and other income, not by core margin expansion. Investors should read the 24% profit growth headline with this margin-compression context attached.
5-Year & 10-Year Track Record
Compounded profit growth: 58.4% CAGR (5-yr), 17% CAGR (10-yr, reflecting the FY2021 pandemic-year trough). Compounded sales growth: 25% CAGR (5-yr), 7% CAGR (10-yr).
Return Ratios (Consolidated, FY26)
ROE: 15.5% (TTM) • ROCE: 16.4% • Note the 3-year average ROE is lower, at approximately 13.6%, per screener data — FY26 marks an improvement over the trailing average.
Cash Flow Analysis
This is the most important finding in this article. Reported profit rose sharply in FY26, but operating cash flow (OCF) has been falling for three consecutive years: ₹2,512 crore (FY24) → ₹1,566 crore (FY25) → ₹959 crore (FY26), a roughly 39% decline in the latest year alone, even as consolidated PAT rose 24%. Profit is an accounting opinion; cash is a fact — and on the cash measure, FY26 was Lodha's weakest year in this three-year window.
What Explains the Gap
The audited consolidated cash flow statement shows a ₹1,134 crore increase in trade and other receivables and, more significantly, a ₹2,329 crore decrease in trade and other payables during FY26 — i.e., the company both collected more slowly from customers and paid down its own suppliers/contractors faster, a double drag on working capital. Inventories (project work-in-progress) also grew from ₹36,476 crore to ₹40,254 crore. None of this is a red flag in isolation for a developer scaling up construction activity, but it is the direct arithmetic reason profit and cash diverged so sharply this year.
Receivables vs Revenue Growth
Debtor days rose from 21 (FY25) to 32 (FY26), and debtors turnover fell from 5.46x to 3.94x on a standalone basis — receivables are growing faster than the pace at which the company is converting sales into operations-level cash, consistent with the OCF decline above.
Free Cash Flow & What Is Funding This Dividend
FY26 operating cash flow of ₹959 crore, less capex of ₹250 crore, leaves free cash flow of approximately ₹709 crore — still comfortably ahead of the ₹424.5 crore dividend outflow (FCF coverage of ~1.67x), but a materially thinner cushion than in FY24 or FY25, when OCF alone was 3–6 times the dividend outflow. On the numbers, this year's dividend is funded primarily through a combination of current-year free cash flow and the company's substantial cash and liquid-investment reserves (₹2,703 crore in cash and equivalents, and ₹883 crore in other bank balances) rather than through fresh borrowings or asset sales; consolidated borrowings actually rose during the year (net financing cash inflow of ₹1,589 crore), which is a separate capital-structure decision investors should track alongside the cash-generation trend above.
Balance Sheet Strength
Liquidity & Leverage (Consolidated, Company-Disclosed)
| Current Ratio | 1.75x |
| Debt-Equity Ratio | 0.43x |
| Net Debt-Equity Ratio | 0.24x |
| Debt Service Coverage Ratio | 2.04x |
| Interest Service Coverage Ratio | 4.39x |
Net Worth & Cash Position
| Net Worth (Consolidated) | ₹22,914 cr |
| Cash & Cash Equivalents | ₹2,703 cr |
| Other Bank Balances | ₹883 cr |
| Total Borrowings (Non-current + Current) | ₹9,884 cr |
The balance sheet remains comfortably capitalised, with a sub-0.5x net debt-equity ratio and interest cover above 4x — both healthy for a capital-intensive real estate developer. Total borrowings rose during FY26 (financing activities show ₹8,222 crore of gross fresh borrowings against ₹5,419 crore of repayments, consolidated), which coincided with the working-capital-driven OCF decline discussed above; this combination of rising debt and falling operating cash flow, while not alarming at current leverage levels, is worth monitoring in subsequent quarters.
Dividend Sustainability Analysis
1. Earnings Coverage
EPS ₹34.34 ÷ DPS ₹4.25 = 8.08x. Strong — profit comfortably exceeds the payout many times over.
2. Operating Cash Flow Coverage
OCF ₹959 cr ÷ Dividend Outflow ₹425 cr = 2.26x. Adequate in absolute terms, but this ratio has fallen sharply from prior years as OCF itself declined — the weakest link in this scorecard.
3. Free Cash Flow Coverage
FCF ₹709 cr ÷ Dividend Outflow ₹425 cr = 1.67x. Positive, but a materially thinner cushion than in FY24/FY25.
4. Cash & Liquidity Coverage
Cash + Bank Balances ₹3,586 cr ÷ Dividend Outflow ₹425 cr = 8.45x. Very strong — the balance sheet alone could fund several years of this dividend even with zero incremental cash generation.
Verdict: Moderately Sustainable
Earnings coverage and balance-sheet liquidity are both comfortable, and this is not a company at risk of being unable to pay ₹425 crore. However, the pass on the FCF and OCF tests is weaker than it was a year ago, and the decline is driven by a genuine deterioration in working-capital cash conversion rather than by the dividend itself growing — the per-share payout was held flat this year. A dividend can be sustainable on earnings and cash-position tests while showing a caution flag on the operating cash flow test; that is the pattern here, and it does not automatically indicate distress, but it does warrant watching whether the FY26 working-capital swing reverses in FY27.
Peer Comparison
| Company | Div. Yield | ROE | P/E | Debt-Equity |
|---|---|---|---|---|
| Lodha Developers | 0.34% | 15.5% | 30.7x | 0.43x |
| DLF | 0.75% | 12.3% | 38.0x | 0.22x |
| Oberoi Realty | ~0.2–0.5% | 15.1% | ~24.7x | 0.21x |
| Godrej Properties | ~Negligible | 9.4% | 55.0x | 0.65x |
| Prestige Estates | NIV | 15.3% | 130.7x | 1.02x |
Peer figures are sourced from recent, publicly available market data points (Screener.in, Samco, Univest) as of various dates in mid-to-late August 2026 and are Not Independently Verified against a single same-day snapshot; all metrics should be treated as approximate and re-checked before use in any comparison exercise. Desk re-run recommended.
On yield alone, Lodha sits roughly mid-pack among large listed developers — ahead of Godrej Properties' near-zero payout but behind DLF's more generous 0.75%. On leverage, Lodha's 0.43x debt-equity is higher than DLF's or Oberoi's but well below Prestige's 1.02x, and its ROE of 15.5% compares favourably with all peers except Prestige. None of the large listed developers in this set offer what would typically be called an "income" yield — the entire peer group trades on growth and asset-value narratives rather than dividend income.
Promoter Impact Analysis
Promoter Holding
72.27% as at the quarter ended March 2026 (the shareholding pattern nearest to the record date available at time of writing; the June 2026 quarter shows a further decline to 70.31%, so the exact record-date holding may differ slightly).
Promoter Dividend Income
72.27% × ₹424.5 crore total outflow ≈ ₹306.8 crore flows to the promoter group, versus approximately ₹117.7 crore to all other (institutional and public) shareholders combined.
With promoter holding above 70%, the majority of this dividend's cash value accrues to the promoter group by simple arithmetic of ownership share — this is a structural feature of any high-promoter-holding company's dividend, not evidence of preferential treatment, since the per-share rate is identical for every shareholder class. It is worth noting promoter holding has trended down over recent quarters (from 74.93% in September 2023 to 70.31% by June 2026), a gradual dilution pattern investors may want to track via subsequent shareholding filings.
Taxation Analysis
Under India's current dividend tax framework, dividends are taxed entirely in the hands of the shareholder at their applicable income-tax slab rate — the company does not pay Dividend Distribution Tax (DDT), which was abolished from FY2020-21 onward. The dividend is added to "Income from Other Sources" and taxed along with the rest of the investor's income.
TDS Rule (Section 194)
Companies deduct TDS at 10% on dividend income if the total dividend paid to a shareholder from that company exceeds ₹5,000 in a financial year (20% if PAN is not linked/available). Below this threshold, no TDS is deducted, though the income remains fully taxable and must be self-declared.
Worked Example
Investor holds 1,000 shares × ₹4.25 dividend = ₹4,250 gross dividend. At a 30% tax slab (plus 4% health & education cess, effective 31.2%): tax of approximately ₹1,326, leaving a net dividend of approximately ₹2,924. Since ₹4,250 is below the ₹5,000 TDS threshold for this single holding, no TDS would typically apply at source, though the full amount remains taxable on self-assessment. Effective post-tax yield on a ₹1,258 CMP: approximately 0.23%, down from the pre-tax 0.34%.
This is a simplified illustration for educational purposes only and does not constitute tax advice. Actual liability depends on the investor's total income, applicable surcharge, other dividend receipts from the same company across the year, and any DTAA provisions for non-resident investors. Please consult a qualified tax advisor for personalised guidance.
Key Risks
Working Capital & Cash Conversion
OCF fell ~39% in FY26 on rising receivables and faster payable settlement; a continuation of this pattern would compress future free cash flow available for dividends, capex and debt service alike.
Real Estate Cyclicality
Residential pre-sales and collections are sensitive to interest rate cycles, home-loan affordability and macroeconomic sentiment; a demand slowdown directly affects both revenue recognition and cash collections.
Rising Leverage
Gross borrowings increased during FY26 even as operating cash generation weakened; sustained reliance on debt funding alongside softer OCF would be a combination worth monitoring closely.
Regulatory & Execution Risk
RERA compliance, approval timelines, and construction execution across a large multi-city project pipeline (MMR, Pune, Bengaluru and international markets) carry inherent delivery and cost-overrun risk.
Margin Compression
Operating margin contracted from 36.03% to 33.89% in FY26 on faster-growing "other expenses"; unchecked, continued cost growth ahead of revenue could pressure future profitability and dividend headroom.
Valuation Sensitivity
At a P/E of ~30.7x and 5.4x book value, the stock is priced for continued strong growth; any earnings disappointment carries meaningful re-rating risk given current multiples.
What To Monitor
Operating Cash Flow Trend (Q1-Q2 FY27)
Whether the FY26 working-capital drag reverses, or whether receivables and payables continue moving in a cash-negative direction.
Pre-Sales & Collections Momentum
Quarterly booking values and collection efficiency across MMR, Pune and Bengaluru, the primary drivers of future revenue recognition.
Leverage Trajectory
Net debt-equity ratio movement in subsequent quarters, given the FY26 increase in gross borrowings.
Dividend Per Share Trajectory
Whether FY27 sees a resumption of the earlier growth pattern (₹1.00 → ₹2.25 → ₹4.25) or continued flatness at ₹4.25.
Margin Recovery
Whether operating margin stabilises or continues contracting as "other expenses" growth is monitored against revenue growth in coming quarters.
Payment Date Confirmation
The company-confirmed payment date, once officially disclosed, against the statutory outer limit of September 13, 2026 used in this article.
Conclusion
Lodha Developers' FY26 final dividend of ₹4.25 per share continues a three-year-old, still-young payout track record, backed by strong earnings coverage (8.08x) and a well-capitalised balance sheet (net debt-equity of just 0.24x, liquidity coverage of 8.45x). The headline 42.5% figure is a face-value number; the real, investable yield at current market prices is 0.34%, in line with the broader listed-developer peer set, none of whom offer a meaningfully "income"-oriented yield. The one genuine caution flag in this year's numbers is the sharp, three-year decline in operating cash flow driven by deteriorating working-capital dynamics — a trend that has not yet threatened the dividend's sustainability, given the strength of the balance sheet, but is worth tracking closely through FY27. This analysis presents facts, computed ratios and risk factors for the reader's own evaluation; it is not a recommendation to buy, sell or hold the stock.
Frequently Asked Questions
What dividend has Lodha Developers announced for FY26?
What is the Lodha Developers dividend yield?
What was the record date for the Lodha Developers FY26 dividend?
What was the ex-date for this dividend?
When will the Lodha Developers dividend be paid?
Who was eligible for the Lodha Developers final dividend?
How is the Lodha Developers dividend taxed?
Is the Lodha Developers dividend sustainable?
What is Lodha Developers' dividend history?
What should investors monitor going forward?
What is the total dividend outflow for Lodha Developers this year?
How much dividend income does Lodha's promoter group receive?
How does Lodha Developers' dividend yield compare to peers like DLF and Oberoi Realty?
Disclaimer
This article is published by ShareBazaar Online for general informational and educational purposes only. It is not investment advice, and ShareBazaar Online is not a SEBI-registered investment advisor or research analyst. Nothing in this article constitutes a recommendation to buy, sell or hold any security. All figures, ratios and dates are based on the company's regulatory filing dated April 24, 2026, subsequent publicly available corporate-action disclosures, and independently sourced market data as available at the time of writing; some figures are approximate, Not Independently Verified (NIV), or subject to change, and are flagged accordingly throughout this article. Live market prices, dividend dates and yield figures should always be re-verified against the NSE/BSE and the company's official disclosures before making any financial decision. Please consult a SEBI-registered investment advisor and/or a qualified tax professional before acting on any information in this article. Past dividend history and financial performance are not indicative of future results.