
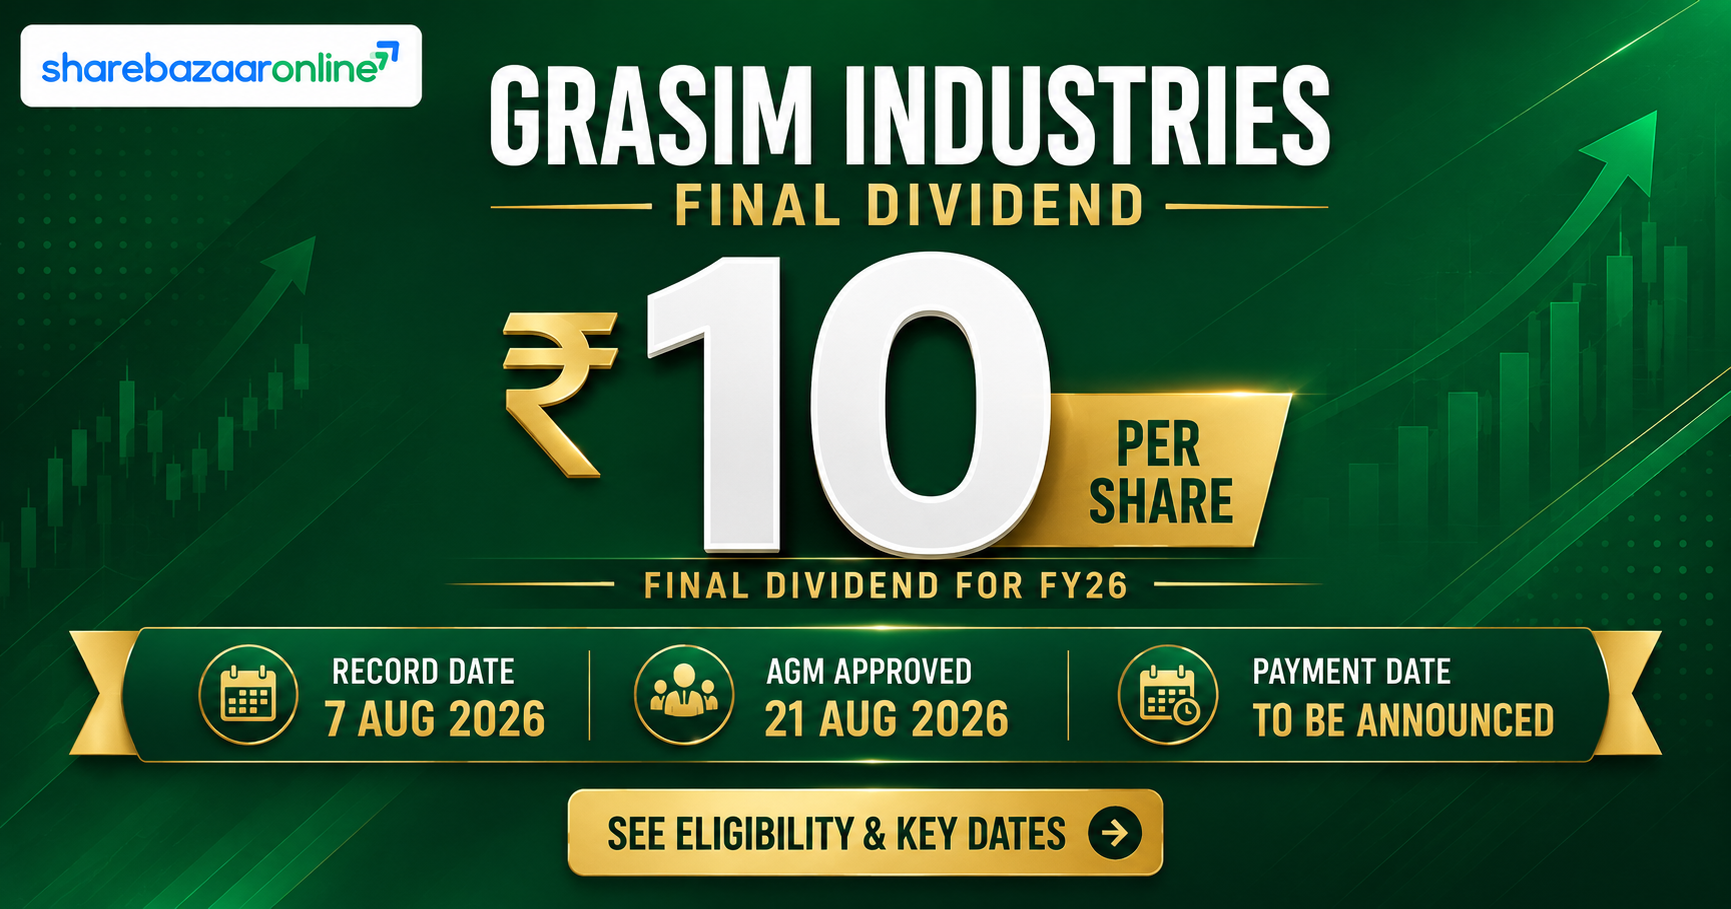
Dividend Snapshot
Company
Grasim Industries Limited
NSE: GRASIM • BSE: 500300 • ISIN: INE047A01021
Dividend Declared
₹10 per share (Final, 500% of Face Value ₹2)
For FY 2025-26 (year ended 31 March 2026)
Real Market-Price Yield
~0.30%
On CMP of ₹3,288 (24-Aug-2026 close) — not the headline "500%"
Record Date / Ex-Date
7 August 2026 (both dates coincided)
Book closure: 8 Aug 2026 to 21 Aug 2026
AGM Approval
Approved at 79th AGM held 21 August 2026
Shareholder approval obtained via video conferencing
Payment Date
Not Disclosed by Company
Statutory outer limit: on or before 20 September 2026 (30 days from AGM)
Dividend Announcement Summary
The Board of Directors of Grasim Industries Limited, at its meeting held on 20 May 2026, recommended a final dividend of ₹10 per equity share (face value ₹2 each), equivalent to 500%, for the financial year ended 31 March 2026. The recommendation was made alongside approval of the audited standalone and consolidated financial results for FY26 and the appointment of Deloitte Haskins & Sells Chartered Accountants LLP as an additional Joint Statutory Auditor.
Dividend Type
Final Dividend (single payout for the year — no interim dividend was declared during FY26)
Total Dividend Outflow
≈ ₹680.55 crore (₹10 × ~68.06 crore shares)
The dividend was placed before shareholders at the 79th AGM held on 21 August 2026 and was approved. Eligibility was determined for shareholders holding shares as on the record date of 7 August 2026.
Key Dates Timeline
Board Meeting / Announcement Date
20 May 2026
Record Date
7 August 2026 (past)
Ex-Dividend Date
7 August 2026 — coincided with record date (T+1 settlement; no separate lag observed)
Book Closure
8 August 2026 to 21 August 2026
79th AGM Date
21 August 2026, 11:30 a.m. (via VC) — dividend approved
Payment Date
Not Disclosed by Company (statutory outer limit: 20 September 2026)
Note on dates: Record date and ex-date have already elapsed as of the date of this analysis (25 August 2026). The exact bank-credit payment date has not been separately disclosed by the company in its regulatory filings reviewed for this report; investors can track the actual credit date via their depository participant or the company's investor-relations page.
Dividend Yield Analysis — The Face-Value Illusion
Grasim's board resolution describes the dividend as "500%." This figure is calculated on the ₹2 face value of the share, not on what an investor actually paid to buy it. On the face value, ₹10 ÷ ₹2 × 100 = 500%. But almost no shareholder bought their Grasim shares at ₹2 — the stock trades in the ₹3,000–3,400 range. The number that matters to an investor is the real market-price yield.
Headline Face-Value Yield
500.00%
₹10 ÷ ₹2 face value × 100 — the number in the press release
Real Market-Price Yield
0.30%
₹10 ÷ ₹3,288 CMP (24-Aug-2026) × 100
The headline percentage is roughly 1,600 times larger than the yield an investor buying at current market price actually earns. Using the approximate closing price around the 20 May 2026 announcement (≈₹3,061, NIV — T+1 reaction price, exact announcement-day close not independently confirmed), the announcement-day yield works out to approximately 0.33%. Either way, Grasim's real dividend yield sits well below the broader market average and is characteristic of a capital-intensive, reinvestment-focused conglomerate rather than an income stock.
Dividend History Analysis
| Financial Year | Dividend/Share (₹, FV ₹2) | Type |
|---|---|---|
| FY2017 | 5.50 | Final |
| FY2018 | 6.20 | Final |
| FY2019 | 7.00 | Final |
| FY2020 | 4.00 (cut) | Final |
| FY2021 | 9.00 (5.00 Final + 4.00 Special) | Final + Special |
| FY2022 | 10.00 (5.00 Final + 5.00 Special) | Final + Special |
| FY2023 | 10.00 | Final |
| FY2024 | 10.00 | Final |
| FY2025 | 10.00 | Final |
| FY2026 | 10.00 | Final |
Payer Classification
Consistent Payer (with one historical cut)
Dividend has been paid every year for over a decade, but was cut from ₹7 to ₹4 in FY2020 (COVID-19 year) before recovering.
Recent Trend
Flat at ₹10/share for the fifth consecutive year (FY22–FY26)
No dividend growth despite consolidated PAT rising from ₹7,756 crore (FY25) to ₹10,300 crore (FY26)
Financial Performance Analysis
Standalone (Parent entity — the entity that actually pays the dividend)
- Revenue FY26: ₹41,039.48 cr (vs ₹31,563.23 cr FY25, +30.0%)
- PAT FY26: ₹348.39 cr (vs ₹212.10 cr FY25, +64.3%)
- EPS (Basic) FY26: ₹5.14 (vs ₹3.18 FY25)
Consolidated (Group — includes UltraTech Cement, Aditya Birla Capital)
- Revenue FY26: ₹1,75,430.74 cr (vs ₹1,48,477.89 cr FY25, +18.2%)
- PAT (owners) FY26: ₹4,966.48 cr (vs ₹3,705.68 cr FY25, +34.0%)
- EPS (Basic) FY26: ₹73.21 (vs ₹55.57 FY25)
Operating leverage check: Consolidated revenue grew 18.2% while consolidated segment results grew from ₹19,811.83 cr to ₹25,693.20 cr (+29.7%) — profit growth outpaced revenue growth, indicating positive operating leverage, largely driven by the Building Materials (cement/paints/B2B e-commerce) segment where segment results rose from ₹12,011.73 cr to ₹16,363.97 cr (+36.2%). Standalone results were dented by three exceptional items totalling ₹129.53 cr — a ₹47.86 cr impairment at the Chemical Vilayat facility, a ₹34.17 cr one-time Labour Codes gratuity charge, and a ₹34 cr provision against Joint Venture exposures (AV Terrace Bay and Birla Advanced Knits) — without which standalone PAT would have been meaningfully higher.
Cash Flow Analysis
Reported profits are opinions; cash is fact — and at Grasim, standalone and consolidated cash tell opposite stories. This is the single most important non-obvious finding in this report.
Standalone Operating Cash Flow
+₹2,680.55 cr (FY26)
Sharply reversed from -₹25.43 cr in FY25 — a genuine turnaround in the parent's own cash generation, helped by favourable working-capital swings.
Consolidated Operating Cash Flow
-₹17,809.61 cr (FY26)
Deeply negative, and has been negative for five straight years. This is not a red flag in isolation — it is structurally driven by the ₹43,434.64 cr net growth in the lending book of the NBFC/HFC subsidiaries under Aditya Birla Capital, where loan disbursals are booked as operating outflows.
Why this matters for the dividend: Grasim pays its own shareholders out of the standalone entity's resources, not directly out of consolidated group cash (most of which sits inside UltraTech Cement and Aditya Birla Capital and cannot be freely upstreamed). Standalone free cash flow (OCF of ₹2,680.55 cr less capex of ₹2,087.21 cr) was ₹593.34 cr — just under the ₹680.55 cr dividend outflow, a coverage of 0.87x. The dividend was funded chiefly by ₹1,326.07 cr of dividend income Grasim itself received from its subsidiaries and associates (mainly UltraTech and ABCL) during the year — 1.95x the dividend it is paying out. Receivables at the standalone level grew ₹662.71 cr against a 30% revenue increase, a broadly proportionate and unremarkable movement.
Balance Sheet Strength
Standalone Net Worth
₹55,277.18 cr
Standalone Debt-Equity
0.21x
Total debt ₹11,715.48 cr — conservatively geared at the parent level
Consolidated Debt-Equity
1.32x (including Non-Controlling Interest in equity base)
Elevated mainly because the group's NBFC/HFC lending book (borrowings of ₹2,24,947.82 cr combined) is consolidated in, which is normal for a group with a large financial-services arm.
Standalone Current Ratio
1.52x
Adequate short-term liquidity cushion
Standalone cash and cash equivalents stood at just ₹12.86 cr at year-end, but current investments of ₹4,256.87 cr provide a substantial liquid cushion (6.45x the dividend outflow when combined with bank balances). Investment in subsidiaries, joint ventures and associates was ₹23,485.31 cr on the standalone balance sheet — the value of the group businesses is held here, not consolidated cash.
Dividend Sustainability Analysis
Test 1: Earnings Coverage (Standalone)
0.51x — NOT covered
Standalone payout ratio is 195.3% of standalone PAT (₹348.39 cr)
Test 1: Earnings Coverage (Consolidated)
7.32x — comfortably covered
Consolidated payout ratio is a low 13.7% of PAT attributable to owners (₹4,966.48 cr)
Test 2: OCF Coverage (Standalone)
3.94x — covered
Standalone OCF of ₹2,680.55 cr comfortably exceeds the ₹680.55 cr outflow
Test 3: FCF Coverage (Standalone)
0.87x — marginally short
Standalone FCF of ₹593.34 cr is just under the dividend outflow once capex is deducted
Test 4: Cash/Liquidity Coverage
6.45x — well covered
Standalone cash, bank balances and current investments total ₹4,388.70 cr
Overall Classification
Moderately Sustainable
Standalone earnings alone do not cover the payout, but dividend income upstreamed from subsidiaries and healthy liquid reserves do
Grasim's dividend-paying capacity should be read through a holding-company lens: the parent's own operating profit does not by itself cover the payout, but this is a structural feature of Grasim's business model (most operating profit sits inside UltraTech and ABCL, which upstream dividends to the parent) rather than a sign of distress. The dividend has been paid without interruption since the FY2020 cut and is backed by ample standalone liquidity. The key vulnerability is a slowdown in dividend upstreaming from subsidiaries in a future year, which would directly compress the parent's ability to maintain the payout without drawing down reserves.
Peer Comparison
| Company | Dividend Yield | Payout Ratio | ROE | ROCE |
|---|---|---|---|---|
| Grasim Industries (this report) | 0.30% | 13.7% (consol.) | 4.98% | 8.01% |
| UltraTech Cement (subsidiary) | ~0.65% | ~32-38% | NIV | NIV |
| Aditya Birla Capital (subsidiary) | 0.00% | Nil (no dividend paid) | ~11.4% | ~8.2% |
Grasim does not have a clean single-sector peer group because it is a diversified holding company spanning viscose fibre, chemicals, cement (via UltraTech), paints, and financial services (via Aditya Birla Capital). The comparison above therefore benchmarks Grasim against its own two largest listed subsidiaries. UltraTech, the cement arm, offers a meaningfully higher yield and payout ratio than the parent; Aditya Birla Capital currently pays no dividend at all, reinvesting entirely into growing its lending and insurance books. Grasim's own low consolidated ROE of 4.98% (versus its 3-year average of ~5.2%, per Screener.in data) reflects heavy capital deployment into these subsidiaries and ongoing growth capex, rather than distress.
Promoter Impact Analysis
Promoter Holding (Jun 2026)
43.73%
Promoter Dividend Income
≈ ₹297.60 crore
Non-Promoter (Public + FII + DII) Income
≈ ₹382.95 crore
Institutional Holding
FII 14.63% + DII 16.13% = 30.76%
Of the total ₹680.55 crore dividend outflow, the Aditya Birla Group promoter entities receive roughly ₹297.60 crore, broadly proportionate to their 43.73% holding — there is no disproportionate benefit to promoters embedded in the payout structure. Public and institutional shareholders collectively receive the majority (≈56%) of the total outflow.
Taxation Analysis
Under the current Indian tax regime, dividends are taxed in the hands of the shareholder at their applicable income-tax slab rate (the erstwhile Dividend Distribution Tax paid by companies was abolished with effect from FY2020-21). Grasim deducts TDS at source under Section 194 of the Income-tax Act — 10% if the shareholder's PAN is available and total dividend income from the company exceeds ₹10,000 in the financial year, or 20% if PAN is not registered/available.
Worked Example — Investor holding 1,000 shares, dividend ₹10/share, 30% tax slab
Gross Dividend
₹10,000.00
Tax @ 30% Slab
₹3,000.00
Net Dividend Received
₹7,000.00
Effective Post-Tax Yield
0.21% (on ₹32,88,000 investment at CMP)
Note: TDS deducted at source is not the final tax liability — it is adjustable against the shareholder's total tax due when filing their return. Shareholders in lower tax brackets, or those eligible to file Form 15G/15H, may claim a refund of excess TDS deducted.
Key Risks
1. Standalone earnings do not cover the dividend
Payout ratio of 195.3% on standalone PAT means the parent is relying on dividend income from subsidiaries and reserves, not its own operating profit, to fund shareholder payouts.
2. Concentration risk in dividend upstreaming
₹1,281.35 cr of the ₹1,326.07 cr dividend income Grasim received in FY26 came from subsidiaries/JVs/associates — any slowdown in UltraTech's or ABCL's own dividend policy would directly pressure Grasim's payout capacity.
3. Standalone exceptional items and impairments
FY26 standalone results absorbed ₹129.53 cr of exceptional charges including a Chemical Vilayat plant impairment and provisions against loss-making joint ventures (AV Terrace Bay, Birla Advanced Knits).
4. Consolidated operating cash flow has been negative for five consecutive years
Driven by the rapidly expanding NBFC/HFC loan book; while structurally explainable, it means the group as a whole is a net cash consumer, funded by continuous external borrowing.
5. Rising consolidated leverage
Consolidated non-current borrowings rose from ₹1,23,927.09 cr (FY25) to ₹1,56,828.62 cr (FY26), largely to fund the financial-services lending book and capex across segments.
6. Cyclical, capital-intensive end-markets
Cement, chemicals and VSF are exposed to raw-material inflation (power and fuel cost, caustic soda pricing) and construction-cycle demand swings that can compress margins.
What To Monitor
1. Standalone operating cash flow trend
Whether the FY26 turnaround to positive OCF (from -₹25.43 cr to +₹2,680.55 cr) is sustained in FY27, reducing reliance on upstreamed dividends.
2. Dividend policy at UltraTech Cement and Aditya Birla Capital
Since these subsidiaries fund the bulk of Grasim's own payout capacity, any change in their distribution policy is a direct read-through.
3. Progress on the GIP/BlackRock investment into Aditya Birla Renewables
The ₹3,000 cr minority-stake transaction and related SPV restructuring could alter Grasim's effective economic interest and future dividend inflows from the renewables business.
4. Consolidated debt trajectory
Whether consolidated borrowings continue rising faster than equity, given the debt-equity ratio has moved from 1.16x (FY25) to 1.32x (FY26).
5. Paints and B2B e-commerce scale-up
Management guidance of over 50% revenue growth in paints and EBITDA breakeven for the B2B e-commerce business by FY2027 — execution here directly affects consolidated profit growth.
6. Resolution of Chemical Vilayat facility issues
Recurring equipment failures led to a ₹47.86 cr impairment in FY26; the pace and cost of remediation is worth tracking in subsequent quarters.
Conclusion
Grasim Industries' FY26 final dividend of ₹10 per share (500% of face value) delivers a real market-price yield of roughly 0.30% — a modest income return typical of a reinvestment-heavy conglomerate rather than a high-yield stock. At the consolidated level the payout is very comfortably covered (13.7% of PAT, 7.32x earnings coverage), but at the standalone level — the entity that actually disburses the cash to shareholders — the payout ratio exceeds 195% of parent-only profit, and the dividend is chiefly funded by ₹1,326.07 cr of dividend income upstreamed from subsidiaries such as UltraTech Cement and Aditya Birla Capital, supplemented by ample standalone liquid reserves. Record date (7 August 2026) and the 79th AGM approval (21 August 2026) have both already passed; the company has not separately disclosed the exact bank-credit payment date as of this report. Positives, negatives and risks are presented above for readers to evaluate independently — this article does not constitute a recommendation to buy, sell or hold the stock.
Frequently Asked Questions
What dividend has Grasim Industries announced for FY26?
What is Grasim Industries' actual dividend yield?
What was the record date for the Grasim FY26 dividend?
What was the ex-date for this dividend?
When will the Grasim dividend be paid?
Who was eligible for the Grasim FY26 dividend?
How is Grasim's dividend taxed for shareholders?
Is Grasim's dividend sustainable?
What is Grasim's dividend history?
What should investors monitor going forward?
Why is Grasim's standalone payout ratio over 100%?
How does Grasim's dividend compare with its subsidiaries UltraTech Cement and Aditya Birla Capital?
Disclaimer
This article is for informational and educational purposes only and does not constitute investment advice, a recommendation, or a solicitation to buy, sell, or hold any security. ShareBazaarOnline is not a SEBI-registered investment adviser or research analyst. All figures are sourced from the company's regulatory filings (BSE/NSE corporate announcements dated 20 May 2026) and independently cross-verified against publicly available secondary sources including Screener.in, NSE/BSE data providers, and financial news aggregators as of 25 August 2026; figures not independently verifiable are marked NIV or "Not Disclosed by Company." Market prices, ratios, and yields are subject to change and should be re-verified before making any investment decision. Readers are advised to consult a SEBI-registered financial advisor and review official company filings before making investment decisions. Past dividend history is not indicative of future payouts.