
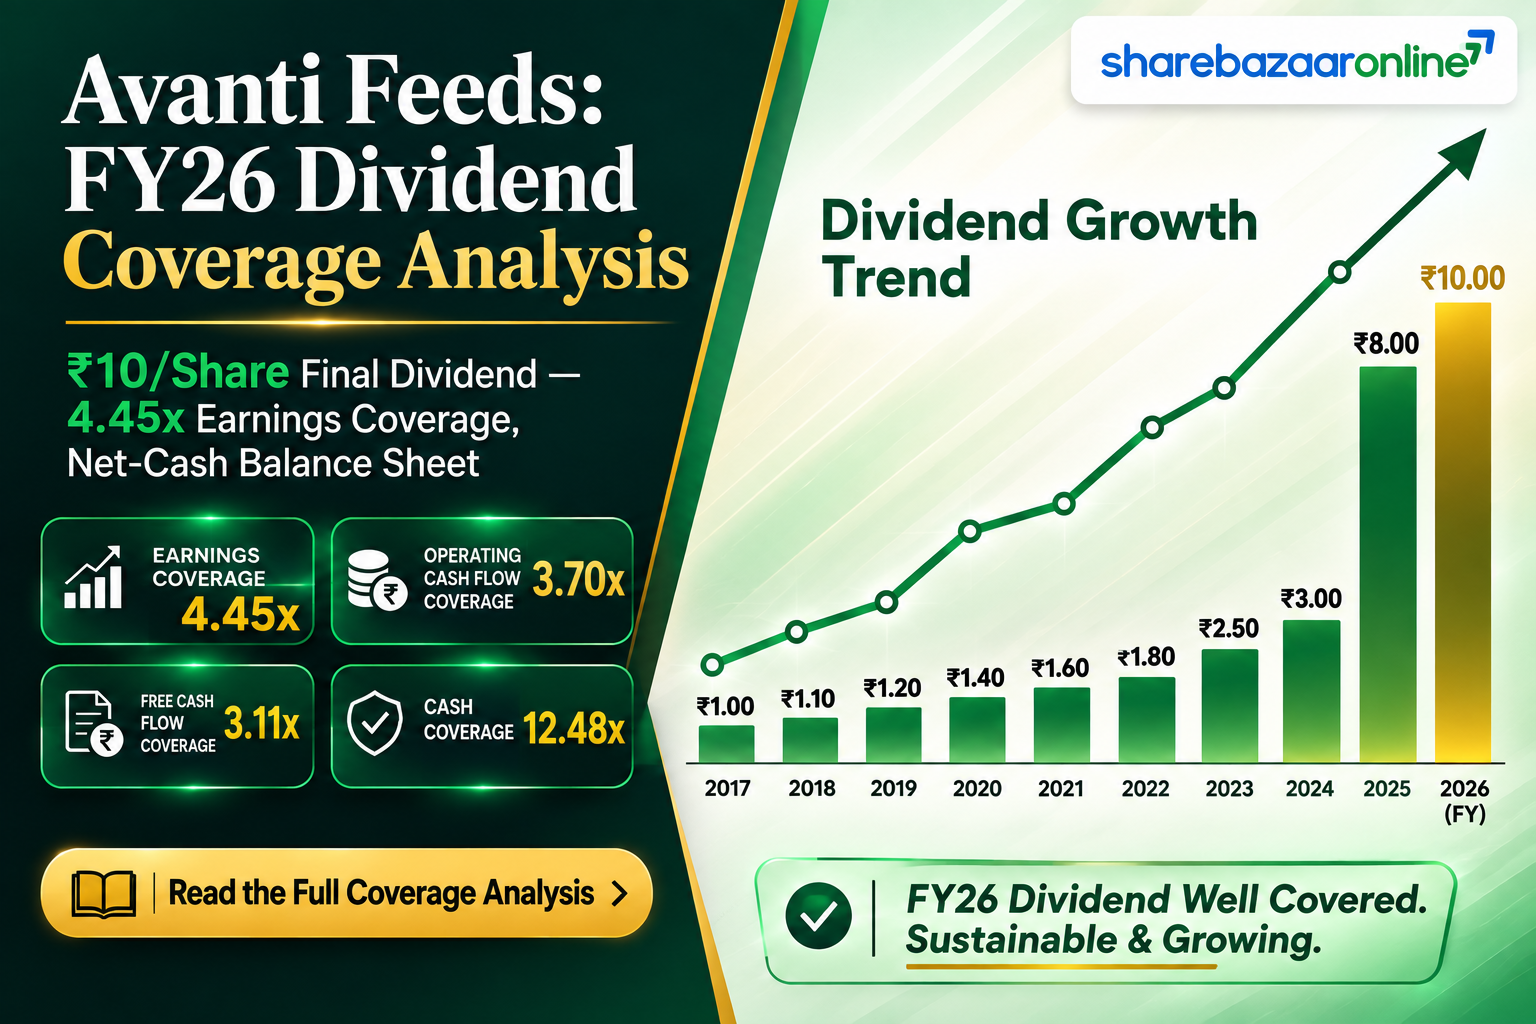
Dividend Snapshot
Company
Avanti Feeds Limited (NSE: AVANTIFEED | BSE: 512573)
ISIN: INE871C01038
Dividend Declared
₹10.00 per share (Final Dividend, FV ₹1)
Dividend % on face value: 1,000%
Real Market-Price Yield
1.17% (on CMP ₹858, 24-Aug-2026)
Not the 1,000% headline figure — see Yield Reality Check below
Status
Approved by shareholders at 33rd AGM (14-Aug-2026)
Record/Ex-Date 07-Aug-2026 has passed; Payment Date 13-Sep-2026
Dividend Announcement Summary
The Board of Directors of Avanti Feeds Limited, at its meeting held on 28th May 2026, approved the audited standalone and consolidated financial results for the quarter and year ended 31st March 2026, and recommended a Final Dividend of ₹10 per equity share of face value ₹1 each for FY 2025-26, subject to shareholder approval. This compares with a final dividend of ₹9 per share paid for FY 2024-25, a step-up of approximately 11.1%.
Auditor's Opinion
Tukaram & Co LLP issued an Unmodified Opinion on both standalone and consolidated audited results for FY26.
Shareholder Approval
The 33rd AGM held on 14th August 2026 via video conferencing passed the dividend resolution along with director re-appointments.
Other Board Decisions Announced Alongside the Dividend
- Re-appointment of Dr. A. Indra Kumar as Chairman & Managing Director for 5 years (1-Jul-2026 to 30-Jun-2031)
- Re-appointment of Sri C. Ramachandra Rao as Joint Managing Director & Company Secretary for 5 years (1-Apr-2027 to 31-Mar-2032)
- CFO succession: Mr. C. Ramachandra Rao relinquished CFO responsibilities effective 1-Jun-2026; Mrs. B. Santhi Latha (General Manager, Finance & Accounts, 15+ years with the company) elevated as CFO
- Commission to Non-Executive Directors capped at 1% of profits or ₹1.00 crore for FY27-FY31
Key Dates Timeline
Board Meeting / Announcement Date
28 May 2026
AGM Date (Approval)
14 August 2026 — Approved
Record Date
7 August 2026 — Elapsed
Ex-Dividend Date
7 August 2026 — Elapsed
Ex-date coincides with record date under current T+1 settlement convention; confirmed via exchange-linked data sources, not the original BSE outcome letter, which did not disclose this date.
Payment Date
13 September 2026
Consistent with the company's historical ~37-day gap between ex-date and payment; not separately confirmed in the BSE filing reviewed for this article. Falls within the statutory 30-day window from AGM approval under Section 123 of the Companies Act, 2013.
Financial Year
FY 2025-26 (year ended 31-Mar-2026)
Dividend Yield Analysis
Face-Value "Dividend %"
1,000%
₹10 dividend ÷ ₹1 face value × 100. This is the figure companies quote in filings — it says nothing about return on your investment.
Real Market-Price Yield (CMP)
1.17%
₹10 ÷ CMP ₹858 (24-Aug-2026 close) × 100 — the figure that actually matters to an investor holding the stock at current prices.
Announcement-Date Yield (approximate, Not Independently Verified)
Shares moved roughly 5% on the results day (28-May-2026), implying a pre-announcement close near ₹862.70 and a post-results price near ₹905.85. On the pre-announcement base, the implied yield works out to approximately ~1.16%. Treat this as approximate (~) since the exact BSE/NSE closing print for 28-May-2026 could not be independently confirmed for this article.
10-Year Yield Trend (on face value, historically)
Avanti Feeds' declared dividend has risen from ₹3.00 (2017) to ₹10.00 (2026), but because face value was also reduced via bonus/split corporate actions in 2018, per-share comparisons before and after that point are not on a like-for-like basis. On a market-price basis, historical dividend yields at declaration have typically ranged between roughly 0.7% and 1.4%, depending on the CMP prevailing at each announcement — broadly in line with the current 1.17%.
Dividend History Analysis
| Fiscal Year | Dividend/Share (₹) | Type | Payout Ratio |
|---|---|---|---|
| FY 2025-26 | 10.00 | Final | ~22% |
| FY 2024-25 | 9.00 | Final | ~23% |
| FY 2023-24 | 6.75 | Final | ~26% |
| FY 2022-23 | 6.25 | Final | ~31% |
| FY 2021-22 | 6.25 | Final | ~38% |
| FY 2020-21 | 6.25 | Final | ~24% |
| FY 2019-20 | 5.10 (5.00 + 0.10 interim) | Interim (split) | ~20% |
| FY 2018-19 | 4.00 | Final | ~20% |
| FY 2017-18 | 6.00* | Final | ~12% |
| FY 2016-17 | 3.00* | Final | NIV |
*FY2016-17 and FY2017-18 figures pre-date the June 2018 1:2 bonus issue and face-value sub-division (₹2 → ₹1), so are not directly comparable per-share to later years. Payout ratios sourced from Screener.in consolidated data; figures for years before FY2018 are Not Independently Verified (NIV).
Payer Classification
Consistent Payer with a step-up growth pattern. Dividend per share has risen in seven of the last eight years, with no outright suspension since listing. The one visible "cut" (FY2018-19 to ₹4 from an equivalent ₹6 in FY2017-18) coincides with the bonus/split corporate action and is a share-count effect rather than a genuine reduction in shareholder payout.
Payout Ratio Trend
Payout ratio peaked near 38% in FY2021-22 and has since declined to ~22% even as the absolute dividend has risen — because profit has grown faster than the dividend. This is a sign of increasing conservatism in capital return relative to earnings, not dividend weakness.
Financial Performance Analysis
Consolidated Revenue (FY26 vs FY25)
₹6,066 Cr vs ₹5,599 Cr
+8.34% YoY
Consolidated Operating Profit (FY26 vs FY25)
₹750 Cr vs ₹634 Cr
+18.3% YoY, OPM expanded 11% → 12%
Consolidated Net Profit (incl. NCI & discontinued ops)
₹656.80 Cr vs ₹557.05 Cr
+17.9% YoY
PAT Attributable to Owners
₹606.06 Cr vs ₹528.82 Cr
+14.6% YoY
Operating Leverage — Positive, Driven by Processed Shrimp
Revenue growth of 8.3% translated into operating profit growth of 18.3% and PAT growth (owners) of 14.6% — classic positive operating leverage. Segment data shows this was not evenly spread: Shrimp Feed segment result rose a modest ~5.9% (₹527.0 Cr to ₹558.5 Cr), while the Processed Shrimp segment result surged ~163.8% (₹48.6 Cr to ₹128.2 Cr) — the real driver of full-year earnings growth, likely aided by better export realisations and margins in shrimp processing.
Base-Effect Caution: Full-Year Strength Masks a Weaker Q4
Despite full-year profit growth, standalone Q4 FY26 net profit fell to ₹106.28 Cr from ₹144.18 Cr in Q4 FY25 — a decline of roughly 26% YoY at the quarter level, driven partly by an exceptional impairment charge (below) and cost pressures. Readers should not extrapolate the strong full-year growth rate into near-term quarters without checking the Q1 FY27 results (board meeting scheduled 13-Aug-2026 per company disclosures) for confirmation of whether the deceleration persisted.
One-Time and Structural Items Affecting FY26 Profit
- Exceptional impairment of ₹12.97 Cr (consolidated) on the company's investment in Patikari Power Private Limited, a 25.89%-held associate operating a 16 MW hydel plant on the Beas River, Himachal Pradesh, which sustained severe cloudburst damage in July 2025. This is a non-cash, non-recurring hit to reported PBT.
- New Labour Codes provisioning: the company recognised an incremental ₹10.90 Cr (consolidated) / ₹8.51 Cr (standalone) employee benefit expense for gratuity and leave encashment following the Central Government's consolidation of labour legislation effective November 2025 — a structural, likely-recurring cost step-up rather than a one-off.
- Discontinued windmill operations: the company divested its windmill power assets during the year as part of a non-core asset streamlining strategy; this is now reported under discontinued operations and has no material bearing on core aquaculture earnings power.
Cash Flow Analysis
Operating Cash Flow (Consolidated, FY26)
₹504.62 Cr
vs ₹584.36 Cr in FY25 — down ~13.6% YoY despite higher PAT
Free Cash Flow (OCF − Capex, FY26)
₹423.88 Cr
Capex of ₹80.74 Cr deployed in FY26
PAT vs OCF: A Gap Worth Flagging
Consolidated PAT (owners) rose 14.6% to ₹606 Cr in FY26, yet Operating Cash Flow fell ~13.6% to ₹505 Cr from ₹584 Cr. This divergence is explained largely by working-capital build-up: inventories rose by ₹59.2 Cr and other assets absorbed ₹29.9 Cr of cash during the year, alongside a swing in trade payables (a cash outflow of ₹19.2 Cr in FY26 versus a cash inflow of ₹79.2 Cr in FY25). None of this indicates earnings-quality problems on its own — cash conversion (CFO/Operating Profit) still stood at a healthy 99% — but it is a reminder that profit growth and cash generation did not move in lockstep this year.
Receivables vs Revenue Growth
Consolidated billed trade receivables grew only ~2.9% (₹139.8 Cr to ₹143.9 Cr) against 8.3% revenue growth — receivables growth trailing revenue growth is a healthy signal, indicating no channel-stuffing or collection slippage.
What Funds This Dividend?
The ₹136.2 Cr FY26 dividend outflow is comfortably funded by current-year free cash flow (3.11x covered) and, separately, by the company's large accumulated cash and investment balance of roughly ₹1,700 Cr (12.5x covered). There is no reliance on asset sales or borrowings to fund this payout.
Balance Sheet Strength
Total Borrowings (Consolidated, FY26)
₹10.46 Cr
Against total assets of ₹4,260 Cr — effectively debt-free
Cash & Bank Balances
₹42.23 Cr
Plus ₹395.7 Cr in other bank balances and ₹1,262 Cr in investments
Book Value per Share
₹241
CMP of ₹858 implies a Price/Book of ~3.6x
Return Ratios
ROE 18.3% | ROCE 24.4%
Both comfortably ahead of cost of capital
Total liabilities of ₹4,260 Cr are backed by equity of ₹3,708 Cr, with debt at a negligible ₹10.46 Cr. The balance sheet carries no meaningful leverage risk to the dividend, and the "almost debt-free" status flagged by independent screening tools is consistent with the FY26 audited numbers.
Dividend Sustainability Analysis
Earnings Coverage
4.45x (Consolidated EPS/DPS)
OCF Coverage
3.70x (OCF ÷ Dividend Outflow)
FCF Coverage
3.11x (FCF ÷ Dividend Outflow)
Cash/Liquidity Coverage
12.48x (Liquid Resources ÷ Dividend Outflow)
Overall Classification
Sustainable
All four coverage tests clear comfortably above 1x, debt is negligible, and earnings have grown at a double-digit pace over the past year. The payout ratio has fallen even as the per-share dividend has risen, suggesting management is not stretching the balance sheet to fund distributions. The main watch item is the OCF decline noted above — not a threat to the current dividend, but worth tracking if it persists into FY27.
Peer Comparison
| Company | Dividend Yield | ROE | ROCE | Cash Position |
|---|---|---|---|---|
| Avanti Feeds | 1.17% | 18.3% | 24.4% | Net cash, ~₹1,700 Cr liquid resources |
| Apex Frozen Foods | ~0.5% | ~7.6% | ~10.4% | Reducing debt, almost debt-free |
| Coastal Corporation | ~0.4-0.5% | ~2.6-9.8% (source-dependent) | ~5.8-9.6% (source-dependent) | Net debt of ~₹368 Cr (rising) |
Peer figures sourced from third-party financial data aggregators and are Not Independently Verified (NIV) by this desk against company filings; ranges reflect discrepancies across sources at the time of writing. Coastal Corporation figures vary materially by source and quarter.
Within its immediate listed shrimp-sector peer set, Avanti Feeds screens as the clear leader on dividend yield, capital efficiency (ROE/ROCE), and balance sheet strength. Both Apex Frozen Foods and Coastal Corporation currently offer materially lower yields and returns on capital, and Coastal Corporation carries meaningful net debt versus Avanti's net-cash position.
Promoter Impact Analysis
Promoter Holding (Mar 2026)
43.23%
Stable versus 43.25% in Mar 2025
Promoter Dividend Income
~₹58.88 Cr
43.23% × ₹136.2 Cr total dividend outflow
Public / Minority Shareholder Income
The remaining ~56.77% of the dividend pool, or approximately ₹77.33 Cr, accrues to institutional and public shareholders. Distribution is proportionate to holding, with no differential dividend class, so minority shareholders are treated pari passu with promoters on a per-share basis.
Shareholding Structure Note
The shareholding pattern also carries a stable 2.72% Government holding — an unusual line item for a private-sector aquaculture company — alongside FII holding of 7.63% (down sharply from over 14% a year earlier, following a large block sale by Thai Union Group entities in early 2025) and DII holding of 6.82%. Public shareholding has risen to 39.60% of the register.
Taxation Analysis
Under the current Indian tax regime, dividends received from domestic companies are taxable in the hands of the shareholder at their applicable income-tax slab rate — there is no separate concessional dividend tax rate for individuals. Companies are required to deduct TDS at 10% under Section 194 of the Income Tax Act where the aggregate dividend paid to a resident individual shareholder exceeds ₹5,000 in a financial year; this TDS is adjustable against the shareholder's final tax liability at return-filing time, not an additional cost.
Worked Example: Investor Holding 1,000 Shares, 30% Tax Slab
| Gross Dividend (1,000 shares × ₹10) | ₹10,000 |
| TDS deducted (10% u/s 194, since >₹5,000) | ₹1,000 |
| Tax payable at 30% slab (excl. cess/surcharge) | ₹3,000 |
| Net dividend in hand after full slab tax | ₹7,000 |
| Gross dividend yield (on CMP ₹858) | 1.17% |
| Post-tax effective yield (30% slab) | ~0.82% |
Illustrative only; excludes applicable surcharge and health & education cess, and does not constitute tax advice. Actual tax liability depends on the investor's total income, applicable slab, and any DTAA relief for non-resident shareholders. Investors should consult a qualified tax professional.
Key Risks
- Export market concentration and tariff risk: the company's shrimp processing and export business is exposed to trade-policy actions in key markets such as the United States, which have previously triggered sharp single-day stock price moves on tariff news.
- Raw material and feed cost volatility: shrimp feed margins are sensitive to fluctuations in fishmeal, soybean and other input costs, which directly affects the largest revenue segment.
- Q4 FY26 earnings deceleration: standalone net profit fell ~26% YoY in the March 2026 quarter; if this trend extends into FY27, it could pressure the pace of future dividend growth even though FY26 coverage remains strong.
- Associate-company asset risk: the Patikari Power hydel investment has already required a ₹12.97 Cr impairment following cloudburst damage; further write-downs cannot be ruled out until the asset's damage assessment and restoration are complete.
- Operating cash flow softness relative to profit growth: FY26 OCF fell even as PAT rose, driven by working-capital build-up; a repeat in FY27 would be worth monitoring for the trend, though it is not yet a red flag.
- Regulatory and labour-cost step-up: the new Labour Codes have already added a recurring cost burden; further clarifications from Central/State governments could alter this estimate.
- Sector-wide dependence on aquaculture cycles: shrimp farming output, disease outbreaks, and global shrimp pricing cycles are outside the company's direct control and affect both the feed and processing segments.
What To Monitor
- Q1 FY27 results (board meeting scheduled 13-Aug-2026 per company disclosures) for confirmation of whether the Q4 FY26 profit deceleration has persisted or reversed
- Trajectory of the Processed Shrimp segment margin, which drove the bulk of FY26 earnings growth — sustainability of this uplift is key to the next dividend cycle
- Operating cash flow trend in FY27 relative to reported PAT, given the FY26 working-capital-driven OCF decline
- Any further updates on the Patikari Power hydel plant restoration and possible additional impairment or recovery
- U.S. and EU trade-policy developments affecting Indian shrimp exports, given the export-heavy processed shrimp business
- Payout ratio trend — whether management continues to let payout ratio drift lower (~22% now) or begins returning a larger share of the growing profit pool
- Full effect of the new Labour Codes provisioning in subsequent quarters as government rules are finalised
Conclusion
Avanti Feeds' ₹10 final dividend for FY 2025-26 represents an 11.1% increase over the prior year and comes from a company with a virtually debt-free balance sheet, ROE of 18.3%, and dividend coverage in excess of 3x on every cash-flow and earnings basis tested. The headline "1,000%" dividend figure is a face-value artefact; the market-relevant yield of 1.17% is modest in absolute terms but well-supported. The most important nuance for readers is the divergence between strong full-year profit growth (driven disproportionately by the Processed Shrimp segment) and a softer Q4, alongside an operating-cash-flow dip that bears watching into FY27. None of the data reviewed here points to sustainability concerns for the declared dividend itself. As always, this is not a recommendation to buy, sell, or hold the stock — readers should weigh the positives, negatives, and risks laid out above against their own investment objectives.
Frequently Asked Questions
What dividend has Avanti Feeds announced for FY 2025-26?
What is the Avanti Feeds dividend yield?
What was the record date for the Avanti Feeds FY26 dividend?
What was the ex-dividend date?
When will the dividend be paid?
Who is eligible to receive the Avanti Feeds dividend?
How is the Avanti Feeds dividend taxed?
Is the Avanti Feeds dividend sustainable?
What is Avanti Feeds' dividend history?
What should investors monitor going forward?
How does Avanti Feeds' dividend compare with peers like Apex Frozen Foods and Coastal Corporation?
Why did Avanti Feeds' operating cash flow fall even as profit rose in FY26?
What is the total dividend outflow for Avanti Feeds in FY26?
Disclaimer
This article is prepared for general informational and educational purposes only and does not constitute investment advice, a recommendation, or a solicitation to buy, sell, or hold any security. ShareBazaar Online is not a SEBI-registered investment adviser or research analyst. All figures are drawn from the company's BSE/NSE filings dated 28th May 2026 and independently sourced third-party financial data platforms as of 24th-25th August 2026; some figures (marked NIV, ~, or *) are approximate, inferred, or Not Independently Verified and should be re-confirmed before making any investment decision. Past dividend performance is not indicative of future payouts. Please re-verify the live CMP, confirm the ex-date against the official NSE/BSE corporate-action circular, and consult a SEBI-registered investment adviser or tax professional before acting on any information in this article.