
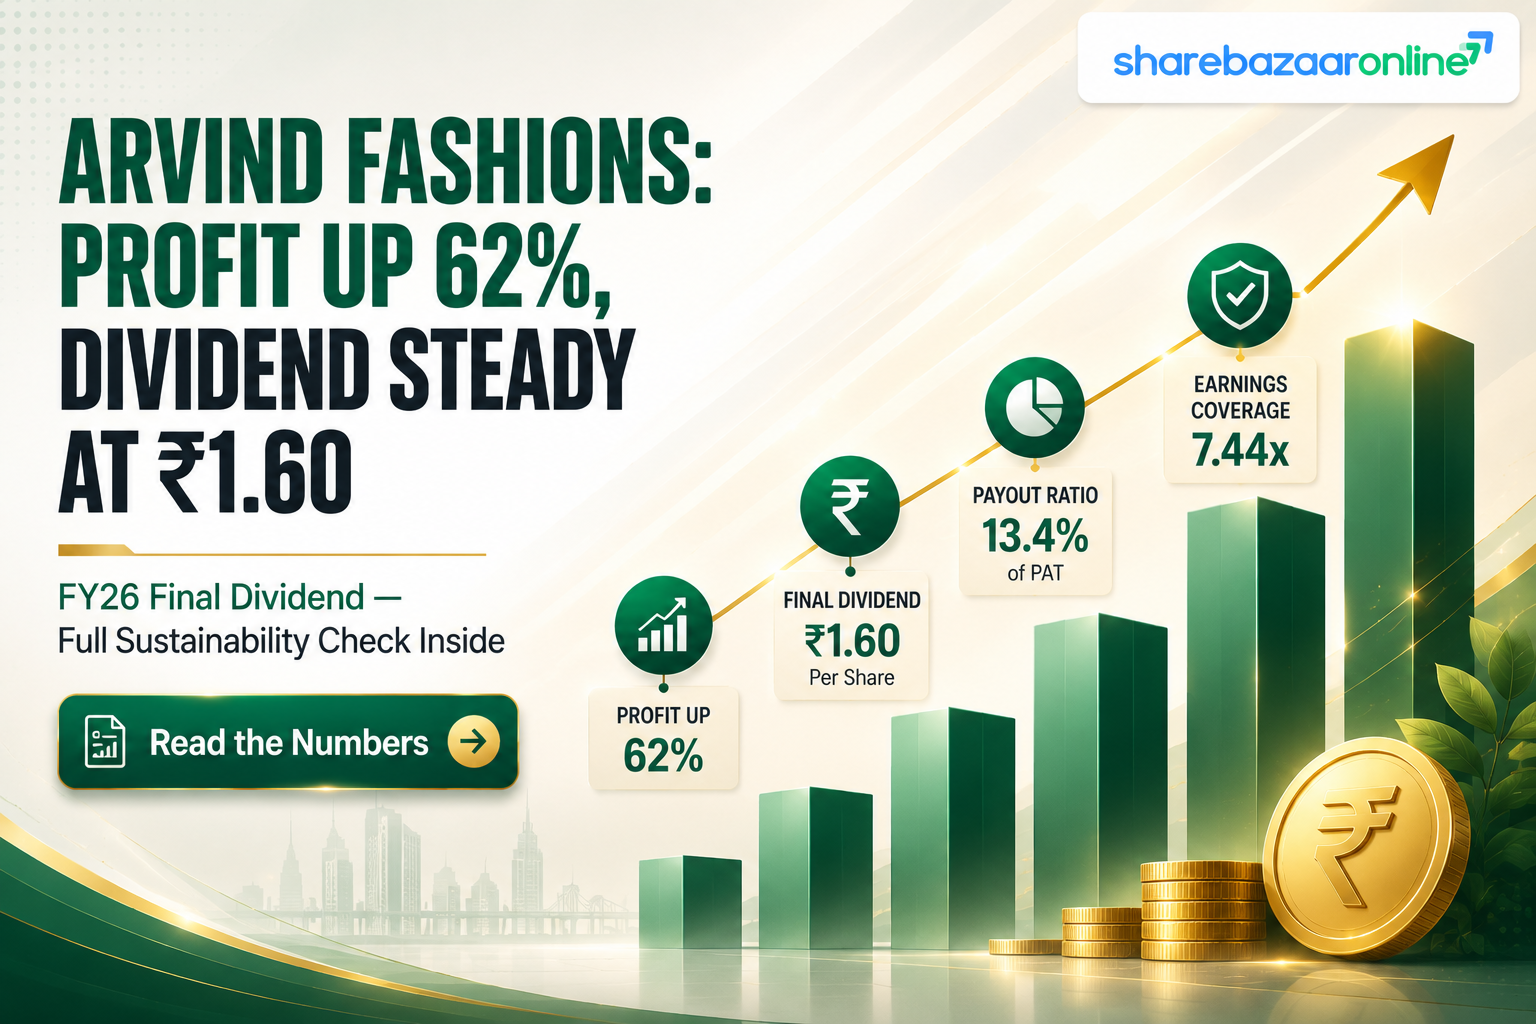
Dividend Snapshot
Company
Arvind Fashions Limited (NSE: ARVINDFASN | BSE: 542484)
Dividend Type
Final Dividend, FY2025-26
Dividend Per Share
₹1.60 on face value ₹4 (40% of face value)
Real Market Yield (CMP ₹451, 24-Aug-2026)
0.355%
Record Date
7 August 2026 (passed)
AGM Approval Status
Approved by shareholders at the 11th AGM held on 19 August 2026
Arvind Fashions Limited (AFL) recommended and shareholders subsequently approved a final dividend of ₹1.60 per equity share (face value ₹4 each) for the financial year ended 31 March 2026. The company describes this as a "40% dividend" — a figure calculated on face value, not on the market price. On the current market price of ₹451, the same payout actually works out to a real yield of just 0.355%. This gap between the headline face-value number and the real, price-based yield is the single most important thing to understand before treating this as a "high dividend" stock.
Dividend Announcement Summary
On 6 May 2026, the Board of Directors of Arvind Fashions Limited, at its meeting to approve the audited FY26 results, recommended a final dividend of ₹1.60 per equity share of face value ₹4 each, subject to shareholder approval at the Annual General Meeting (AGM). The recommendation coincided with the Board also approving the audited standalone and consolidated financial results for the quarter and year ended 31 March 2026, re-appointing Deloitte Haskins & Sells as statutory auditors for a second five-year term, and re-appointing Mahajan & Aibara Chartered Accountants LLP as internal auditors.
The 11th AGM of the company was held on 19 August 2026 via video conferencing, where shareholders formally approved the ₹1.60 final dividend along with the audited financial statements. This is the same per-share amount as the FY24-25 final dividend (also ₹1.60), meaning the dividend was held flat year-on-year even though consolidated profit attributable to shareholders swung from a loss in FY25 to a profit of ₹122.57 crore in FY26.
Financial Year
FY2025-26 (year ended 31 March 2026)
AGM Approval Requirement
Approved — ordinary resolution passed 19 August 2026
Key Dates Timeline
Board Recommendation Date
6 May 2026
Record Date
7 August 2026
Ex-Date
7 August 2026 (inferred as same-day under T+1 settlement; not independently confirmed against a separate NSE/BSE corporate-action circular)*
AGM Date
19 August 2026 (11th AGM, dividend approved)
Payment Date
Company stated payment would follow within 7 days of the AGM (on or before ~26 August 2026); the specific credited date is Not Disclosed by Company in the sources reviewed for this article.
Eligibility
Shareholders holding shares as of the record date (7 August 2026) were eligible to receive this dividend.
*Under India's T+1 settlement cycle, the ex-date and record date typically coincide. Readers should cross-check the exact ex-date against the official NSE/BSE corporate-action circular before relying on it for trading decisions.
Dividend Yield Analysis — The Face-Value Illusion
Arvind Fashions describes its ₹1.60 payout as a "40% dividend." That figure is calculated purely on the ₹4 face value of the share (1.60 ÷ 4 = 40%) — a number that has nothing to do with what an investor actually paid for the stock. Anyone buying AFL shares today is paying not ₹4, but somewhere around ₹451. On that basis, the real yield is a fraction of the headline number.
Face-Value "Dividend %" (company terminology)
40.00%
₹1.60 ÷ ₹4 face value
Real Market Yield (CMP ₹451, 24-Aug-2026)
0.355%
₹1.60 ÷ ₹451 CMP — re-verify before publishing
Announcement-Date Yield (NSE close, 6 May 2026: ₹480)
0.333%
The gap between the 40% face-value figure and the sub-0.4% real yield is roughly 113x. This is a pattern common to companies with low face values (₹2, ₹4, ₹5, ₹10) and should not be read as a signal of a high-yield stock.
Dividend History Analysis
| Financial Year | Dividend Per Share (₹) | YoY Change | Type |
|---|---|---|---|
| FY2016-17 to FY2021-22 | Nil | — | No dividend (company reported losses through most of this period, including pandemic years) |
| FY2022-23 | ~1.00 (NIV, aggregator-sourced) | Reinstated | Final |
| FY2023-24 | 1.25 | +25% | Final |
| FY2024-25 | 1.60 | +28% | Final |
| FY2025-26 (this dividend) | 1.60 | 0% (flat) | Final |
Classification: Reinstated / Early-Stage Grower, now Flat. AFL paid no dividend for roughly six consecutive years (FY17–FY22), a period covering the pandemic and heavy losses following the 2018 demerger from Arvind Limited. Since FY23, it has paid a dividend every year, growing from roughly ₹1.00 to ₹1.60 — a rough 3-year CAGR of ~17%. However, FY26 breaks that growth streak: the per-share amount was held flat at ₹1.60 despite consolidated profit attributable to shareholders swinging from a loss of ₹35.57 crore in FY25 to a profit of ₹122.57 crore in FY26. There have been no special dividends, no interim dividends, and no dividend cuts or suspensions since the FY23 reinstatement. The pre-FY24 per-share figures are sourced from third-party aggregators rather than primary exchange filings and are flagged as Not Independently Verified (NIV).
Financial Performance Analysis
Consolidated Revenue
₹5,266 Cr (FY26) vs ₹4,620 Cr (FY25) — up 14.0%
Consolidated EBITDA (excl. other income)
₹705 Cr (FY26) vs ₹602 Cr (FY25) — up 17.1%; margin 13.4% vs 13.0%
PAT Attributable to Equity Shareholders (Parent)
₹122.57 Cr (FY26) vs –₹35.57 Cr (FY25) — swing to profit
Standalone PAT (Parent Entity Only)
₹1.35 Cr (FY26) — near break-even
Operating leverage worked positively in FY26. Revenue grew 14.0% while EBITDA grew a faster 17.1%, expanding the EBITDA margin by roughly 36 basis points to 13.39% (the company's own investor deck rounds this to +40 bps). Management attributes this to gross-margin expansion (higher full-price sell-through, lower discounting, richer channel mix toward direct-to-consumer) rather than one-off cost cuts. Employee costs and other expenses grew broadly in line with revenue rather than materially outpacing it, so this is a genuine (if modest) margin-expansion story rather than aggressive cost-cutting.
Base-effect distortion flag: FY25 consolidated PAT attributable to parent was depressed by a one-time deferred-tax charge of roughly ₹120 crore (from the company opting into the Section 115BAA lower-tax regime) plus a Code-on-Wages provision. Because FY25 was an unusually low base, the FY26 profit "swing" and the 62% growth figure the company highlights (on a PAT metric that excludes these one-offs) look more dramatic than the underlying operating improvement alone would suggest. Readers should treat the reported PAT growth percentage with this base effect in mind.
Cash Flow Analysis
Consolidated Operating Cash Flow (CFO), FY26
₹404.31 Cr (vs ₹530 Cr in FY25 — down, largely on higher working-capital absorption)
Free Cash Flow (CFO − Capex)
₹295.36 Cr (Capex ₹108.95 Cr)
Cash is not the concern here — profit quality is reasonable, but working capital deserves scrutiny. Consolidated PAT (total, before minority interest) was ₹183.66 crore against operating cash flow of ₹404.31 crore, a CFO/PAT ratio of about 2.2x. That is comfortably healthy and suggests FY26 earnings were backed by real cash generation, not merely accounting profit.
However, the composition of working capital changed materially. Trade receivables grew just 3.0% year-on-year (₹729 Cr to ₹752 Cr) while revenue grew 14.0% — a favourable divergence indicating tighter collections and less channel-stuffing, not a red flag. But inventory grew 28.7% (₹1,080 Cr to ₹1,390 Cr), roughly twice the pace of revenue growth, and inventory days rose from 183 to 211. Management's stated explanation is a deliberate shift toward direct retail/D2C channels (which require the company to hold more stock than a wholesale-heavy model) and ahead-of-curve buying to hedge against West Asia-related input cost inflation — the company's own investor presentation calls this the "highest ever inventory freshness." That explanation is plausible given the channel-mix shift disclosed in the results, but a near-30% inventory build against 14% revenue growth is exactly the kind of divergence that warrants monitoring in subsequent quarters, since a reversal (inventory growing faster than sales without margin support) is a classic early symptom of demand softness or overstocking.
Is the dividend funded from earnings, cash reserves, asset sales, or borrowings? At the consolidated level, current-year free cash flow of ₹295.36 crore comfortably exceeds the ₹21.38 crore dividend outflow (13.8x coverage) — the dividend is funded from current-year cash generation, not from asset sales or fresh borrowings. At the standalone (parent-only) level the picture is different and is addressed separately under Promoter Impact and Sustainability below.
Balance Sheet Strength
Consolidated Cash & Equivalents (31-Mar-2026)
₹50.81 Cr
Net Financial Debt (excl. lease liabilities)
₹480.53 Cr (borrowings ₹531.34 Cr − cash ₹50.81 Cr)
Total Debt incl. Lease Liabilities (Ind AS 116)
₹1,335.88 Cr; net of cash ₹1,285.07 Cr
Consolidated Net Worth (31-Mar-2026)
₹943.64 Cr (equity capital ₹53.46 Cr + reserves ₹890.18 Cr)
A large share of AFL's reported "debt" is lease liabilities under Ind AS 116 (₹804.5 Cr combined current and non-current), an accounting consequence of leasing retail store space rather than conventional borrowed debt used to fund operations or dividends. Stripping lease liabilities out, pure financial borrowings stood at ₹531.34 crore against cash of ₹50.81 crore — a net financial debt of ₹480.53 crore. This is a moderate, retail-typical leverage level; it has not increased materially in a way that suggests debt is being used to fund the dividend, given that free cash flow alone covers the payout nearly 14 times over.
Dividend Sustainability Analysis
Test 1: Earnings Coverage (EPS ÷ DPS)
5.74x
EPS ₹9.18 vs DPS ₹1.60
Test 2: Operating Cash Flow Coverage
18.9x
Consolidated CFO ₹404.31 Cr vs outflow ₹21.38 Cr
Test 3: Free Cash Flow Coverage
13.8x
Consolidated FCF ₹295.36 Cr vs outflow ₹21.38 Cr
Test 4: Cash/Liquidity Coverage
2.4x (consol.) / 0.08x (standalone)
Consolidated cash ₹50.81 Cr vs outflow ₹21.38 Cr; standalone cash just ₹1.65 Cr
Overall classification: Sustainable, on a consolidated basis — with a structural standalone dependency worth understanding. On every consolidated test — earnings, operating cash flow, and free cash flow — the ₹21.38 crore total payout is covered many times over, and the payout ratio against consolidated profit attributable to shareholders is a conservative 17.4%. There is no evidence the dividend is being funded through debt or asset sales.
That said, Arvind Fashions Limited (the listed parent) reported standalone PAT of just ₹1.35 crore for FY26 — the dividend outflow of ₹21.38 crore is roughly 16x the parent's own standalone earnings, and standalone cash on hand (₹1.65 crore) covers barely 8% of the payout. This is not unusual for a holding-company-style structure: the parent's standalone cash flow statement shows it received ₹50.03 crore in dividend income from its own subsidiaries (Arvind Lifestyle Brands, PVH Arvind Fashion, and others) during FY26, which is the actual mechanism funding the shareholder dividend. Investors should understand that AFL's ability to keep paying dividends depends on its operating subsidiaries continuing to upstream cash to the parent, not on the parent's own standalone trading operations.
Peer Comparison
| Company | Latest DPS | Dividend Yield | Payout Ratio | ROE / ROCE |
|---|---|---|---|---|
| Arvind Fashions Ltd | ₹1.60 | 0.355% | 17.4% (consol.) | 14.1% / 19.6% |
| Vedant Fashions Ltd (Manyavar) | ₹8.00 | ~1.15% (NIV) | ~48.8% (NIV) | — |
| Arvind Ltd (group promoter entity, textiles) | ₹3.75 | ~1.17% (NIV) | ~31.8% (NIV) | — |
| ABFRL / Page Industries / Trent | Not Disclosed by Company | — | — | — |
AFL's real dividend yield sits meaningfully below listed apparel peers such as Vedant Fashions (Manyavar) and even below its own erstwhile parent, Arvind Limited. Cells left blank above reflect an absence of independently verified primary-source data for those peers at the time of writing rather than an estimate; readers comparing across peers should verify current figures independently. On profitability, AFL's ROCE of 19.6% (or 23.5% by the company's own calculation methodology, which appears to use a narrower capital-employed base) has improved for three consecutive years, but its 3-year average ROE of 6.30% is still flagged by data providers as low relative to history, reflecting the losses of FY20-22 still sitting in the trailing-3-year average.
Promoter Impact Analysis
Promoter Holding (Jun 2026)
35.10%
Promoter Dividend Income
₹7.51 Cr
FII Holding / Income
12.15% / ₹2.60 Cr
DII Holding / Income
24.99% / ₹5.34 Cr
Of the total ₹21.38 crore dividend outflow, promoters (the Lalbhai family group) receive an estimated ₹7.51 crore, minority shareholders (public, FII and DII holders combined, ~64.9%) receive the remaining ₹13.87 crore. Given the promoter stake has been broadly stable around 35% for the past two years (down from ~37% a year before that, likely diluted by ESOP allotments rather than a promoter sell-down), the distribution impact is proportionate and does not show signs of a promoter-favouring capital allocation pattern. Notably, public (retail) shareholding has fallen sharply — from about 38% two years ago to 27.76% as of June 2026 — while DII holding has more than doubled over the same period, indicating a shift in the shareholder base toward institutional ownership rather than a promoter-driven change.
Taxation Analysis
Under current Indian tax law, dividends are fully taxable in the hands of the investor at their applicable income tax slab rate; the erstwhile Dividend Distribution Tax regime was abolished in 2020. Companies are required to deduct TDS under Section 194 at 10% if the aggregate dividend paid to a resident individual shareholder (with PAN on record) exceeds ₹10,000 in a financial year; TDS rises to 20% if PAN is not linked/available, and different rates apply to non-resident shareholders under Section 195, subject to applicable tax treaty benefits.
Worked Example
An investor holding 1,000 shares of Arvind Fashions Limited at the ₹1.60 per share dividend, in the 30% tax slab:
| Gross Dividend (1,000 × ₹1.60) | ₹1,600.00 |
| Income Tax @ 30% slab | ₹480.00 |
| Add: Health & Education Cess @ 4% | ₹19.20 |
| Total Tax Liability | ₹499.20 |
| Net Dividend in Hand | ₹1,100.80 |
| Effective Post-Tax Yield (on CMP ₹451) | 0.244% |
Since gross dividend of ₹1,600 in this example is below the ₹10,000 TDS threshold, no TDS would be deducted at source in this specific case; the investor would still be liable to self-assess and pay the full tax due while filing their return. This example is for illustration only and is not tax advice — consult a qualified tax professional for your specific situation.
Key Risks
1. Inventory build outpacing sales. Inventory grew 28.7% against 14.0% revenue growth in FY26, pushing inventory days up to 211 from 183. If this is not fully explained by the channel-mix shift to direct retail, it could pressure future margins via markdowns.
2. Standalone parent-level earnings are thin. The listed entity's own standalone PAT was just ₹1.35 crore in FY26; dividend continuity depends on subsidiaries continuing to upstream cash, a structural feature rather than a direct standalone-earnings-driven payout.
3. Input cost and geopolitical exposure. The company's own investor presentation flags the West Asia conflict situation as a source of potential rupee pressure, raw material (including petroleum-derived inputs) and shipping cost inflation, which could compress margins in coming quarters.
4. Flat dividend despite profit recovery. The per-share dividend was held flat at ₹1.60 for a second consecutive year even as consolidated profit swung sharply higher, suggesting management is being conservative about committing to further payout growth — a signal investors should not over-extrapolate into future dividend growth expectations.
5. Declining public/retail shareholding. Public shareholding has fallen from ~38% to 27.76% over two years; while institutional ownership tends to bring liquidity and scrutiny, a shrinking free-float base among retail holders can occasionally correlate with reduced day-to-day trading liquidity for smaller investors.
6. Elevated valuation multiple. At a trailing P/E of roughly 46x against a 3-year average ROE of just 6.30%, the stock is priced for continued margin and earnings improvement; any disappointment in execution carries valuation-derating risk.
What To Monitor
1. Inventory days trend in H1 FY27. Watch whether the FY26 inventory build normalises as direct-channel sales absorb the higher stock, or whether it persists/worsens into markdowns.
2. Direct channel (retail + online B2C) share of revenue. Management's stated FY26 objective was a 100–200 bps increase in direct-channel share; continued progress here is central to the margin-expansion thesis.
3. Net store additions and same-store (LTL) growth. FY26 retail LTL growth was 8.1%; a slowdown here would be an early demand signal.
4. ROCE trajectory. ROCE has improved from 14% (FY24) to 19.6% (FY26, per Screener) / 23.5% (company metric); sustained improvement would support the current valuation premium.
5. Whether FY27's dividend resumes growth or stays flat. A third consecutive year at ₹1.60 would reinforce a conservative capital-allocation stance; an increase would signal management confidence in earnings durability.
6. Net debt (excl. lease) trend. Currently ₹480.53 crore; a rising trend alongside continued dividend payments would warrant closer scrutiny of funding sources.
Conclusion
Arvind Fashions Limited's ₹1.60 per share final dividend for FY26 — approved by shareholders at the AGM on 19 August 2026 — is, on the numbers, a well-covered, modestly sized payout. Consolidated free cash flow covers it nearly 14 times over, the payout ratio against consolidated profit is a conservative 17.4%, and there is no sign of the dividend being debt-funded. At the same time, the "40%" headline figure quoted on face value bears little relation to the sub-0.4% real yield an investor earns on the current market price, the dividend was held flat despite a sharp profit recovery, the standalone parent entity's own earnings remain thin relative to the payout, and inventory has built up meaningfully faster than sales. None of these points amount to a recommendation to buy, hold, or sell the stock — they are simply the positives, negatives, and risks that a reader should weigh for themselves, alongside the monitoring points listed above, before forming a view.
Frequently Asked Questions
What dividend has Arvind Fashions Limited announced for FY26?
What is the real dividend yield on Arvind Fashions shares?
What was the record date for this dividend?
What was the ex-date for the Arvind Fashions dividend?
When will the dividend be paid?
Who was eligible for the Arvind Fashions FY26 dividend?
How is this dividend taxed for Indian resident investors?
Is Arvind Fashions' dividend sustainable?
What is Arvind Fashions' dividend history?
What should investors monitor going forward?
Why is the dividend payout ratio so low at only 17.4%?
How much dividend income will promoters receive?
Why did the standalone (parent-only) profit differ so much from the consolidated profit?
Disclaimer
This article is for informational and educational purposes only and does not constitute investment advice, a recommendation, or a solicitation to buy, sell, or hold any security. ShareBazaarOnline is not a SEBI-registered investment adviser or research analyst. All figures are drawn from company filings, exchange disclosures, and third-party financial data aggregators as available at the time of writing and may contain errors, delays, or omissions; several figures (marked NIV / "Not Independently Verified") are sourced from secondary aggregators rather than primary exchange filings. Live CMP-dependent figures (yield, market cap) must be re-verified before publishing or acting on them, as they change continuously. Readers should independently verify all data, particularly dividend dates and payment status, directly from NSE/BSE filings, and consult a qualified financial advisor and tax professional before making any investment decision. Past dividend history and performance are not indicative of future payouts or returns.