
Dividend Snapshot
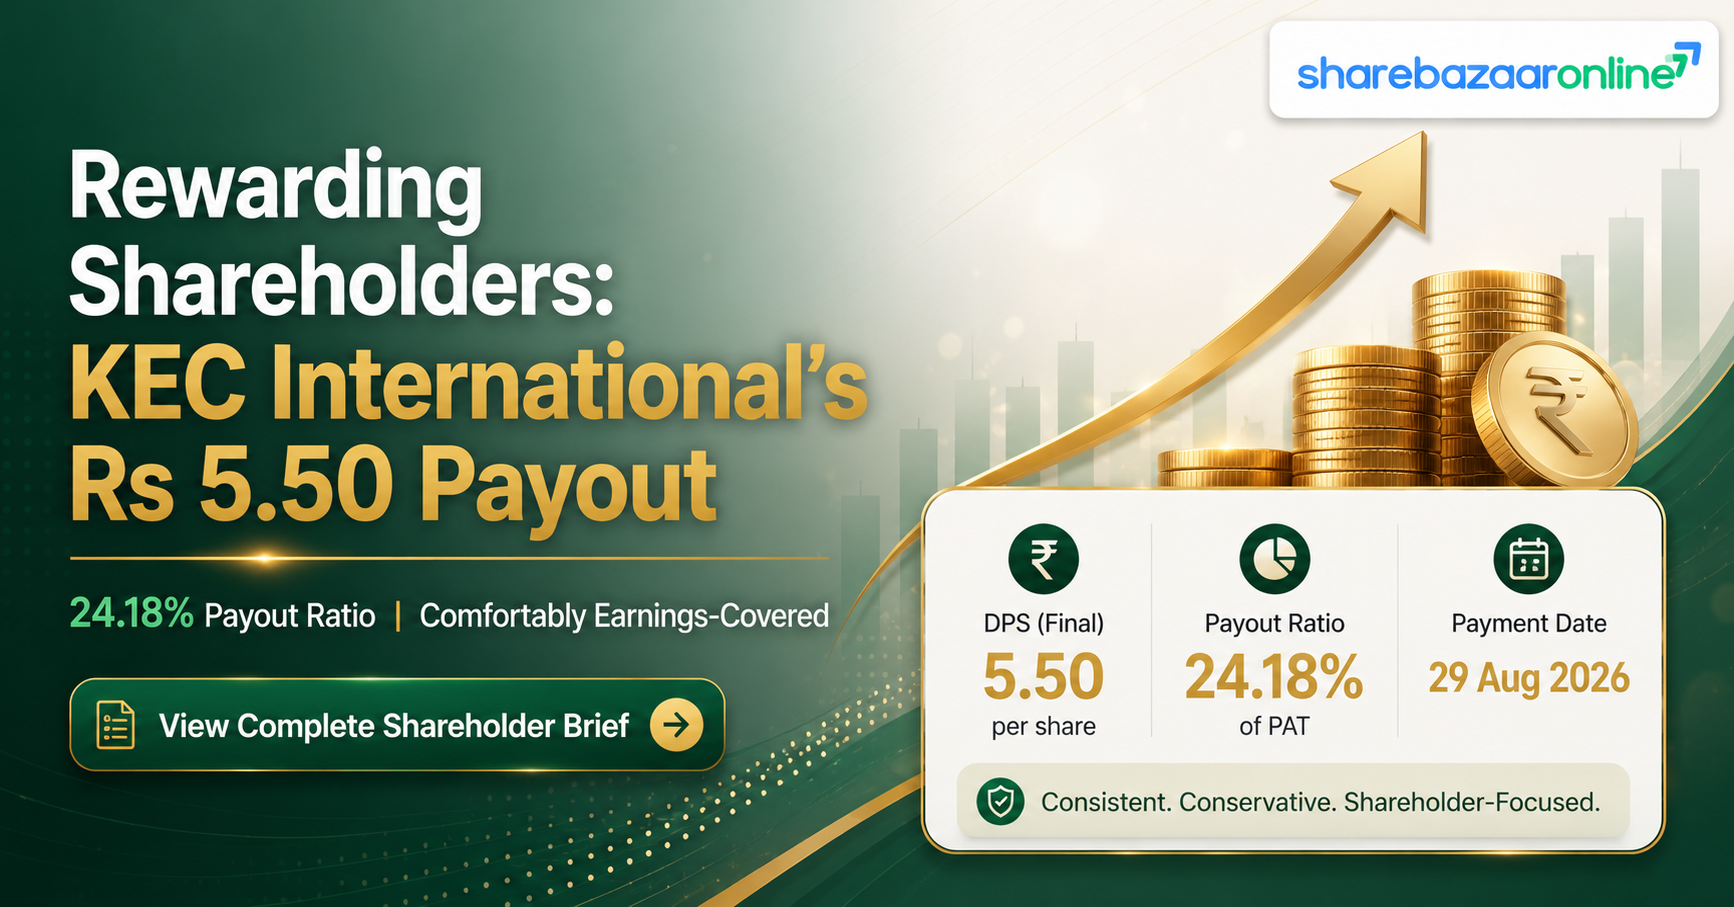
Dividend Per Share
₹5.50
275% of face value ₹2 per equity share
Real Market-Price Yield
1.26%
At CMP ₹436 (21 Aug 2026 close) — not the 275% face-value figure
Dividend Type
Final Dividend, FY2025-26
Recommended by Board on 16 May 2026; approved by shareholders at the 21st AGM held 21 August 2026
Total Dividend Outflow
₹146.41 Crore
On 26.62 crore equity shares outstanding
Record Date
7 August 2026 (past)
Payment Date
On or before 18 September 2026
Dividend Announcement Summary
KEC International Limited (NSE: KEC, BSE: 532714, ISIN: INE389H01022), the flagship engineering, procurement and construction (EPC) company of the RPG Group, announced on 16 May 2026 that its Board of Directors had recommended a final dividend of ₹5.50 per equity share of face value ₹2 each — equivalent to 275% of face value — for the financial year ended 31 March 2026. The recommendation accompanied the Board's approval of audited consolidated and standalone financial results for the quarter and year ended March 2026, both carrying an unmodified (clean) audit opinion from Price Waterhouse Chartered Accountants LLP.
What the Company Said
The Board recommended the dividend "for declaration by the Shareholders at the ensuing Annual General Meeting," with payment due within 30 days of shareholder approval. This is standard language for a final dividend, which — unlike an interim dividend — requires AGM approval before it becomes payable.
Subsequent Development
The Company subsequently fixed 7 August 2026 as the record date and convened its 21st AGM on 21 August 2026, where the dividend was placed for shareholder approval. The Company has indicated payment on or before 18 September 2026.
Key Dates Timeline
Board Recommendation
16 May 2026 (Saturday)
Record Date
7 August 2026
Ex-Date
7 August 2026
Under the current T+1 settlement cycle, SEBI norms align the ex-date with the record date for most large-cap dividend actions; investors should cross-check the NSE/BSE corporate-action circular for final confirmation.
21st Annual General Meeting
21 August 2026 (via video conferencing)
Payment Date
On or before 18 September 2026
Company-indicated payment window, within the 30-day statutory limit from AGM approval under the Companies Act, 2013.
As of the date of this analysis, both the record date and the AGM date have already passed, meaning eligibility determination is complete. Shareholders who held KEC International stock as on 7 August 2026 were entitled to this dividend.
Dividend Yield Analysis
The Face-Value Yield Illusion
KEC International's dividend is often quoted as "275%," which sounds spectacular but is calculated on the ₹2 face value of the share — not on what an investor actually pays in the market. This is a common source of confusion that commodity dividend coverage rarely clarifies. The number that matters to an investor is the real market-price yield, computed as Dividend Per Share ÷ Current Market Price.
Face-Value Yield (Misleading)
275.00%
₹5.50 ÷ ₹2 face value × 100
Real Market-Price Yield (Accurate)
1.26%
₹5.50 ÷ ₹436 CMP (21 Aug 2026) × 100
Why the Yield Looks More Attractive Now Than a Few Months Ago
KEC International's share price has fallen sharply over the past year — from a 52-week high near ₹938 to a 52-week low around ₹418-427 in August 2026, a decline of over 40%. Because yield is calculated as dividend ÷ price, this price decline mechanically pushes the yield higher even though the dividend per share is unchanged from the prior year. At the approximate announcement-date price of ₹471 (nearest available print around mid-May 2026; exact 16 May 2026 close is Not Independently Verified since markets were closed that Saturday), the implied yield was approximately 1.17%. This is a Yield Reality Check finding: the improved-looking yield reflects a falling share price and business/order-book concerns priced in by the market, not a dividend increase.
Dividend History Analysis
| Financial Year | Dividend/Share (₹) | Type | Payout Ratio |
|---|---|---|---|
| FY2015-16 | 1.00 | Interim | Not Disclosed by Company |
| FY2016-17 | 1.60 | Final | Not Disclosed by Company |
| FY2017-18 | 2.40 | Final | Not Disclosed by Company |
| FY2018-19 | 2.70 | Final | Not Disclosed by Company |
| FY2019-20 | 3.40 | Interim only (no final — pandemic year) | Not Disclosed by Company |
| FY2020-21 | 4.00 | Final | 19% |
| FY2021-22 | 4.00 | Final | 31% |
| FY2022-23 | 3.00 | Final (dividend cut) | 44% |
| FY2023-24 | 4.00 | Final | 30% |
| FY2024-25 | 5.50 | Final | 26% |
| FY2025-26 | 5.50 | Final (this article) | 24.18% |
Classification: Consistent Payer, Growing Trend
KEC International has paid a dividend in 9 of the last 10 years (with FY2019-20 seeing only an interim payout and no final dividend, likely a pandemic-era conservatism measure). Barring that one gap and a one-year cut in FY2022-23, the per-share dividend has trended upward, growing from ₹1.00 to ₹5.50 over ten years — a compounded annual growth rate of approximately 18.6%.
FY2025-26 Dividend Is Flat, Not Higher
Despite the higher-looking yield, the FY2025-26 dividend of ₹5.50 per share is unchanged from FY2024-25's ₹5.50 per share — the first year in the disclosed history where the dividend did not increase year-on-year. The payout ratio has also been declining (44% in FY23 to 24.18% in FY26), indicating EPS growth has outpaced dividend growth.
Financial Performance Analysis
Consolidated Revenue FY26
₹23,505.54 Cr
+7.6% YoY (FY25: ₹21,846.70 Cr)
Consolidated PAT FY26
₹605.59 Cr
+6.1% YoY (FY25: ₹570.74 Cr)
EBITDA (Operating Profit) FY26
₹1,869 Cr
+11.1% YoY (FY25: ₹1,683 Cr)
Basic EPS FY26 (Consolidated)
₹22.75
FY25: ₹21.44 (standalone comparable basis)
Operating Leverage: Modest Margin Expansion
Revenue grew 7.6% while EBITDA grew a faster 11.1%, indicating mild positive operating leverage and margin expansion (OPM improved from roughly 7.7% to 7.9-8.0% on a consolidated basis). However, PAT growth at 6.1% lagged EBITDA growth, primarily due to a one-time exceptional item of ₹58.78 crore relating to incremental employee benefit obligations under the New Labour Codes effective November 2025, and continued elevated finance costs (₹663.60 Cr, broadly flat YoY) reflecting the company's rising debt load.
Consolidated vs Standalone Divergence
Standalone PAT for FY26 was ₹428.09 crore against consolidated PAT of ₹605.59 crore — a divergence of roughly ₹177 crore attributable to subsidiary and joint-operation performance, most notably strong profitability from overseas subsidiaries and joint operations (one JV and two subsidiaries located outside India contributed profit after tax of ₹487 crore per the auditor's report). Standalone results also reflect a one-time non-cash gain of ₹166 crore from reversal of an impairment provision on the company's investment in KEC Investment Holdings, Mauritius — a non-operating item that should be excluded when assessing core standalone profitability.
Cash Flow Analysis
Reported Profits Are an Opinion. Cash Is a Fact.
This is the single most important finding in this analysis. While consolidated PAT grew a healthy 6.1% in FY26, Cash Flow from Operating Activities (OCF) swung sharply negative — from +₹419.07 crore in FY25 to -₹414.13 crore in FY26, a deterioration of over ₹833 crore. Free Cash Flow (FCF) followed the same path, moving from +₹270 crore in FY25 to -₹691 crore in FY26.
Operating Cash Flow FY26
-₹414.13 Cr
FY25: +₹419.07 Cr
Free Cash Flow FY26
-₹691.00 Cr
FY25: +₹270.00 Cr
Root Cause: Working Capital Build, Not Business Deterioration
Trade receivables grew 28.2% (₹5,051 Cr to ₹6,474 Cr) — nearly four times faster than the 7.6% revenue growth. Contract assets (unbilled revenue on long-cycle EPC projects) grew 9.8% to ₹12,128 crore. Simultaneously, trade payables declined 3.3%, removing a working-capital funding cushion the company had leaned on in prior years (payables had grown strongly in FY25). Debtor days rose from 84 to 101 over the year. This is a classic EPC-sector working-capital build: order execution accelerated (revenue up) but billing and collection cycles lengthened, and a large receivables/contract-asset base sits between recognised revenue and realised cash.
How the Dividend Was Actually Funded
With FY26 free cash flow negative, the ₹146.41 crore dividend outflow (relating to the FY25 dividend that was actually paid out during FY26) was not funded from current-year free cash flow. It was funded from a combination of the company's opening cash balance (₹545.69 Cr at start of year) and a sharp increase in short-term borrowings, which rose by ₹969.19 crore during the year on a net basis. Closing cash stood at ₹411.26 crore, down from ₹545.69 crore. This is a meaningful sustainability flag investors should weigh: the company is currently borrowing to bridge a working-capital-driven cash gap while continuing to distribute dividends.
Balance Sheet Strength
Net Worth (Consolidated, FY26)
₹5,682.05 Cr
Total Borrowings (Consolidated, FY26)
₹5,103.23 Cr
FY25: ₹3,701.10 Cr (+37.9% YoY)
Debt-to-Equity Ratio
0.87
FY25: 0.74 (company-disclosed)
Current Ratio
1.23
FY25: 1.19
Debt Is Rising While Dividends Continue
Consolidated borrowings rose 37.9% year-on-year to ₹5,103.23 crore, driven predominantly by a ₹969.19 crore net increase in short-term borrowings used to fund the working-capital gap discussed above. Net debt (borrowings less cash and equivalents) stood at approximately ₹4,691.97 crore at FY26-end, up meaningfully from the prior year. The Debt Service Coverage Ratio for the year was 1.56x (down from 1.32x TTM comparison basis) and the Interest Service Coverage Ratio was 2.15x — both still above 1x but showing a tightening trend against the backdrop of negative operating cash flow.
Dividend Sustainability Analysis
Earnings Coverage (EPS ÷ DPS)
4.14x
Comfortable margin above 1x
Operating Cash Flow Coverage
Not Meaningful (OCF Negative)
OCF FY26: -₹414.13 Cr
Free Cash Flow Coverage
Not Meaningful (FCF Negative)
FCF FY26: -₹691.00 Cr
Cash & Equivalents Coverage
2.81x
₹411.26 Cr cash ÷ ₹146.41 Cr outflow
Verdict: Conditionally Sustainable
KEC International clears the earnings-coverage test comfortably (4.14x) and retains adequate cash-balance coverage (2.81x) for the current dividend outflow. However, it fails both cash-flow-based tests this year: neither operating cash flow nor free cash flow covered the dividend, and the shortfall was bridged by rising short-term borrowings rather than internally generated cash. This is not, by itself, an immediate red flag for an EPC contractor with long working-capital cycles — such swings have occurred before (FY23 also saw a negative FCF year) — but it is a material amber flag. Classification: Conditionally Sustainable, contingent on working-capital normalisation (receivables and contract-asset collection) in FY27 and on debt levels not continuing to climb at the current pace.
Peer Comparison
| Company | Dividend Yield | Payout Ratio | ROE | ROCE |
|---|---|---|---|---|
| KEC International | 1.26% | 24.18% | 11.4% | 16.5% |
| Kalpataru Projects International | Not Independently Verified (range 0.8–1.5% across sources) | ~14.8% | ~9.7–12.9% (NIV, source range) | ~16–18% (NIV, source range) |
| Techno Electric & Engineering | 0.91% | ~22.5% | 13.0% | 16.0% |
Among power transmission and distribution EPC peers, KEC International's real market yield of 1.26% currently sits above both Kalpataru Projects International and Techno Electric & Engineering, largely a function of KEC's steeper share-price correction over the past year rather than superior shareholder distribution. On profitability, KEC's ROE (11.4%) and ROCE (16.5%) are broadly comparable to Techno Electric but trail Kalpataru Projects on ROCE by some peer-source estimates. Peer dividend-yield and return figures sourced from third-party aggregators show some variance across providers; where a range is shown above, verify against the company's own investor-relations disclosures before drawing conclusions.
Promoter Impact Analysis
Promoter Holding (RPG Group)
50.10%
As of June 2026 shareholding pattern
Promoter Dividend Income
₹73.35 Cr
50.10% × ₹146.41 Cr total outflow
Of the total ₹146.41 crore dividend outflow, promoter entity RPG Group receives approximately ₹73.35 crore, with the remaining ₹73.06 crore distributed among FIIs (9.92%), DIIs (23.34%) and public shareholders (16.64%). Promoter holding has declined modestly from 51.88% (through FY24) to 50.10% (from Sep 2024 onward), a change of roughly 1.78 percentage points, though it has remained stable at 50.10% for the last several quarters. The dividend distribution is broadly proportional and shows no evidence of disproportionate promoter benefit relative to public shareholders.
Taxation Analysis
How Dividends Are Taxed in India
Since April 2020, dividends from Indian companies are taxable in the hands of the shareholder at their applicable income tax slab rate, added to "Income from Other Sources." The company deducts Tax Deducted at Source (TDS) at 10% under Section 194 if the dividend paid to a resident individual exceeds ₹5,000 in a financial year (no TDS threshold change has been publicly notified for this dividend cycle at the time of writing; verify current TDS thresholds before filing). The actual final tax liability depends on the investor's total income and slab rate, adjusted against any TDS already deducted.
Worked Example: 1,000 Shares, 30% Slab
| Shares Held | 1,000 |
| Dividend Per Share | ₹10.00 (illustrative) |
| Gross Dividend | ₹10,000 |
| Tax @ 30% Slab | ₹3,000 |
| Net Dividend | ₹7,000 |
Applied to KEC's Actual ₹5.50/Share Dividend
| Shares Held | 1,000 |
| Gross Dividend | ₹5,500 |
| Tax @ 30% Slab | ₹1,650 |
| Net Dividend | ₹3,850 |
| Effective Post-Tax Yield | 0.88% (at CMP ₹436) |
This is illustrative and general in nature, not individual tax advice. Actual liability depends on total taxable income, applicable slab, any DTAA relief for non-resident shareholders, and surcharge/cess. Investors should consult a qualified tax advisor for their specific situation.
Key Risks
1. Negative Operating & Free Cash Flow
FY26 OCF of -₹414 crore and FCF of -₹691 crore mean the company is currently cash-consuming at the operating level, requiring continued borrowing to bridge the gap.
2. Rising Debt and Leverage
Total borrowings grew 37.9% YoY; Debt-to-Equity rose from 0.74 to 0.87. Continued reliance on short-term borrowings to fund working capital increases interest-rate and refinancing sensitivity.
3. Lengthening Working Capital Cycle
Debtor days rose from 84 to 101; receivables grew nearly 4x faster than revenue. A further stretch in the EPC-project billing/collection cycle would pressure liquidity and future dividend capacity.
4. Ongoing Government Investigation
The auditors flagged (Emphasis of Matter) an ongoing investigation by a government agency related to a transmission project, involving a chargesheet already filed and cognizance taken by the Court. The financial impact, if any, is currently not determinable.
5. Sharp Share-Price Decline
The stock has fallen over 40% from its 52-week high, touching fresh 52-week lows as recently as mid-August 2026, reflecting market concerns that go beyond the dividend narrative alone.
6. International and Geopolitical Exposure
The Group operates through 41 branches and numerous joint operations across geopolitically sensitive regions (Africa, Middle East, CIS states), exposing results to currency, political and execution risk in these markets.
What To Monitor
1. Operating Cash Flow Recovery in FY27
Watch whether Q1-Q2 FY27 OCF turns positive as receivables and contract assets are collected, signalling working-capital normalisation.
2. Debt Trajectory
Track whether total borrowings and the Debt-to-Equity ratio stabilise or continue climbing beyond the current 0.87x.
3. Order Book and Order Inflow Trends
New order wins in T&D, Railways, Civil and Cables segments directly drive future revenue visibility; management has cited a healthy order book alongside the FY26 results.
4. Resolution of the Government Investigation
Any material development in the court proceedings referenced in the auditors' Emphasis of Matter should be tracked for financial or reputational impact.
5. Merger of KEC Spur Infrastructure
The Board has approved a Scheme of Merger by Absorption of wholly-owned subsidiary KEC Spur Infrastructure Private Limited, subject to requisite approvals — monitor progress and any impact on consolidated financials.
6. Margin Trajectory
Continued OPM expansion (currently ~7.9-8.0%) would help offset finance-cost pressure and support future payout capacity.
Conclusion
KEC International's FY2025-26 final dividend of ₹5.50 per share continues an unbroken run of ten annual payouts (barring one pandemic-year gap) and is comfortably covered by earnings, with a payout ratio of just 24.18% and an earnings coverage of over 4x. The headline "275%" figure is a face-value artefact and should not be confused with the real market yield of 1.26%, which itself is elevated mainly because the share price has fallen more than 40% over the past year. The most important finding for investors to weigh is the cash-flow picture: both operating cash flow and free cash flow turned sharply negative in FY26, driven by a working-capital build in receivables and contract assets that outpaced revenue growth, and the dividend was effectively funded through cash reserves and increased short-term borrowings rather than current-year free cash flow. Rising leverage, an unresolved government investigation flagged by the auditors, and a lengthening collection cycle are the key factors to track into FY27. This analysis presents the facts, computations and risks; it does not constitute a buy, sell or hold recommendation. Readers should form their own view in light of their financial goals and risk appetite.
Frequently Asked Questions
What dividend has KEC International announced for FY2025-26?
What is KEC International's real dividend yield?
What was the record date for KEC International's FY26 dividend?
What was the ex-date for this dividend?
When will the KEC International dividend be paid?
Who is eligible to receive KEC International's FY26 dividend?
How is KEC International's dividend taxed for Indian resident investors?
Is KEC International's dividend sustainable?
What is KEC International's dividend history?
What should investors monitor going forward?
Why did operating cash flow turn negative despite rising profit?
How much dividend income does the RPG Group (promoter) receive from this payout?
Is this a final dividend or an interim dividend?
Disclaimer
This article is published by ShareBazaarOnline for informational and educational purposes only and does not constitute investment advice, a recommendation, or a solicitation to buy, sell, or hold any security. ShareBazaarOnline is not registered with SEBI as an investment adviser or research analyst. All figures are sourced from the company's regulatory filings (SEBI Regulation 33 intimation dated 16 May 2026), NSE/BSE disclosures, and third-party financial data aggregators as cited, and are believed to be accurate as of the date of publication but have not been independently audited by ShareBazaarOnline. Market prices, yields, and ratios are subject to change. Past dividend performance is not indicative of future payouts. Readers must conduct their own due diligence or consult a SEBI-registered investment adviser before making any investment decision.