
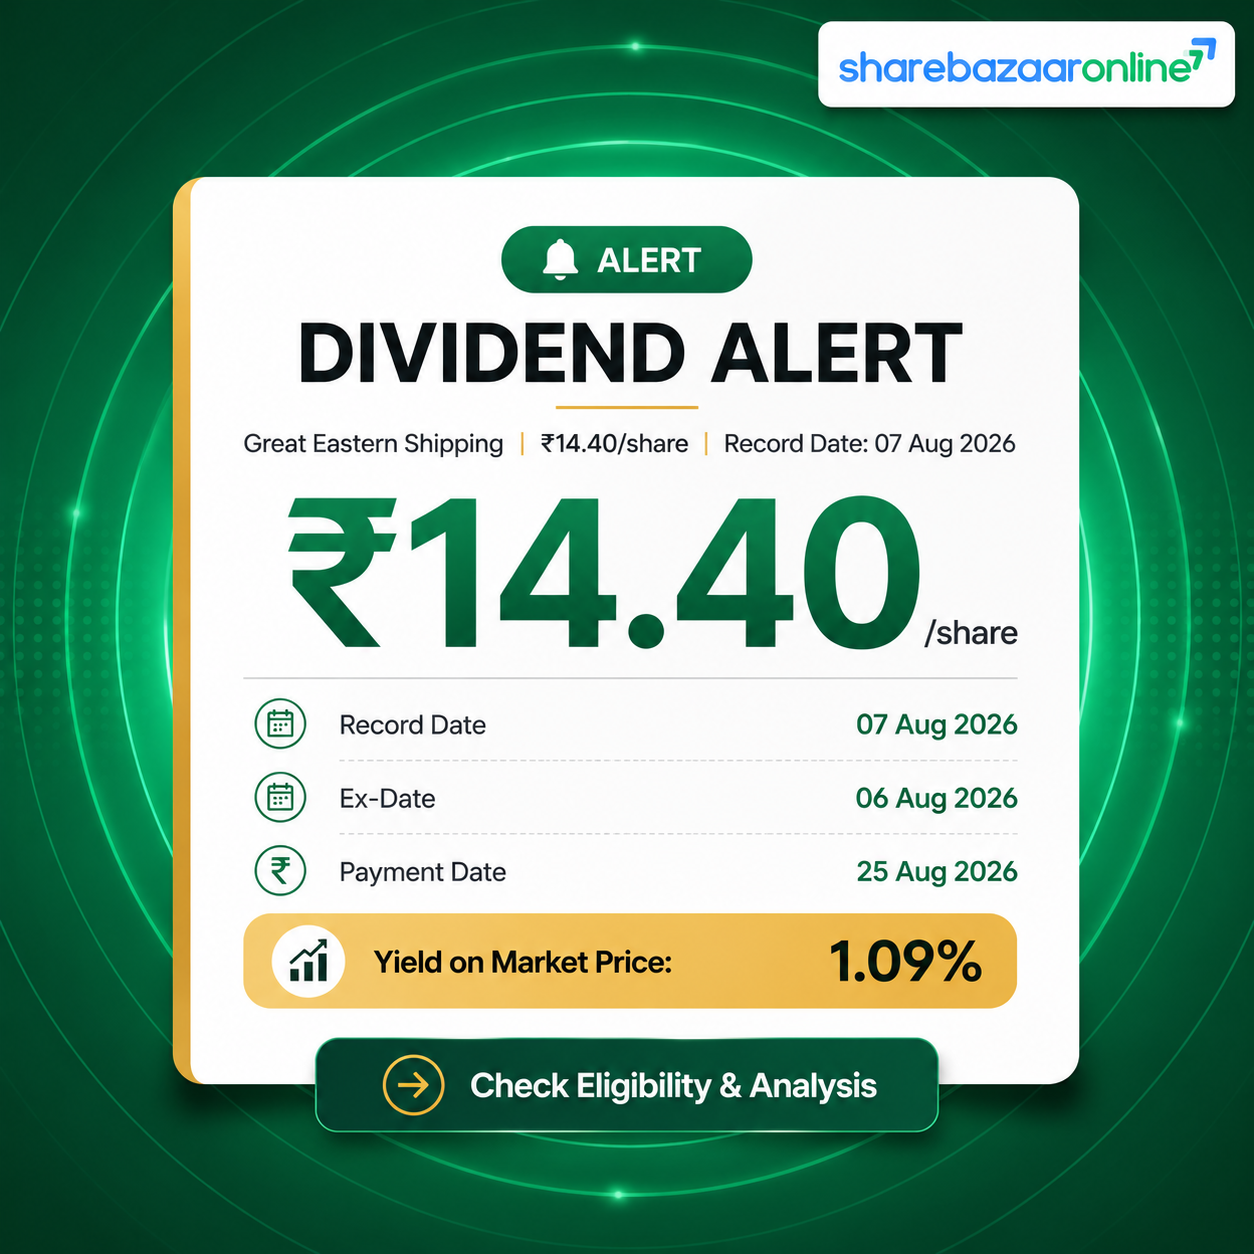
Dividend Snapshot
Company & Issue Details
| Company | The Great Eastern Shipping Company Limited |
| NSE Symbol | GESHIP |
| BSE Code | 500620 |
| ISIN | INE017A01032 |
| Sector | Shipping & Offshore Services |
| Auditor | Deloitte Haskins & Sells LLP |
Dividend Details
| Dividend Type | 1st Interim — FY 2026-27 |
| Dividend Per Share | ₹14.40 |
| Face Value | ₹10 per share |
| Dividend on Face Value | 144% |
| Financial Year | 2026-27 |
| Total Outflow | ₹205.59 Crore |
Yield at a Glance
| CMP (19-Aug-2026, NSE)* | ₹1,316 |
| This Interim Yield on CMP | 1.09% |
| Yield on Announcement Price | 1.03% (₹1,398 on 3-Aug-2026) |
| Trailing 12-Month Yield | 2.67% (₹35.10/sh) |
*Re-verify CMP before publishing. All yield figures are price-dependent.
Key Dates
| Announcement Date | 03-Aug-2026 |
| Record Date | 07-Aug-2026 |
| Ex-Date (Inferred T+1) | 06-Aug-2026† |
| Payment Date | On or after 27-Aug-2026 |
†Ex-date inferred under T+1 settlement rules. Verify against NSE/BSE corporate-action circular for confirmation.
Dividend Announcement Summary
Board Decision — 3 August 2026
The Board of Directors of The Great Eastern Shipping Company Limited (GESHIP) convened on 3 August 2026 at Ocean House, Mumbai. The meeting ran from 2:00 PM to 3:45 PM. Two landmark decisions were taken: the board approved the unaudited consolidated financial results for the quarter ended 30 June 2026 (Q1 FY 2026-27), and declared a 1st interim dividend of ₹14.40 per equity share of ₹10 each for the financial year 2026-27.
The dividend amount of ₹14.40 per share represents 144% on the face value of ₹10. At the NSE closing price of ₹1,398 on the announcement date, this translates to a single-interim yield of approximately 1.03%. The trailing 12-month dividend of ₹35.10 per share (all four FY 2025-26 interim payments) places the trailing yield at 2.67% on the current price of ₹1,316.
Critically, this ₹14.40 Q1 interim is exactly double the ₹7.20 paid in Q1 FY 2025-26 — a 100% year-on-year jump in the opening interim. At the 78th Annual General Meeting held on 5 August 2026, Chairman Bharat K. Sheth confirmed this as the highest-ever quarterly interim dividend in the company's history, directly reflecting the highest-ever quarterly profit posted in Q1 FY 2026-27.
Interim Dividend — No AGM Approval Required
As this is an interim dividend, it does not require shareholder approval at the Annual General Meeting. The Board of Directors has the statutory authority under the Companies Act, 2013 to declare interim dividends. The record date of 7 August 2026 was fixed by the Board to identify eligible shareholders. Payment is to be made on or after 27 August 2026 (explicitly company-disclosed), within the statutory 30-day window.
⚠ Analyst Note: The Face Value Yield Illusion
Headlines frequently report this dividend as "144% dividend" — referring to the percentage of face value (₹14.40 ÷ ₹10). This metric, while common, is analytically misleading for investors. What actually matters is the yield on market price. At ₹1,316 per share, this interim dividend delivers just 1.09%. Investors should anchor to market-price yield, not face-value percentage, when evaluating dividend income.
Key Dates Timeline
Board of Directors approved Q1 FY27 financials and declared 1st interim dividend of ₹14.40 per share for FY 2026-27.
Under T+1 settlement, the ex-date is typically one trading day before the record date. Shareholders who bought on or before 6 August were eligible. Note: This date is inferred — verify against NSE/BSE circular.
Shareholders whose names appeared in the company's register of members as of the close of business on 7 August 2026 were eligible to receive the dividend.
The company explicitly disclosed payment commencing on or after 27 August 2026. This date is company-confirmed, within the statutory 30-day window from declaration.
Dividend Yield Analysis
Yield Computations
| Headline “Yield” (Face Value) | 144% ⚠ |
| True Yield on CMP (₹1,316) | 1.09% |
| Yield on Announcement CMP (₹1,398) | 1.03% |
| Trailing 12M Yield (₹35.10 total) | 2.67% |
| 52-Week Range | ₹922 – ₹1,798 |
Coverage Ratios
| Q1 FY27 EPS / DPS | 6.37x |
| TTM EPS / DPS | 18.22x |
| This Div / Q1 FY27 PAT | 15.7% |
| FY26 OCF / FY26 Div Outflow | 6.9x |
| FY26 FCF / FY26 Div Outflow | 3.1x |
The Real Yield Story
GE Shipping's interim dividend of ₹14.40 per share sounds impressive at 144% of face value — a figure many financial aggregators lead with. However, at the current market price of ₹1,316, this single interim translates to just 1.09%. The more useful metric for income investors is the trailing 12-month yield of 2.67%, which aggregates all four FY 2025-26 interim dividends (₹7.20 + ₹7.20 + ₹9.00 + ₹11.70 = ₹35.10 per share).
If the company maintains this ₹14.40 quarterly pace for all four quarters of FY 2026-27, the annualised dividend could reach approximately ₹50–58 per share, implying a potential forward yield of 3.8–4.4% on today's price. This remains speculative and subject to freight rate cycles, earnings trajectory, and management's capital allocation priorities.
Dividend History Analysis
Quarterly Dividend Track Record (FY 2023-24 to FY 2026-27)
| Quarter / Interim | FY 2023-24 | FY 2024-25 | FY 2025-26 | FY 2026-27 |
|---|---|---|---|---|
| Q1 (Aug ex-date) | ₹5.40 | ₹9.00 | ₹7.20 | ₹14.40 ▲ |
| Q2 (Nov ex-date) | ₹6.30 | ₹7.20 | ₹7.20 | TBD |
| Q3 (Feb ex-date) | ₹6.30 | ₹8.10 | ₹9.00 | TBD |
| Q4 (May ex-date) | ₹10.80 | ₹5.40 | ₹11.70 | TBD |
| Full Year Total | ₹28.80 | ₹29.70 | ₹35.10 | ₹14.40+ (so far) |
Source: TipRanks, Simply Wall St, INDmoney (cross-referenced). All FY26 dividends were interim; no separate final dividend declared.
Classification: Consistent Quarterly Payer
GE Shipping classifies as a Consistent Payer with a quarterly interim dividend policy in place since at least FY 2023-24. The company does not declare a separate final dividend, instead distributing profits quarterly as the fiscal year progresses. This policy aligns with earnings visibility in the cyclical shipping business.
However, consistency in frequency does not imply consistency in amount. Full-year dividends ranged from ₹28.80 (FY24) to ₹35.10 (FY26), reflecting the inherent cyclicality of freight rates. The dividend has risen meaningfully over the past decade from ₹8.50 annually (FY2014) to ₹35.10 (FY26), a compound annual growth of approximately 13% per year over 10 years, albeit with interruptions during the 2018-2020 downcycle.
Financial Performance Analysis
● Record-Breaking Q1 FY 2026-27 (Consolidated)
The dividend is backed by the strongest single quarter in GE Shipping's history. Revenue from operations surged +66.9% YoY to ₹2,005 Crore. Operating profit more than doubled, rising +108.1% YoY to ₹1,338 Crore. Net profit jumped +159.4% YoY to ₹1,309 Crore, with basic EPS reaching ₹91.68 for the quarter alone — nearly half the full-year FY 2024-25 EPS of ₹164.
Q1 FY27 P&L: Year-on-Year (Consolidated)
| Particulars | Q1 FY27 | Q1 FY26 | Growth |
|---|---|---|---|
| Revenue (₹ Cr) | 2,005 | 1,201 | +66.9% |
| Operating Profit (₹ Cr) | 1,338 | 643 | +108.1% |
| OPM % | 66.7% | 53.5% | +1,320 bps |
| PBT (₹ Cr) | 1,365 | 536 | +154.6% |
| PAT (₹ Cr) | 1,309 | 505 | +159.4% |
| Basic EPS (₹) | ₹91.68 | ₹35.34 | +159.4% |
Full-Year Trend (Consolidated, ₹ Cr)
| Year | Revenue | PAT | EPS |
|---|---|---|---|
| FY 2021-22 | 3,509 | 630 | ₹44.09 |
| FY 2022-23 | 5,690 | 2,575 | ₹180.36 |
| FY 2023-24 | 5,255 | 2,614 | ₹183.11 |
| FY 2024-25 | 5,323 | 2,344 | ₹164.20 |
| FY 2025-26 | 5,409 | 2,943 | ₹206.11 |
| Q1 FY27 (alone) | 2,005 | 1,309 | ₹91.68 |
⚠ Earnings Quality Note: One-Time Items in Q1 FY27
The Q1 FY27 PAT of ₹1,309 Crore includes profit on sale of ships of ₹124.84 Crore (9.5% of PAT) — a non-recurring item. Additionally, other income of ₹156.01 Crore (11.9% of PAT) includes foreign exchange gains and investment income. Stripping these out, the core operational PAT is closer to ₹1,028 Crore — still exceptional, but the reported headline is partially inflated by asset recycling gains. Investors should note this context when projecting dividend sustainability at this pace.
Segment Performance: Both Engines Firing (Q1 FY27)
| Segment | Revenue (₹ Cr) | Segment Result (₹ Cr) | Margin |
|---|---|---|---|
| Shipping (Tankers, Dry Bulk) | 1,891 | 1,155 | 61.1% |
| Offshore (Oilfield Services) | 406 | 153 | 37.7% |
Cash Flow Analysis
● Cash Quality: Profits Are Real and Cash-Backed
For GE Shipping, the central question any analyst must answer is: do profits translate into actual cash? The answer is an emphatic yes. In FY 2025-26, the company generated Operating Cash Flow of ₹2,854 Crore against a Net Profit of ₹2,943 Crore — a CFO/PAT ratio of approximately 97%. Cash profits are almost exactly matching book profits. This is the hallmark of a high-quality earnings stream.
Cash Flow vs Profit (Consolidated, ₹ Cr)
| Year | OCF | PAT | FCF |
|---|---|---|---|
| FY 2022-23 | 2,975 | 2,575 | 2,776 |
| FY 2023-24 | 2,808 | 2,614 | 2,373 |
| FY 2024-25 | 2,647 | 2,344 | 2,472 |
| FY 2025-26 | 2,854 | 2,943 | 1,276 |
Dividend Funding Analysis (FY26)
| FY26 Total Dividend Outflow | ₹411 Crore |
| OCF Coverage (FY26) | 6.9x |
| FCF Coverage (FY26) | 3.1x |
| Cash Coverage (this interim) | 18.4x |
| Funding Source | Current Earnings |
⚠ FCF Declined in FY26 — Capex Cycle Explains It
Free Cash Flow dropped from ₹2,472 Crore (FY25) to ₹1,276 Crore (FY26). This is not a red flag in isolation. The company is actively modernising its fleet — the Chairman confirmed FY26 fleet modernisation capex of US$135 million. Q1 FY27 alone saw delivery of two secondhand tankers (Jag Abhishek, Jag Prabhu) and a Long Range-2 tanker (Jag Laxman). Simultaneously, three older vessels were recycled. FCF compression in the presence of a deliberate capex programme is expected and accounted for. The dividend remains fully funded from operating earnings.
Balance Sheet Strength
Key Balance Sheet Metrics (Q1 FY27, Consolidated)
| Total Assets | ₹20,267 Crore |
| Net Worth | ₹16,946 Crore |
| Total Borrowings | ₹799 Crore |
| Cash & Cash Equivalents | ₹3,786 Crore |
| Investments | ₹3,726 Crore |
| Total Liquidity (Cash+Bank+Investments) | ₹7,535 Crore |
| Net Cash (Liquidity minus Debt) | ₹6,735 Crore |
| Net Debt-Equity Ratio | −0.45x (Net Cash) |
Debt Reduction Trajectory (Consolidated, ₹ Cr)
| Year | Borrowings | Debt-Equity |
|---|---|---|
| FY 2019-20 | 5,295 | High |
| FY 2022-23 | 3,649 | Moderate |
| FY 2025-26 | 1,087 | 0.06x |
| Q1 FY26-27 | 799 | 0.04x |
GE Shipping has reduced borrowings by over 85% from the FY20 peak, transforming from a highly leveraged shipping company to an essentially debt-free enterprise.
Key Financial Ratios (Q1 FY27 Consolidated)
Dividend Sustainability Analysis
All four sustainability tests pass with significant headroom at current earnings levels. The payout ratio of 14–17% historically and the enormous cash buffer position GE Shipping as one of the most conservatively financed dividend payers in Indian shipping. The primary risk is cyclical: any sharp correction in tanker freight rates would compress earnings and may trigger dividend cuts, as happened during the 2017–2020 shipping downturn.
Four-Test Sustainability Scorecard
Payout Ratio History
| Year | EPS | DPS | Payout |
|---|---|---|---|
| FY 2022-23 | ₹180 | ₹30.60 | 17% |
| FY 2023-24 | ₹183 | ₹28.80 | 16% |
| FY 2024-25 | ₹164 | ₹29.70 | 18% |
| FY 2025-26 | ₹206 | ₹35.10 | 17% |
Conservative 14–18% payout policy leaves significant earnings reinvested for fleet growth and debt reduction.
Peer Comparison
GE Shipping vs Listed Shipping Peers
| Company | TTM Yield | Payout % | ROE | ROCE | Net Debt | P/E |
|---|---|---|---|---|---|---|
| GE Shipping (GESHIP) | 2.67% | 17% | 15.9% | 15.8% | Net Cash ₹6,735 Cr | 5.01x |
| Shipping Corp. of India (SCI) | ~2.2%* | ~36%* | 14.9%* | 9.9%* | Leveraged | — |
| SEAMEC Ltd | —* | —* | —* | —* | —* | 13.9x* |
*Peer metrics sourced from Dhan, MarketsMojo, GuruFocus (Aug 2026). Marked NIV where primary-source verification unavailable. Peer comparison should not be used as investment advice.
Competitive Position
Among Indian listed shipping companies, GE Shipping stands apart on three dimensions: it is essentially debt-free (net cash ₹6,735 Crore), it maintains the lowest payout ratio (17%), and it delivers the highest profitability margins (net margin 57%). SCI's higher yield (approximately 2.2%) comes at the cost of a 36% payout ratio and a materially leveraged balance sheet. GE Shipping's conservative payout reflects management's strategy of retaining earnings for fleet renewal and counter-cyclical acquisitions, not financial weakness.
Promoter Impact Analysis
Dividend Distribution by Holder Category
| Holder Category | Holding | Dividend Share |
|---|---|---|
| Promoters (Sheth family) | 30.08% | ₹61.84 Crore |
| FIIs | 31.03% | ₹63.79 Crore |
| DIIs | 12.81% | ₹26.34 Crore |
| Public & Others | 26.08% | ₹53.62 Crore |
| Total Outflow | 100% | ₹205.59 Crore |
Shareholding Pattern Trend
| Category | Mar 2026 | Jun 2026 | Change |
|---|---|---|---|
| Promoters | 30.08% | 30.08% | — |
| FIIs | 28.44% | 31.03% | +2.59% |
| DIIs | 15.25% | 12.81% | −2.44% |
| Public | 26.25% | 26.08% | −0.17% |
FII Accumulation: An Institutional Signal
One of the most analytically significant findings in this quarter's shareholding data is the jump in FII holding from 28.44% (March 2026) to 31.03% (June 2026) — an addition of 2.59 percentage points in a single quarter. Foreign institutional investors are the most rigorous analysts in any market. Their accumulation during a period of rising freight rates and strong earnings suggests positive forward conviction. Meanwhile, DIIs reduced exposure slightly, likely rotating into other opportunities rather than expressing concern about GE Shipping fundamentals.
Taxation Analysis
How Dividend Income is Taxed in India
Since the abolition of the Dividend Distribution Tax (DDT) in Budget 2020, dividends received from Indian companies are fully taxable in the hands of the investor at their applicable income tax slab rate. Key rules:
Worked Example — GE Shipping Dividend, 1,000 Shares
| Shares Held | 1,000 |
| Gross Dividend | ₹10,000 |
| TDS Deducted (10%) | −₹1,000 |
| Final Tax Liability (30% slab) | −₹3,000 |
| Net Post-Tax Dividend | ₹7,000 |
| Shares Held | 1,000 |
| Gross Dividend | ₹14,400 |
| TDS Deducted (10%) | −₹1,440 |
| Tax Liability (30% slab) | −₹4,320 |
| Net Post-Tax Dividend | ₹10,080 |
Tax computed at illustrative 30% slab. Actual liability varies by total income, applicable surcharge, cess, and residency status. Consult a tax professional for individual advice.
Key Risks
1. Freight Rate Cyclicality — The Core Risk
Shipping freight rates are notoriously volatile, driven by global trade flows, vessel supply, fuel prices, and geopolitical factors. GE Shipping's revenue nearly halved between FY22 and FY25 even as profitability held up, largely due to asset sales and cost discipline. A reversal in tanker rates — which drove the Q1 FY27 earnings surge — would directly compress revenue, operating margins, and hence dividend capacity.
2. Geopolitical Disruption to Trade Routes
Conflicts in the Red Sea, straits, and key chokepoints can disrupt trade routes and alter vessel demand abruptly. While route disruptions initially increased ton-mile demand (benefiting tankers), any normalisation could reduce freight volatility premia and impact earnings.
3. Fleet Age and Vessel Recycling Gains Are Non-Recurring
Q1 FY27 PAT includes ₹124.84 Crore from vessel sales (9.5% of PAT). The company sold three older tankers this quarter. As fleet recycling activity normalises, these one-time asset gains will disappear, compressing reported profits even if operations hold steady.
4. Offshore Segment — Margin Compression Risk
The offshore segment (oilfield services via Greatship India) operates at a lower margin (37.7%) versus the shipping segment (61.1%). Any weakness in global oilfield services demand, pricing, or contract renewals could reduce overall group profitability disproportionately.
5. Capital Allocation — Fleet Expansion at Cycle Peak?
The company is actively acquiring secondhand vessels at a time when shipping rates are near cyclical highs. Buying assets at premium valuations in a peak cycle environment carries the risk of significant impairment or poor return on capital if freight markets correct. US$135 million in FY26 fleet capex warrants close monitoring against future rate levels.
6. Energy Transition and Decarbonisation Headwinds
International Maritime Organisation (IMO) decarbonisation regulations are progressively tightening. Older vessels face stranded-asset risk, requiring expensive retrofits or early recycling. As GE Shipping's fleet evolves, regulatory compliance costs for emission standards could weigh on operating economics over the medium term.
What To Monitor
The single most important external metric. Revenue in Q1 FY27 surged 67% YoY — the primary driver was firmer freight rates. Weekly BDI/BDTI movements are the leading indicator of GE Shipping's next quarterly earnings and, by extension, dividend capacity.
Watch whether Q2 FY27 maintains the ₹14+ per share interim pace or whether management scales back. Q2 FY26 paid just ₹7.20 — any Q2 FY27 interim above ₹9–10 would signal continued bullishness.
The company contracted three vessels in Q1 FY27 and delivered two. Monitor the pace of secondhand acquisitions and asset values. Acquisitions at peak freight markets could impair returns if rates normalise.
FII holding jumped 2.59 percentage points in Q1 FY27. Monitor the September 2026 shareholding pattern disclosure. Continued FII accumulation above 31% would be a strong institutional vote of confidence. Any reversal warrants attention.
The offshore segment delivered ₹153 Crore profit on ₹406 Crore revenue (37.7% margin). This is well below the shipping segment's 61.1%. Offshore rig utilisation, contract wins via Greatship India, and day-rate trends are the metrics to track for a margin recovery narrative.
Outstanding NCD principal stands at ₹450 Crore (secured) plus ₹361.68 Crore (unsecured). Monitor quarterly repayments and refinancing activity. The company has maintained exclusive ship-asset cover of 2.92x market value, well above the 1.20x covenant threshold.
Conclusion
The Great Eastern Shipping Company Limited's 1st interim dividend of ₹14.40 per share for FY 2026-27 arrives on the back of one of the most impressive single quarters in the company's seven-decade history. Revenue surged 67%, operating profit more than doubled, and net profit jumped 159% year-on-year — culminating in a record quarterly EPS of ₹91.68. The Chairman confirmed this as the highest-ever quarterly interim dividend at the 78th AGM, a milestone that reflects both freight market strength and the fruits of a decade-long deleveraging journey.
The analytical picture is clear on fundamentals. With a net cash position of ₹6,735 Crore, OCF coverage of 6.9x, a historically conservative 17% payout ratio, and an interest coverage of 81x, the dividend is financially sustainable with enormous headroom. What makes GE Shipping genuinely differentiated from most Indian dividend payers is the combination of near-zero debt, high profitability, and disciplined capital allocation — all in a cyclical industry.
Two structural risks deserve weight: the inherent cyclicality of tanker freight rates means that today's exceptional earnings may not recur at this intensity, and the ₹124.84 Crore ship-sale gains embedded in Q1 PAT are non-recurring. Investors should assess GE Shipping's dividend through a cycle-adjusted lens, not just the current peak-cycle data point.
- › Highest-ever Q1 interim dividend
- › 100% YoY jump vs Q1 FY26
- › Near-zero debt (net cash ₹6,735 Cr)
- › 81x interest coverage
- › FII buying at 31% holding
- › Conservative 17% payout
- › Ship-sale gains = 9.5% of Q1 PAT
- › FCF down 48% vs prior year (capex)
- › Single-interim yield only 1.09%
- › Freight rate sensitivity high
- › Freight rate cyclicality
- › Fleet buybacks at peak pricing
- › IMO emissions regulations
- › Offshore margin compression
Frequently Asked Questions
What dividend has GE Shipping announced for FY 2026-27?
What is the GESHIP dividend yield for this interim dividend?
What is the record date for GESHIP dividend?
What is the ex-date for GESHIP interim dividend August 2026?
When will the GESHIP dividend be paid?
Who was eligible to receive the GESHIP dividend?
How is the GE Shipping dividend taxed for investors?
Is the GE Shipping dividend sustainable?
What is GE Shipping's dividend history over the last few years?
What should investors monitor going forward for GE Shipping?
Does GE Shipping need AGM approval for this dividend?
Why does GE Shipping show 144% dividend if the yield is only 1.09%?
Disclaimer
This article is published by ShareBazaar Online for informational and educational purposes only. It does not constitute investment advice, a recommendation to buy, sell, or hold any security, or any form of financial advice. ShareBazaar Online is not registered with the Securities and Exchange Board of India (SEBI) as an investment adviser or research analyst.
All financial data presented in this article has been sourced from publicly available information including the company's regulatory filings with BSE and NSE, Screener.in consolidated financials, TipRanks, INDmoney, MarketsMojo, Yahoo Finance, Google Finance, and other financial data providers. While we have made every reasonable effort to verify accuracy, we cannot guarantee the completeness or accuracy of third-party data. Figures marked NIV (Not Independently Verified) should be confirmed from primary sources before reliance.
Market price-dependent figures (dividend yield, market capitalisation) reflect prices as of 19 August 2026 and will change. Publishers should re-verify current market price before publication. The ex-date of 6 August 2026 is inferred under T+1 settlement and should be confirmed against the NSE/BSE corporate action circular.
Investing in equity shares involves significant risk including loss of principal. Past dividend history is not a guarantee of future dividends. Shipping is a cyclical industry and earnings can deteriorate rapidly with changes in freight rates, geopolitical conditions, fuel costs, and regulatory environments. Readers must conduct their own independent research and consult a SEBI-registered financial adviser before making any investment decisions.
Dividend taxation information is provided for general guidance only and does not constitute tax advice. Tax rules are subject to change. Consult a qualified tax professional for advice specific to your situation.