
Dividend Snapshot
Final Dividend Per Share
₹10.00
500% on face value of ₹2 (final dividend only)
Real Dividend Yield (Final)
~0.19%
Based on CMP of ~₹5,382 (NSE, 19 Aug 2026)
Full-Year FY26 Dividend: ₹53 (₹43 interim + ₹10 final) — full-year yield ~0.98%
Estimated Final Dividend Outflow: ~₹119.57 crore across ~11.96 crore equity shares
Dividend Type
Final Dividend
Face Value
₹2
Record Date
07 Aug 2026
Payment From
01 Sep 2026
Announcement
28 May 2026
AGM Date
27 Aug 2026
Financial Year
FY2025-26
Approval Status
Subject to AGM
The “500%” label describes the dividend as a percentage of the ₹2 face value, not the price you pay in the market. The real cash return on a share bought near ₹5,382 is a fraction of a percent. We explain this gap in detail below.
Dividend Announcement Summary
At its board meeting held on 28 May 2026, the Board of Directors of Alkem Laboratories Ltd recommended a final dividend of ₹10 per equity share (face value ₹2 each) for the financial year ended 31 March 2026. The recommendation is placed for shareholder approval at the company’s 52nd Annual General Meeting.
What the Board approved
- Audited standalone and consolidated results for Q4 and FY26
- Final dividend of ₹10 per share, subject to AGM approval
- Record date fixed at 07 August 2026
- Payment on and from 01 September 2026 (if approved)
- Re-appointment of Mrs. Madhurima Singh as Executive Director
The bigger FY26 distribution picture
This ₹10 final dividend follows a much larger interim dividend of ₹43 per share (2150% on face value) declared on 13 February 2026, with a record date of 20 February 2026 and payment from 06 March 2026. Together, the two payouts take the total FY26 dividend to ₹53 per share. The final tranche is the smaller of the two.
The auditors issued an unmodified (clean) opinion on the FY26 financial results. The final dividend remains a recommendation until shareholders approve it at the AGM.
Key Dates Timeline
| Event | Date | Status / Note |
|---|---|---|
| Board Announcement | 28 May 2026 | Board recommended the final dividend |
| Ex-Dividend Date | 06 Aug 2026 | Inferred (T+1). Confirm against exchange circular |
| Record Date | 07 Aug 2026 | Eligibility cut-off (as fixed by the company) |
| AGM Cut-off Date | 20 Aug 2026 | For AGM voting entitlement |
| 52nd AGM | 27 Aug 2026 | Where the final dividend is approved |
| Payment Date | 01 Sep 2026 (from) | If declared by shareholders |
Investors who held shares as on the record date of 07 August 2026 are the ones on the register for this final dividend. Because equity settlement in India is on a T+1 basis, the ex-date is inferred as one trading day before the record date; this should be verified against the official NSE/BSE corporate-action circular before relying on it.
Dividend Yield Analysis
The face-value illusion
A “500% dividend” sounds enormous, but that percentage is calculated on the ₹2 face value, not on the market price. On the ₹2 face value, ₹10 is indeed 500%. On a share you buy near ₹5,382, however, the ₹10 final dividend is a cash yield of only about 0.19%. That is the number that actually lands in your bank account relative to what you invested.
Yield at a glance
| Final dividend yield (on CMP ~₹5,382) | ~0.19% |
| Final yield on announcement price (~₹5,452) | ~0.18% |
| Full-year FY26 yield (₹53 on CMP) | ~0.98% |
| Face-value “dividend %” (final) | 500% |
Why the yield is low
Alkem is not a low-yield company because it is stingy — it is a growth-oriented pharma business that trades at a rich P/E of ~28x and a price of over ₹5,300. When the share price is high, even a healthy rupee dividend produces a small percentage yield. Even the full-year ₹53 payout works out to under 1%. This is typical of Indian pharma majors, where dividend yields cluster below 1%.
Yield figures are price-dependent and were computed on the CMP shown. Re-verify the live market price before treating any yield number as current.
Dividend History Analysis
| Financial Year | Interim | Final | Total DPS | Payout Ratio |
|---|---|---|---|---|
| FY2026 | ₹43 | ₹10 | ₹53 | ~27% |
| FY2025 | ₹37 | ₹8 | ₹45 | ~25% |
| FY2024 | ₹35 | ₹5 | ₹40 | ~27% |
| FY2023 | NIV | NIV | NIV | ~61% |
| FY2022 | NIV | NIV | NIV | ~25% |
NIV = Not Independently Verified per-tranche split. Payout ratios sourced from Screener.in. FY23 payout spiked because the company maintained a substantial dividend through a low-profit year.
The trend
Total dividend per share has risen steadily: ₹40 (FY24) → ₹45 (FY25) → ₹53 (FY26). Alkem has paid a dividend every year and has generally increased it, funding most of the distribution from the far larger interim payment rather than the final one.
Classification: Consistent, growing payer
Alkem behaves like a consistent dividend payer with a disciplined payout policy (broadly 25%-28% of profit in normal years). Importantly, it held its dividend even in FY23 when profit fell sharply, pushing the payout ratio to roughly 61% that year — evidence of a shareholder-friendly stance, though also a reminder that payout ratios can swing with earnings.
Financial Performance Analysis
| Consolidated (₹ Cr) | FY2024 | FY2025 | FY2026 | YoY (FY26) |
|---|---|---|---|---|
| Revenue | 12,668 | 12,965 | 14,712 | +13.5% |
| Operating Profit | 2,249 | 2,512 | 3,007 | +19.7% |
| Other Income | 186 | 494 | 407 | -17.6% |
| Profit Before Tax | 2,023 | 2,527 | 2,871 | +13.6% |
| Net Profit | 1,811 | 2,215 | 2,351 | +6.1% |
| EPS (₹) | 150.19 | 181.11 | 192.51 | +6.3% |
The earnings-quality catch aggregators miss
At first glance FY26 looks like a slow-growth year — net profit up just 6.1%. But look closer: revenue grew 13.5% and operating profit grew nearly 20%. The gap between strong operating growth and modest profit growth is explained by two below-the-line factors, not weak operations:
- Other income fell 17.6% (₹494 Cr to ₹407 Cr). FY25 profit was flattered by unusually high non-operating income.
- Tax rate normalised from ~12% in FY25 to ~18% in FY26, taking a bigger bite out of pre-tax profit.
- A one-time loss of about ₹135 crore in the March 2026 quarter (including a ₹60.27 crore gratuity/leave provision) further dampened reported Q4 profit.
In other words, FY26 earnings are arguably higher quality than the 6% headline suggests, because more of the profit came from the core operating business and less from one-off gains.
A structural note: the company transferred its Generic Business Undertaking to Alkem Wellness Limited on 01 October 2025, so recent quarters reflect a re-shaped business and year-on-year comparisons across the demerger boundary should be read with care.
Cash Flow Analysis
Reported profit is an accounting opinion; cash is fact. On this test Alkem looks solid. In FY26 the company generated ₹1,963 crore of operating cash flow and ₹1,476 crore of free cash flow — comfortably more than its entire FY26 dividend outflow of about ₹633.72 crore (interim plus final).
Cash generation (FY26)
| Operating cash flow | ₹1,963 Cr |
| Free cash flow | ₹1,476 Cr |
| Full-year dividend outflow | ~₹634 Cr |
| Net profit (for context) | ₹2,351 Cr |
How the dividend is funded
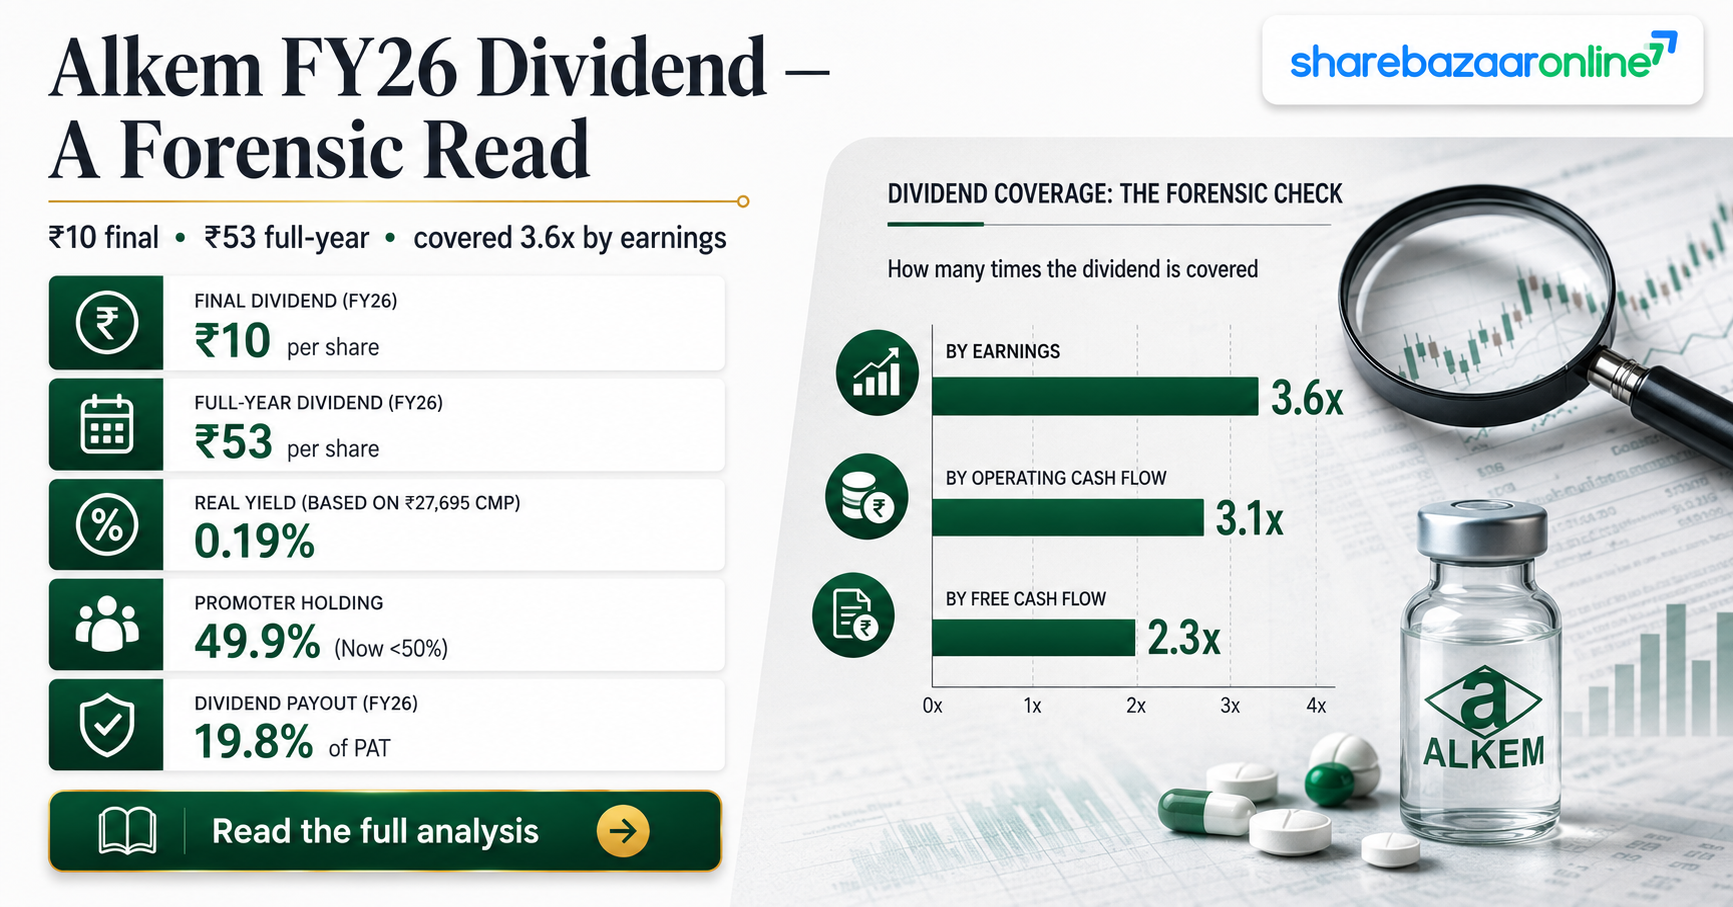
The full-year dividend is covered ~3.1x by operating cash flow and ~2.3x by free cash flow. This means the payout is funded out of current-year cash generation, not by dipping into reserves, selling assets or taking on debt. That is the strongest possible funding signal for a dividend.
One watch-item: working-capital intensity has crept up (debtor days ~74 and inventory days ~239 in FY26), which is why operating cash flow, while healthy, does not fully keep pace with the growth in operating profit.
Balance Sheet Strength
Key balance-sheet metrics (FY26)
| Net worth | ~₹13,820 Cr |
| Borrowings | ₹2,047 Cr |
| Investments | ₹1,869 Cr |
| Book value per share | ~₹1,156 |
| Debt-to-equity | Low (~0.1x) |
A near-net-cash pharma balance sheet
With borrowings of ~₹2,047 crore against investments of ~₹1,869 crore, Alkem’s net debt is minimal (roughly ₹178 crore) and its debt-to-equity ratio is very low. Return on capital employed of ~21% and return on equity of ~19% point to an efficient, well-capitalised business that can pay dividends without straining its finances.
Borrowings rose in FY26 (from ~₹1,381 Cr to ~₹2,047 Cr), partly reflecting acquisition and expansion activity such as the Occlutech medtech investment. The absolute leverage remains modest for a company of this size.
Dividend Sustainability Analysis
| Sustainability Test | Metric (Full-Year FY26) | Verdict |
|---|---|---|
| 1. Earnings coverage | EPS ₹192.51 vs DPS ₹53 = 3.6x | Strong |
| 2. Operating cash coverage | OCF ₹1,963 Cr vs ₹634 Cr = 3.1x | Strong |
| 3. Free cash flow coverage | FCF ₹1,476 Cr vs ₹634 Cr = 2.3x | Strong |
| 4. Liquidity / leverage | Near-net-cash; D/E ~0.1x | Strong |
Overall: Sustainable
On all four tests — earnings, operating cash, free cash and balance-sheet liquidity — the FY26 dividend clears the bar comfortably. The payout ratio of about 27% leaves ample profit for reinvestment, and cash generation more than doubly covers the cash paid out. The classification is Sustainable. The main forward caveat is the guided step-up in the tax rate for FY27 (see Key Risks), which could compress reported earnings even if operations stay healthy.
Peer Comparison
| Company | Div Yield | Payout | ROE | ROCE | P/E |
|---|---|---|---|---|---|
| Alkem Laboratories | ~0.98% | ~27% | ~18.9% | ~21.2% | ~28x |
| Sun Pharma | ~0.86% | NIV | ~15.8% | ~25.6% | ~35-39x |
| Dr Reddy’s | NIV | NIV | ~20-21% | ~25% | ~15-23x |
| Cipla | NIV | NIV | NIV | NIV | ~23x |
| Torrent Pharma | NIV | NIV | NIV | NIV | ~66x |
NIV = Not Independently Verified at time of writing (peer cells left blank rather than estimated). Peer figures are indicative and drawn from public sources on differing dates; confirm before publication.
Where Alkem sits
Indian pharma is structurally a low-yield sector — dividend yields across the majors cluster below 1%, because these are growth businesses trading at high multiples. On that yardstick, Alkem’s ~0.98% full-year yield is at the upper end of the peer pack, and its return ratios (ROE ~19%, ROCE ~21%) are competitive with much larger rivals. Investors chasing high dividend yield will not find it here or among peers; the appeal is steady, growing, well-covered payouts alongside capital growth.
Promoter Impact Analysis
Who receives the cash
| Promoter holding (Jun 2026) | 49.70% |
| Promoter share of final dividend | ~₹59.4 Cr |
| Promoter share of full-year (₹53) | ~₹315 Cr |
| Public shareholders’ share (full-year) | ~₹109 Cr |
The story in the shareholding
The more notable development is not the promoter’s dividend cheque but the steady fall in promoter holding — from 56.74% (Mar 2024) to 55.13% (Mar 2025) to 51.20% (Mar 2026) and now 49.70% (Jun 2026). The promoter stake has slipped below 50% for the first time. Over the same period, institutional ownership has risen (FIIs ~10.4%, DIIs ~22.6%), a shift long-term investors should track.
Dividends are paid pro-rata to all shareholders, so the promoter benefit is proportional to the stake and carries no preferential terms. The declining promoter percentage is the shareholding signal worth monitoring.
Taxation Analysis
How dividends are taxed in India
Since April 2020, dividends are taxed in the hands of the shareholder at their applicable income-tax slab rate; there is no separate dividend distribution tax at the company level. The company deducts TDS at 10% under Section 194 if the total dividend paid to a resident shareholder exceeds ₹10,000 in a financial year (the threshold was raised from ₹5,000). TDS is not a final tax — it is adjusted against your overall liability when you file your return.
Worked example — 1,000 shares, final dividend ₹10, 30% slab
| Gross final dividend (1,000 × ₹10) | ₹10,000 |
| TDS @ 10% (if aggregate crosses threshold) | ₹1,000 |
| Income tax @ 30% + 4% cess | ₹3,120 |
| Net dividend after tax | ₹6,880 |
| Pre-tax yield (on CMP) | ~0.19% |
| Post-tax yield (30% slab) | ~0.13% |
For a shareholder who received the full FY26 dividend of ₹53 per share (₹53,000 on 1,000 shares), tax at a 30% slab plus cess would be about ₹16,536, leaving roughly ₹36,464 in hand — a post-tax yield of about 0.68% on the CMP. Actual tax depends on your slab; consult a tax adviser.
Key Risks
- Tax rate step-up in FY27: Management and brokerages flag a rise in the effective tax rate from ~18% (FY26) to ~27-29% (FY27) as the company moves to the new tax regime. This alone can compress reported EPS even if the business grows, and could pressure the payout ratio.
- US FDA / regulatory risk: The Amaliya (Daman) facility received a Form 483 with 7 observations and an “Official Action Indicated” (OAI) classification. Adverse US regulatory outcomes can disrupt US revenue and approvals.
- Leadership transition: The CEO, Dr. Vikas Gupta, resigned effective 30 June 2026. Senior-management change introduces execution and continuity risk during a period of strategic diversification.
- Acquisition and diversification execution: The move into medtech via the Occlutech (Switzerland) acquisition takes Alkem outside its core pharma competency; integration and margin ramp-up carry execution risk, and borrowings have risen.
- Restructuring and comparability: The transfer of the Generic Business Undertaking to Alkem Wellness Limited (01 Oct 2025) reshapes the reported entity, complicating year-on-year comparisons and introducing corporate-action complexity.
- Modest medium-term growth and lumpy profits: Five-year sales growth has been a subdued ~10.7%, quarterly margins are seasonal, and one-off items (like the ~₹135 Cr Q4 FY26 loss) can swing reported profit.
What To Monitor
- Effective tax rate in FY27 results: Watch whether the guided move to ~27-29% materialises and how it flows through to EPS and the dividend.
- Promoter holding trajectory: Track whether the slide below 50% (now 49.70%) continues or stabilises in subsequent shareholding disclosures.
- US FDA resolution: Follow updates on the Amaliya OAI status and any re-inspection outcomes, which gate US business momentum.
- Operating margin and working capital: Monitor whether EBITDA margins hold near 20% and whether debtor/inventory days stabilise so operating cash keeps covering the dividend.
- New-product and diversification ramp: Watch traction in biosimilars, the semaglutide launch, the Occlutech medtech business and the CDMO vertical for the next leg of growth.
- Dividend policy consistency: Check whether the company sustains its ~25-28% payout discipline once the FY27 tax drag is absorbed.
Conclusion
Alkem Laboratories’ ₹10 final dividend for FY26 is a small cash return in percentage terms — about 0.19% on the current price — and it is the junior partner to the much larger ₹43 interim dividend that took the full-year payout to ₹53 (a ~0.98% yield). The “500%” headline reflects face value, not the return on your investment.
On the metrics that matter, the dividend is well-supported: it is covered ~3.6x by earnings, ~3.1x by operating cash flow and ~2.3x by free cash flow, and it sits on a near-net-cash balance sheet with ~21% ROCE. The dividend is Sustainable. The genuinely interesting signals are elsewhere — the higher-quality (if optically slower) FY26 profit, the promoter stake slipping below 50%, and a looming tax-rate step-up in FY27 that investors should factor into forward expectations.
Positives: strong cash coverage, low leverage, consistent and growing payouts, healthy return ratios. Negatives / watch-items: low absolute yield, FY27 tax drag, US FDA overhang, leadership change and falling promoter holding.
Frequently Asked Questions
What dividend has Alkem Laboratories announced for FY2026?
What is the real dividend yield on the Alkem final dividend?
What is the record date for the Alkem final dividend?
What is the ex-dividend date?
When will the final dividend be paid?
Who is eligible to receive the dividend?
Is the final dividend already approved?
How is the Alkem dividend taxed?
Is the Alkem dividend sustainable?
What is Alkem’s dividend history?
Why did net profit grow only ~6% in FY26 if revenue grew ~13%?
What should investors monitor going forward?
Disclaimer
This article is published by ShareBazaar Online for informational and educational purposes only. It is not investment advice and does not constitute a recommendation to buy, sell or hold any security. ShareBazaar Online is not a SEBI-registered investment adviser. All financial figures are sourced from company filings, exchange disclosures and third-party data providers (including Screener.in) and may contain errors or become outdated; several market-dependent figures such as the current price and dividend yield must be re-verified before use. Peer figures marked NIV were not independently verified at the time of writing. Dividend approval, record date and payment are subject to the company’s and shareholders’ actions. Investments in securities are subject to market risks; please read all related documents carefully and consult a qualified, registered financial adviser before making any investment decision. The author and publisher accept no liability for any loss arising from the use of this information.