
Dividend Snapshot
JTEKT India Limited (NSE: JTEKTINDIA, BSE: 520057) has recommended a final dividend of ₹0.75 per equity share for FY2025-26, which the company describes as a 75% dividend on the face value of Re. 1 per share. The recommendation was approved at the Board Meeting held on 14 May 2026 and is subject to shareholder approval at the 42nd Annual General Meeting.
CMP ₹130 as of 18 August 2026 (Screener/NSE close). Yields are price-dependent and must be re-verified against the live market price before any decision.
Dividend Announcement Summary
At its meeting on 14 May 2026, the Board of JTEKT India Limited recommended a final dividend of ₹0.75 per equity share of Re. 1 each (75%) for the financial year ended 31 March 2026. Per the company's filing, the dividend is subject to approval of members at the 42nd Annual General Meeting scheduled for 26 August 2026, and payment is to be completed within 30 days of declaration at the AGM.
The statutory auditors, B S R & Co. LLP, issued an unmodified (clean) audit opinion on the FY26 results. Importantly, the company confirmed it has no subsidiary, associate or joint venture as on 31 March 2026 — so the standalone financial statements effectively represent the full picture, and there is no consolidated-versus-standalone gap to reconcile for this analysis.
Editorial note — the "75%" headline: The 75% figure is the dividend expressed on the ₹1 face value, not a yield on the market price. On the traded price of about ₹130, the real cash return to a buyer today is roughly 0.58%. This distinction is the single most misread number in dividend reporting.
Key Dates Timeline
*Ex-date is inferred as equal to the record date under the T+1 settlement regime and should be confirmed against the official NSE/BSE corporate-action circular. The record date of 07 August 2026 has already passed; eligibility for this dividend was fixed as of that date. The company's filing states the payment date is not a fixed calendar date — it will be completed within 30 days of declaration at the AGM. A precise payment date was Not Disclosed by Company.
Dividend Yield Analysis
A "75% dividend" sounds large, but the cash yield an investor earns depends on the price paid for the share, not the face value. Here is the reality check:
The yield is modest and broadly in line with the auto-components sector. JTEKT India is not, and has never presented itself as, a high-yield income stock; the dividend is a token distribution alongside heavy reinvestment in the business. The stock has also de-rated meaningfully over the past year (down from the ₹188 area), which mechanically lifts yield — but here the yield remains low because the payout itself is small.
The ~₹128 announcement-window price is an approximation from mid-May 2026 trading (results were released after market hours on 14 May, with the trading window closed till 16 May). It should be re-verified against the exact NSE close on the announcement date.
Dividend History Analysis
JTEKT India has paid a dividend every year through the last decade, making it a consistent annual payer. The per-share amount has been on a steady rising path since the pandemic trough, though the absolute rupee sums remain small.
| Financial Year | Dividend / Share (₹) | Payout Ratio |
|---|---|---|
| FY2025-26 | 0.75 | 27% |
| FY2024-25 | 0.70 | 24% |
| FY2023-24 | 0.60 | 14% |
| FY2022-23 | 0.50 | 15% |
| FY2021-22 | 0.40 | 30% |
| FY2020-21 | 0.15 | 30% |
| FY2019-20 | 0.35 | 31% |
| FY2018-19 | 0.80 | 29% |
The pattern shows a clean recovery: after the ₹0.15 COVID-year trough (FY21), the dividend has risen every single year — 0.15 → 0.40 → 0.50 → 0.60 → 0.70 → 0.75. Classification: Consistent Payer with a rising per-share trend, but the low payout ratio in the strong FY24 year (14%) shows the board prioritises reinvestment over distribution when growth capex demands it.
Dividend history sourced from TipRanks/Screener corporate-action records; per-share figures are on the current Re. 1 face value. Historical per-share figures have not been separately restated here for the FY26 rights-issue bonus element.
Financial Performance Analysis
FY26 was a year of strong top-line growth but flat bottom-line — a classic operating-leverage squeeze. Revenue rose while profit barely moved.
The number that matters: Revenue grew +11.1% but PAT grew only +2.2%, and EPS actually fell about 2% (from ₹2.90 restated to ₹2.84). The EPS decline despite higher profit is because the FY25 rights issue increased the share count from 25.43 crore to 27.74 crore — profits are now spread over more shares. Growth in the business did not translate into per-share value creation this year.
FY26 profit also carries an exceptional loss of ₹5.98 Cr, driven mainly by a ₹2.45 Cr past-service gratuity cost from the new Labour Codes and a voluntary separation scheme. Reported PAT before that item was healthier, but the recurring earnings quality is best judged on operating profit, which grew only in line with a compressing margin.
Cash Flow Analysis
Reported profits are an opinion; cash is a fact. This is where the FY26 story changes character. The company generated positive operating cash but spent vastly more on capacity, leaving deeply negative free cash flow.
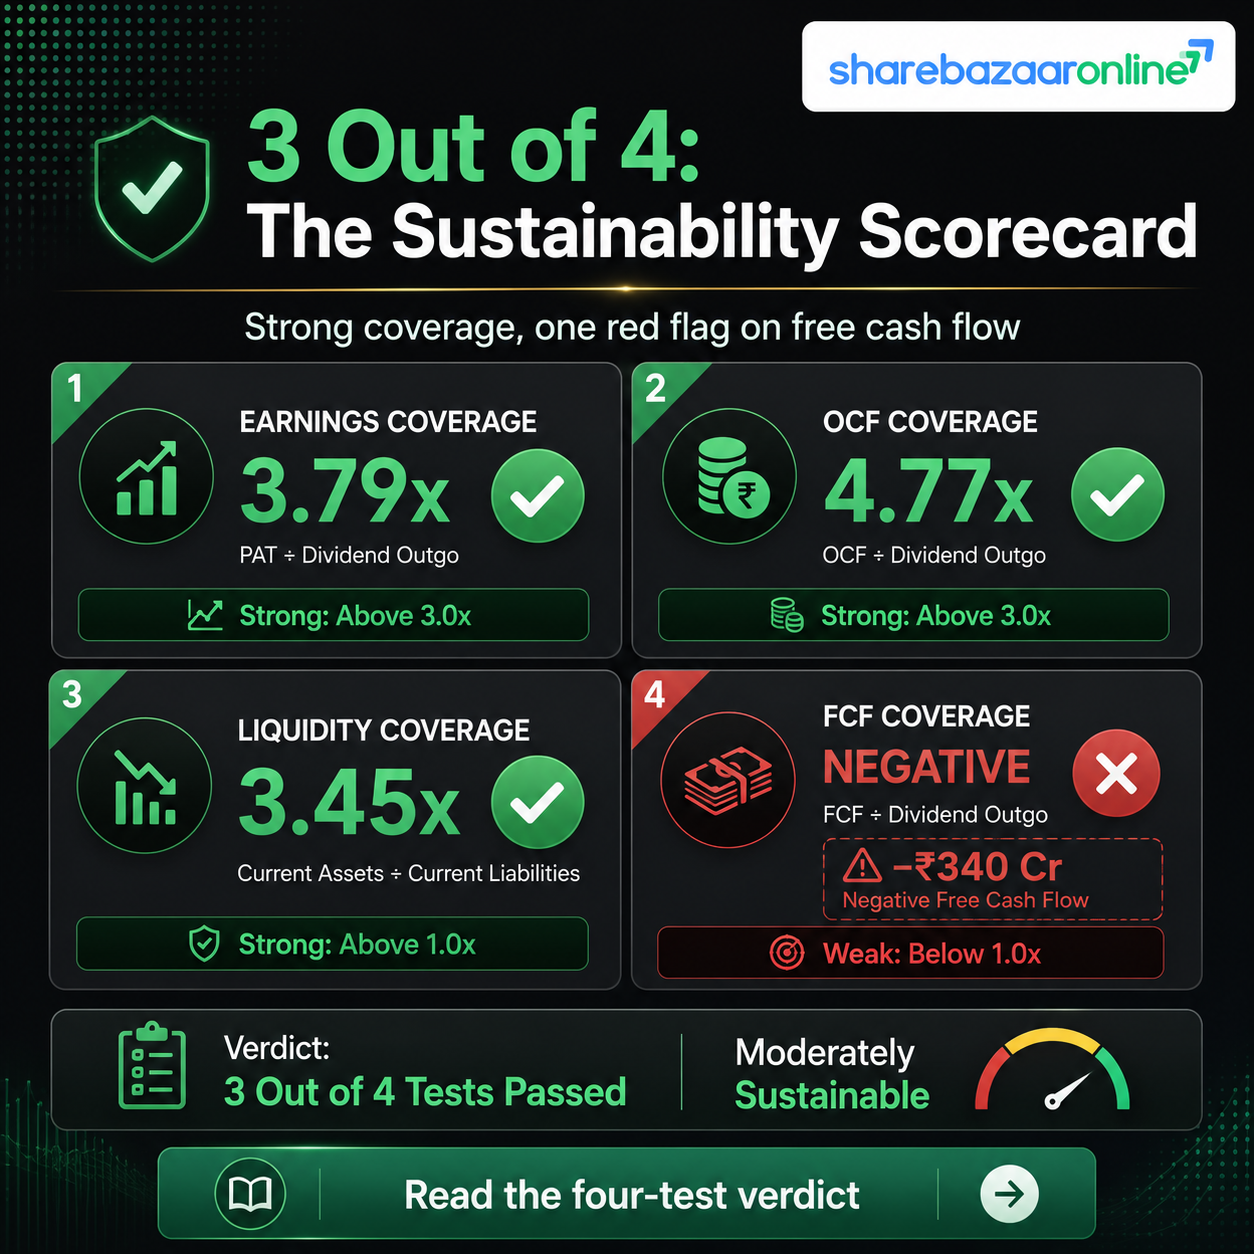
How was the dividend funded? Free cash flow was negative ₹340 Cr in FY26 — operating cash of ₹99 Cr was dwarfed by ₹440 Cr of capex. The ₹20.8 Cr dividend was therefore not funded by free cash flow this year. It was effectively financed from the ₹249.88 Cr rights issue and fresh borrowings, which together funded the capex programme. On a narrow operating basis the dividend is comfortably covered (OCF is nearly 5x the payout), but on an all-in free-cash basis the company is in a cash-consuming investment phase.
Also worth noting: OCF fell from ₹194 Cr in FY25 to ₹99 Cr in FY26, and the cash-conversion (OCF as a share of operating profit) dropped to about 64% from 119%, partly because trade receivables jumped — a working-capital drag to watch.
Balance Sheet Strength
Debt is rising while dividends are paid: Total borrowings more than doubled from about ₹156 Cr to ₹337 Cr in FY26, an increase of roughly ₹181 Cr, taken on to fund the large capex. The balance sheet is still conservatively leveraged (D/E just 0.28x) and equity was boosted by the rights issue, so this is comfortably serviceable — but it is a genuine directional shift from the near-debt-free profile of a few years ago, and it is happening in the same year as a dividend and heavy investment.
Book value stands at about ₹42.8 per share, and the stock trades around 3.0x book. Liquidity of ₹72 Cr covers the ₹20.8 Cr dividend about 3.5x, so there is no affordability question on the payout itself.
Dividend Sustainability Analysis
We score the dividend against four independent tests:
Verdict: Moderately Sustainable. The payout passes three of four tests decisively — it is a small fraction of earnings, comfortably covered by operating cash, and easily covered by liquid resources. The one blemish is the negative free cash flow, but that is a deliberate consequence of an expansion-driven capex cycle funded by a rights issue, not a sign of distress. The dividend is very affordable in absolute terms; the caveat is that earnings growth per share has stalled, so meaningful growth in the dividend depends on the new capacity delivering returns.
Peer Comparison
| Company | Div Yield | Payout | ROE | ROCE |
|---|---|---|---|---|
| JTEKT India | ~0.58% | 27% | 7.8% | 9.8% |
| Sona BLW Precision | ~0.38% | — | 20.6% | 21.5% |
| Sundram Fasteners | ~0.75% | 30% | — | ~17% |
| Gabriel India | — | — | — | — |
Within the auto-components space, JTEKT India's yield is unremarkable and its return ratios are the weak point: ROE of ~7.8% and ROCE of ~9.8% trail higher-quality peers such as Sona BLW (ROE ~20%, ROCE ~21%). The company is a category leader in steering systems by volume, but its capital efficiency is currently subdued as recent large investments have not yet begun earning their full return.
Peer figures are indicative, drawn from public screeners at various recent dates and are not all as-of the same date; cells left blank where a like-for-like confirmed figure was not available (marked —). Verify before publication.
Promoter Impact Analysis
JTEKT Corporation, Japan controls the company with a 74.98% promoter stake — near the 75% regulatory ceiling. That concentration means the bulk of any dividend flows straight back to the parent.
Of the total ₹20.8 Cr payout, roughly ₹15.6 Cr goes to the Japanese promoter and about ₹5.2 Cr is shared across all minority shareholders (DIIs ~10%, FIIs ~0.6%, public ~14%). The dividend is not a case of promoters extracting cash at minority expense — the payout ratio is a modest 27% and the same per-share rate applies to everyone — but the economic benefit is, by ownership arithmetic, overwhelmingly the parent's.
Taxation Analysis
Since April 2020, dividends in India are taxed in the hands of the shareholder. There is no Dividend Distribution Tax at the company level anymore. Key rules:
- Dividend income is added to your total income and taxed at your applicable income-tax slab rate.
- The company deducts TDS at 10% under Section 194 only if your total dividend from that company in a financial year exceeds ₹5,000 (TDS is 20% if PAN is not provided).
- Non-resident shareholders face different TDS rates, subject to treaty relief.
Worked Example — 1,000 shares, ₹0.75 dividend, 30% tax slab
This is a general illustration, not tax advice. Surcharge and cess may apply at higher incomes. Consult a qualified tax adviser for your specific situation.
Key Risks
- Customer concentration: Steering & columns are ~94% of revenue and the business is heavily exposed to a small set of passenger-vehicle OEMs (notably Maruti Suzuki). A demand shift or share loss at a key customer would hit the top line directly.
- Return-ratio compression: ROCE has fallen from the mid-teens to around 10% after roughly ₹800 Cr of capex over three years. If new capacity does not ramp to healthy utilisation, returns and per-share earnings could stay depressed.
- Rising debt and negative free cash flow: Borrowings more than doubled to ₹337 Cr and FY26 free cash flow was negative ₹340 Cr. Continued heavy investment funded by debt raises the financial-risk profile.
- Margin pressure: Operating margin has drifted to around 8% (from double digits historically), squeezed by raw-material, employee and other costs; the June-2026 quarter margin slipped to ~5.3%.
- Regulatory / one-off costs: The new Labour Codes triggered a gratuity past-service charge, and the company flagged a GST show-cause notice with an interest demand — areas that can produce further exceptional items.
- EV/technology transition: The shift toward electric power steering and evolving vehicle architectures requires continuous product investment; execution risk is real for a component supplier.
What To Monitor
- Capacity utilisation of new lines: Watch ramp-up and utilisation of the recently commissioned CVJ and steering-gear lines — the whole return-on-capital story hinges on this.
- Free cash flow turning positive: Track whether capex tapers and FCF returns to positive territory in FY27 onwards; this is the key to a growing dividend.
- Operating margin trajectory: Monitor whether OPM recovers back toward double digits from the current ~8% as volumes and mix improve.
- Debt levels: Follow total borrowings and net debt — any further sharp rise would be a caution flag given the concurrent dividend.
- Driveline & CVJ revenue mix: The ~4% driveline share is the stated growth engine; watch it scale as a share of total revenue.
- Receivables / working capital: Keep an eye on debtor days and the OCF-to-operating-profit conversion, which weakened in FY26.
- AGM approval: Confirm the dividend is ratified at the 26 August 2026 AGM.
Conclusion
JTEKT India's FY26 final dividend of ₹0.75 per share (75% on face value) is best understood as a small, reliable token distribution rather than an income proposition — the real yield is about 0.58%. The company remains a consistent annual payer with a rising per-share trend and a comfortable 27% payout, and the dividend is easily affordable out of earnings, operating cash and liquidity.
The more important signals sit below the headline. Revenue grew a healthy 11%, but per-share earnings slipped as the rights-issue share count expanded; free cash flow was sharply negative on a ₹440 Cr capex year; debt more than doubled; and return ratios are subdued versus stronger peers. This is a company in an investment phase: it is choosing to plough capital into new capacity, funding that with a rights issue and debt, while keeping the dividend token but intact.
Positives — category leadership in steering, unbroken dividend record, clean audit, conservative starting leverage, growing driveline optionality. Negatives — low and falling returns on capital, flat EPS, negative free cash flow, rising debt, heavy customer concentration. The dividend itself is not in question; whether it can meaningfully grow depends entirely on the new investments earning their keep.
Frequently Asked Questions
What dividend has JTEKT India announced for FY2025-26?
What is the JTEKT India dividend yield?
What is the record date for the JTEKT India dividend?
What is the ex-dividend date?
When will the dividend be paid?
Who is eligible to receive this dividend?
How is the JTEKT India dividend taxed?
Is the JTEKT India dividend sustainable?
What is JTEKT India's dividend history?
Why did EPS fall despite higher profit in FY26?
How was the FY26 dividend funded?
How much of the dividend goes to the promoter?
What should investors monitor going forward?
Disclaimer
This article is for informational and educational purposes only and does not constitute investment, financial, legal or tax advice, nor a recommendation to buy, sell or hold any security. ShareBazaar Online is not a SEBI-registered investment adviser or research analyst. Figures are drawn from the company's audited filing dated 14 May 2026 and publicly available third-party sources (Screener, TipRanks, exchange records) and may contain errors or become outdated; market-price-dependent figures such as yield must be re-verified against the live price before any decision. The record date (7 August 2026) has passed and the dividend remains subject to shareholder approval at the AGM on 26 August 2026. Investors should conduct their own research and consult a qualified, registered adviser before investing. Investments in securities are subject to market risks; past performance is not indicative of future results.